| Param | Original file | Final file |
|---|---|---|
| Filename | modeM0/AS1A04_218T01_9000002194_14854cztM0_level2.evt | modeM0/AS1A04_218T01_9000002194_14854cztM0_level2_quad_clean.evt |
| Size (bytes) | 526,622,400 | 107,619,840 |
| Size | 502.2 MB | 102.6 MB |
| Events in quadrant A | 3,692,749 | 702,277 |
| Events in quadrant B | 3,861,629 | 690,525 |
| Events in quadrant C | 3,935,274 | 678,703 |
| Events in quadrant D | 3,956,074 | 672,086 |
| Mode SS | |||
|---|---|---|---|
| Quadrant | BADHDUFLAG | Total packets | Discarded packets |
| A | 0 | 150 | 0 |
| B | 0 | 150 | 0 |
| C | 0 | 150 | 0 |
| D | 0 | 150 | 0 |
| Mode M0 | |||
|---|---|---|---|
| Quadrant | BADHDUFLAG | Total packets | Discarded packets |
| A | 0 | 15686 | 3 |
| B | 0 | 16206 | 2 |
| C | 0 | 16072 | 2 |
| D | 0 | 17088 | 2 |
| Mode M9 | |||
|---|---|---|---|
| Quadrant | BADHDUFLAG | Total packets | Discarded packets |
| A | 0 | 7 | 0 |
| B | 0 | 7 | 0 |
| C | 0 | 7 | 0 |
| D | 0 | 8 | 0 |
| Quadrant | Total seconds | Saturated seconds | Saturation percentage |
|---|---|---|---|
| A | 7413 | 96 | 1.295022% |
| B | 7413 | 117 | 1.578308% |
| C | 7413 | 39 | 0.526103% |
| D | 7413 | 118 | 1.591798% |
Noise dominated data is calculated using 1-second bins in cleaned event files. If a bin has >2000 counts, and if more than 50% of those come from <1% of pixels, then it is considered to be noise-dominated and hence unusable.
| Quadrant | # 1 sec bins | Bins with >0 counts | Bins with >2000 counts | High rate bins dominated by noise | Noise dominated (total time) | Noise dominated (detector-on time) | Marked lightcurve |
|---|---|---|---|---|---|---|---|
| A | 7828 | 7414 | 2 | 2 | 0.03% | 0.03% | 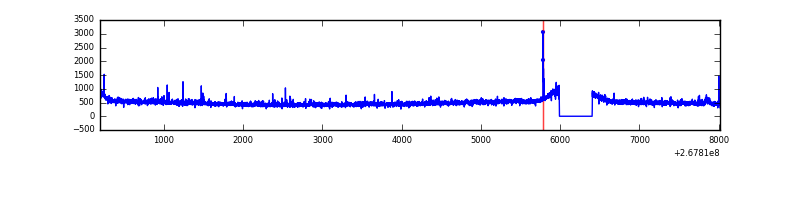 |
| B | 7828 | 7414 | 10 | 10 | 0.13% | 0.13% | 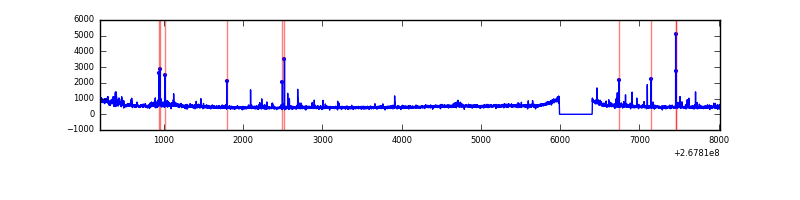 |
| C | 7828 | 7414 | 1 | 1 | 0.01% | 0.01% | 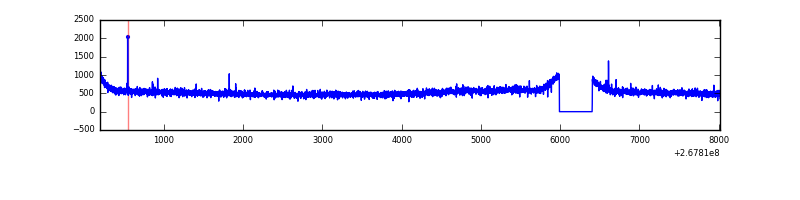 |
| D | 7828 | 7414 | 8 | 8 | 0.10% | 0.11% | 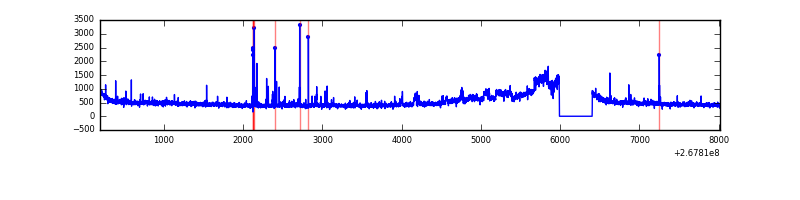 |
Top three noisy pixels from each quadrant. If the there are fewer than three noisy pixels in the level2.evt file, extra rows are filled as -1
| Pixel properties | Quadrant properties | ||||||
|---|---|---|---|---|---|---|---|
| Quadrant | DetID | PixID | Counts | Sigma | Mean | Median | Sigma |
| A | 12 | 189 | 67614 | 354.95 | 928 | 910 | 187.9 |
| A | 9 | 143 | 46747 | 243.91 | 928 | 910 | 187.9 |
| A | 0 | 226 | 8536 | 40.58 | 928 | 910 | 187.9 |
| B | 0 | 219 | 87132 | 494.44 | 912 | 891 | 174.4 |
| B | 0 | 189 | 85880 | 487.26 | 912 | 891 | 174.4 |
| B | 0 | 228 | 28444 | 157.97 | 912 | 891 | 174.4 |
| C | 3 | 233 | 460666 | 2254.49 | 883 | 889 | 203.9 |
| C | 7 | 247 | 20976 | 98.5 | 883 | 889 | 203.9 |
| C | 6 | 96 | 13530 | 61.98 | 883 | 889 | 203.9 |
| D | 15 | 0 | 473015 | 2186.09 | 890 | 866 | 216.0 |
| D | 7 | 38 | 50285 | 228.81 | 890 | 866 | 216.0 |
| D | 2 | 234 | 27908 | 125.21 | 890 | 866 | 216.0 |
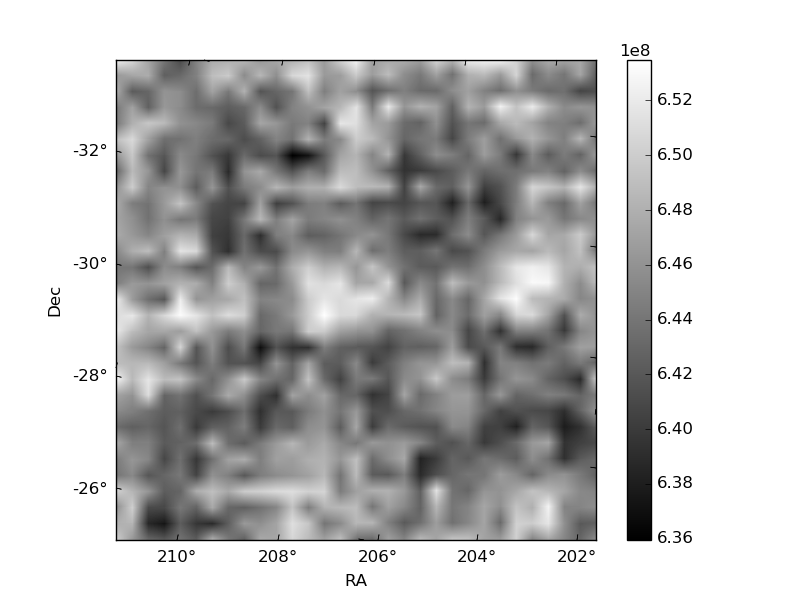
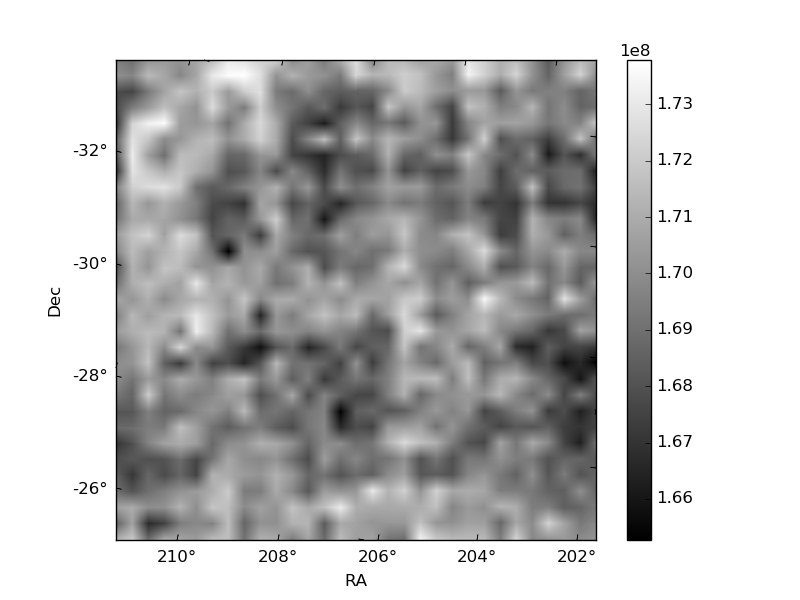
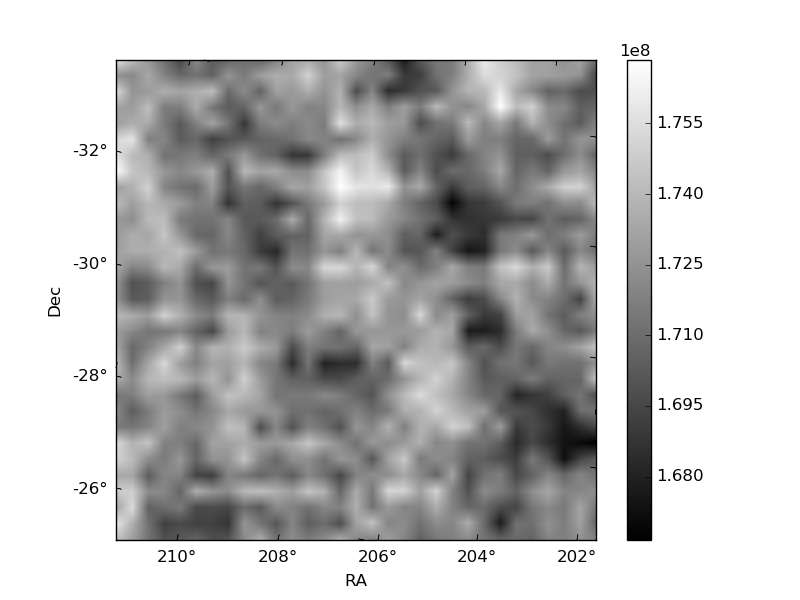
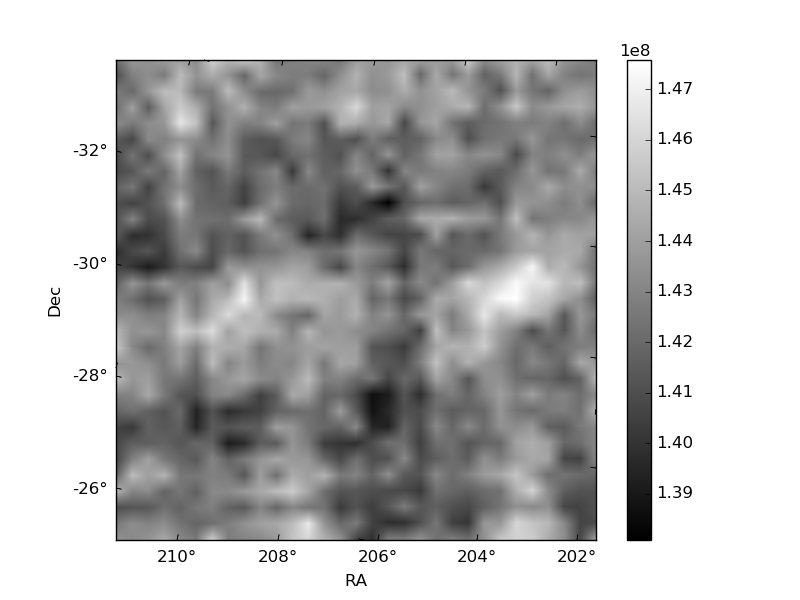
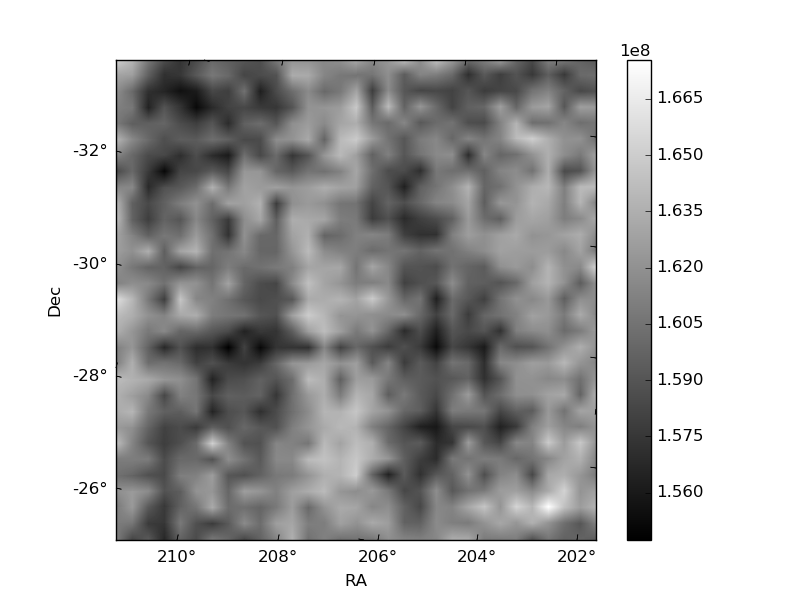
Histogram calculated using DETX and DETY for each event in the final _common_clean file
| Quadrant A | 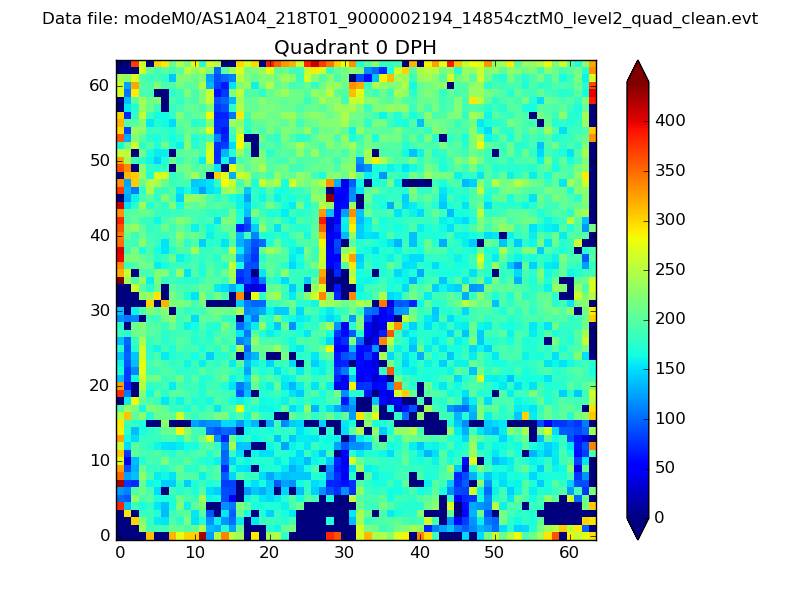 |
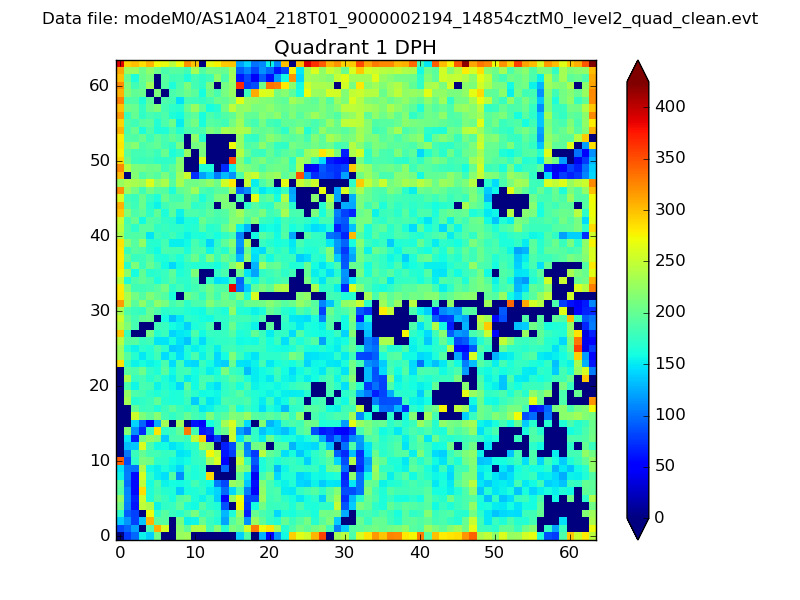 |
Quadrant B |
|---|---|---|---|
| Quadrant D | 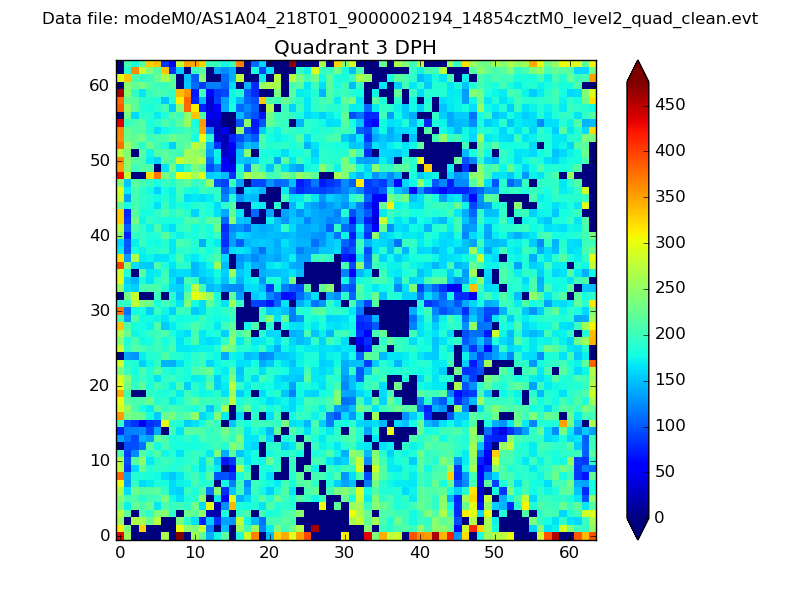 |
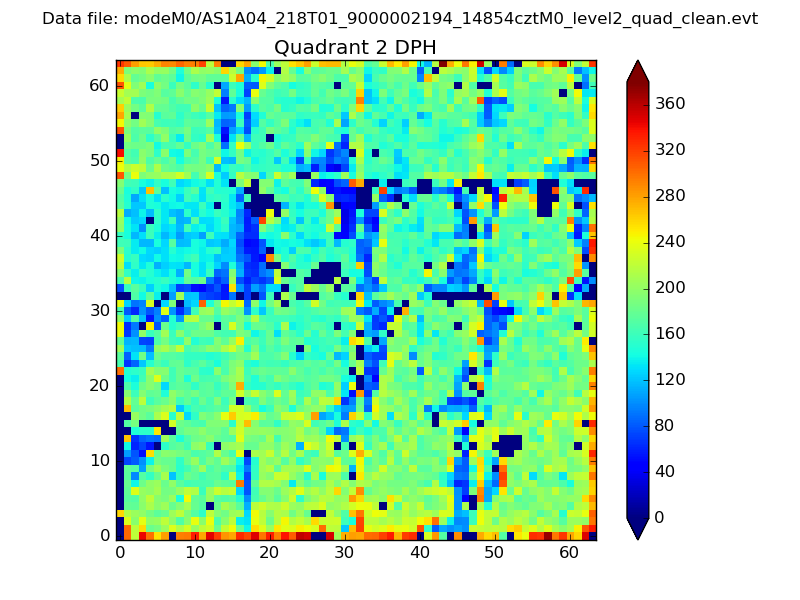 |
Quadrant C |
| Plot type | Count rate plots | Images |
|---|---|---|
| Comparison with Poisson distribution Blue bars denote a histogram of data divided into 1 sec bins. Red curve is a Poisson curve with rate = median count rate of data. |
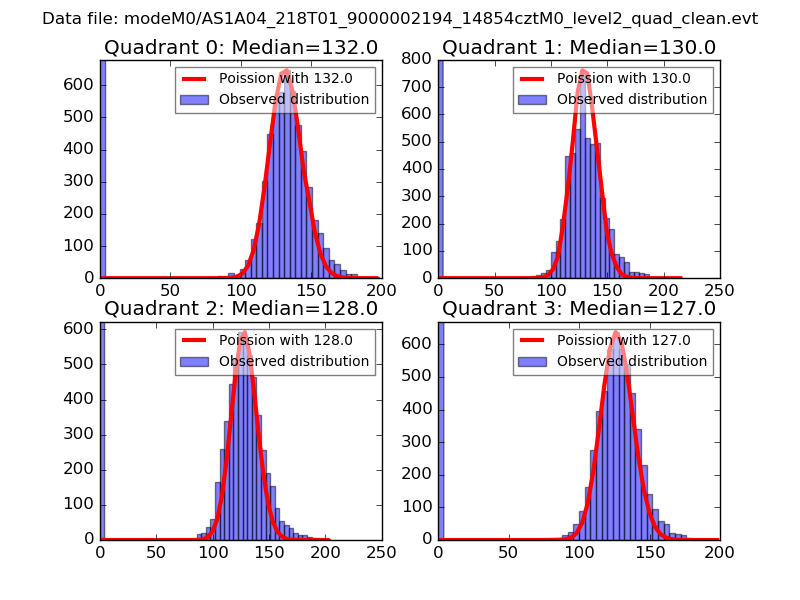 |
 |
| Quadrant-wise count rates Data is divided into 100 sec bins |
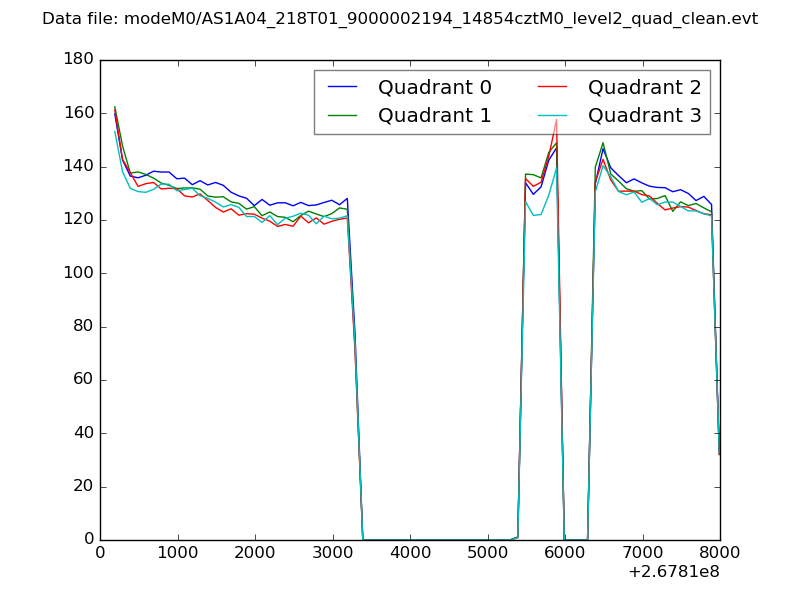 |
|
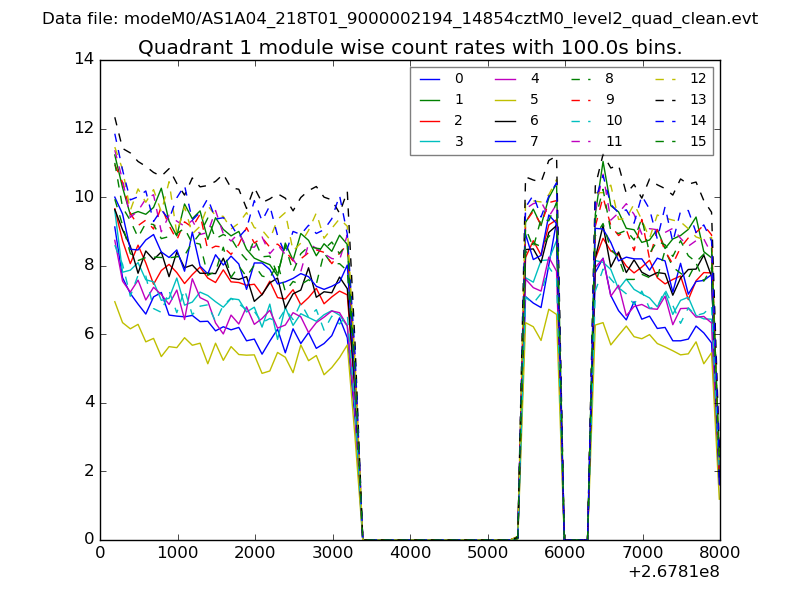
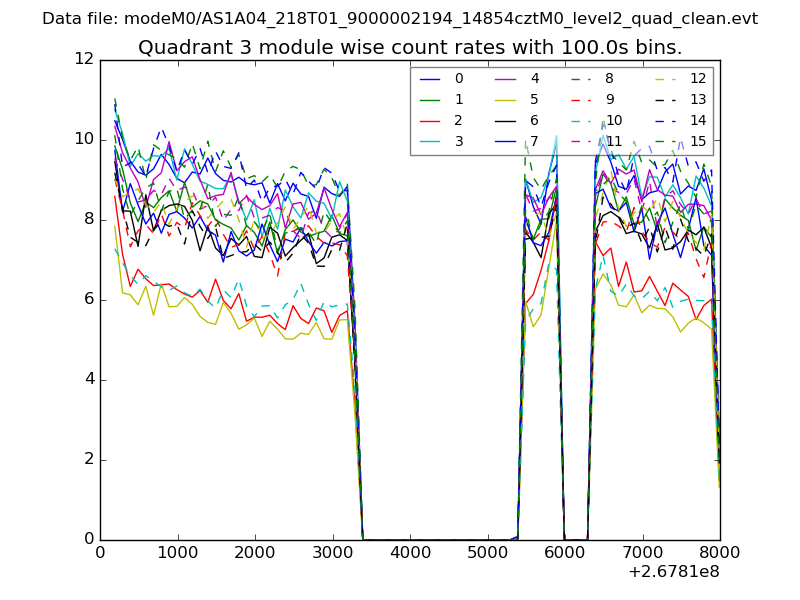
| Module-wise count rates for Quadrant A Data is divided into 100 sec bins |
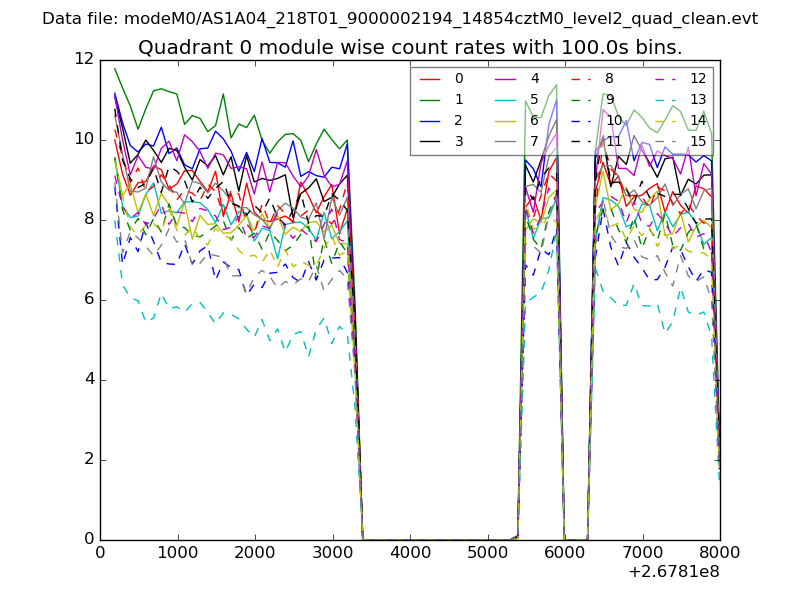 |
 |
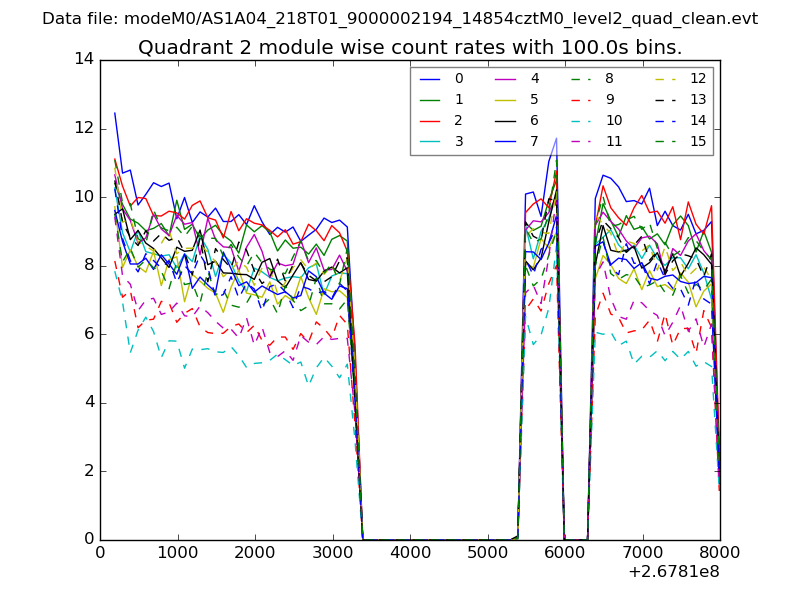
| Module-wise count rates for Quadrant B Data is divided into 100 sec bins |
 |
 |
| Module-wise count rates for Quadrant C Data is divided into 100 sec bins |
 |
 |
| Module-wise count rates for Quadrant D Data is divided into 100 sec bins |
 |
 |
| Parameter | Plot |
|---|---|
| CZT HV Monitor | 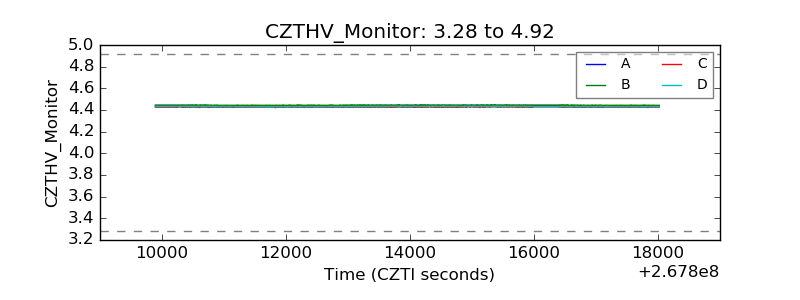 |
| D_VDD | 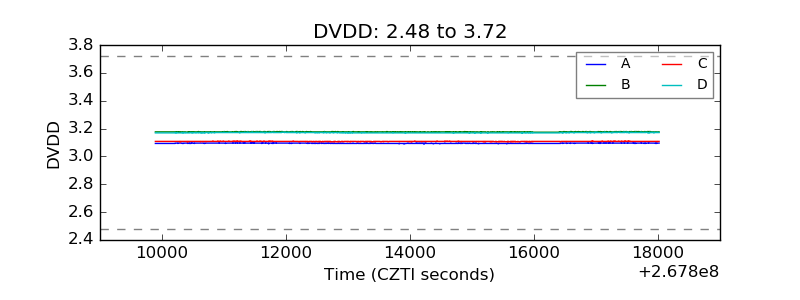 |
| Temperature 1 | 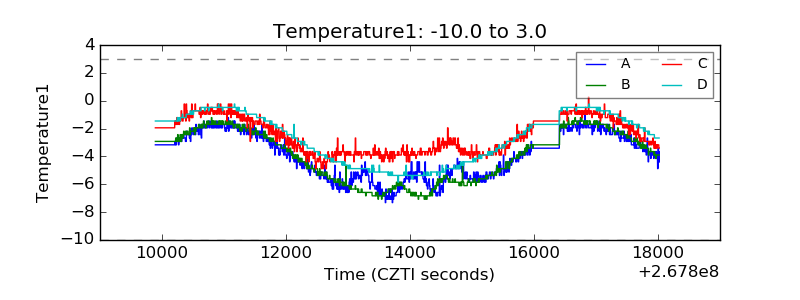 |
| Veto HV Monitor | 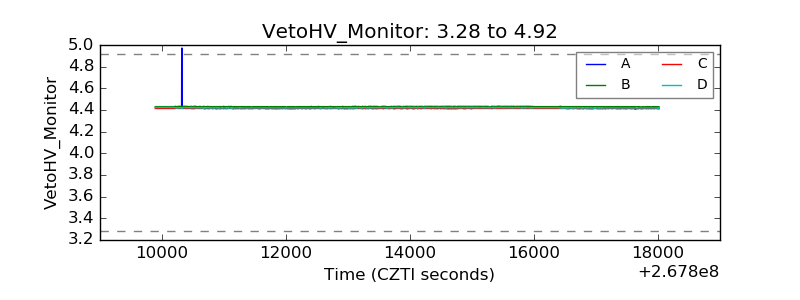 |
| Veto LLD | 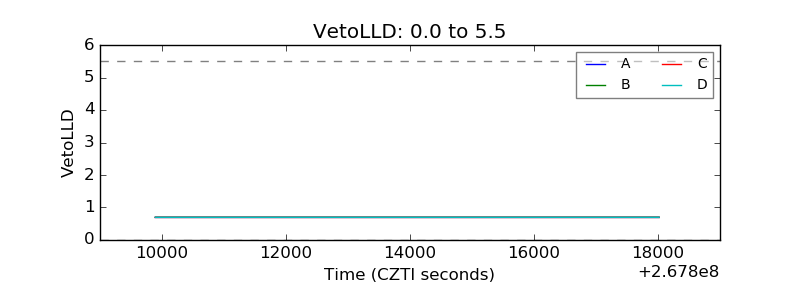 |
| Alpha Counter | 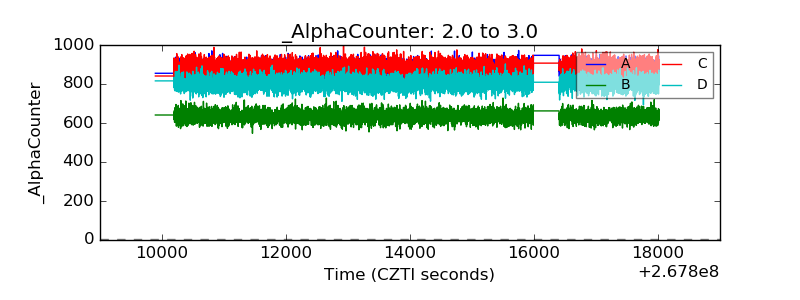 |
| _CPM_Rate | 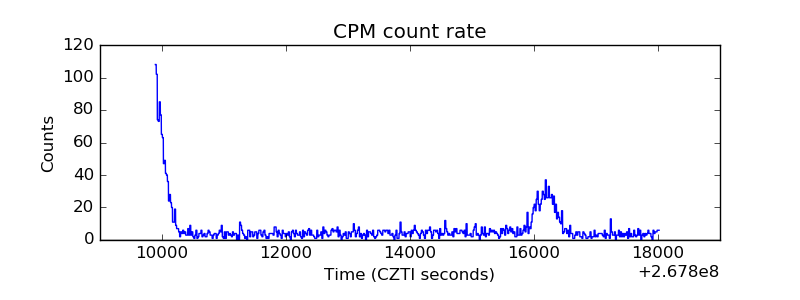 |
| CZT Counter | 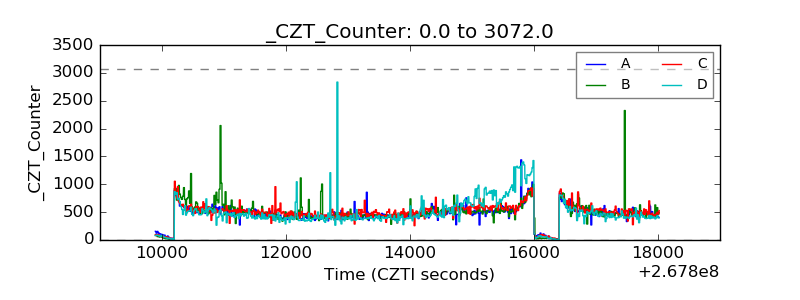 |
| +2.5 Volts monitor |  |
| +5 Volts monitor |  |
| _ROLL_ROT | 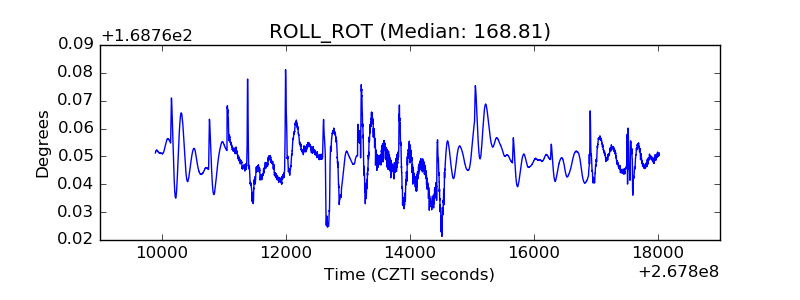 |
| _Roll_DEC | 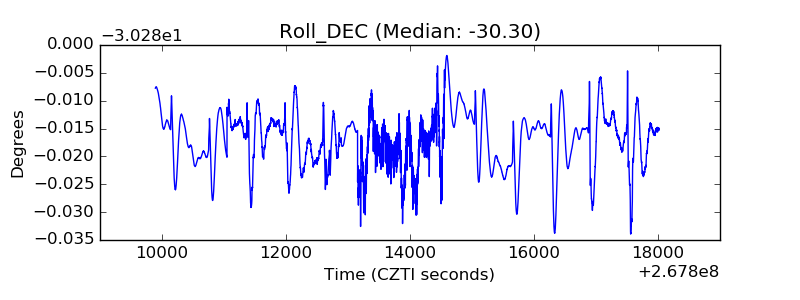 |
| _Roll_RA | 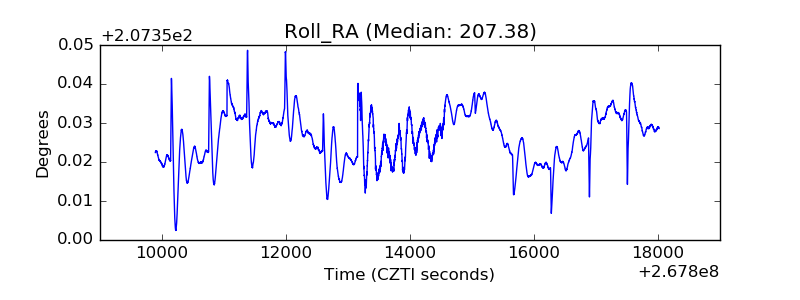 |
| Veto Counter | 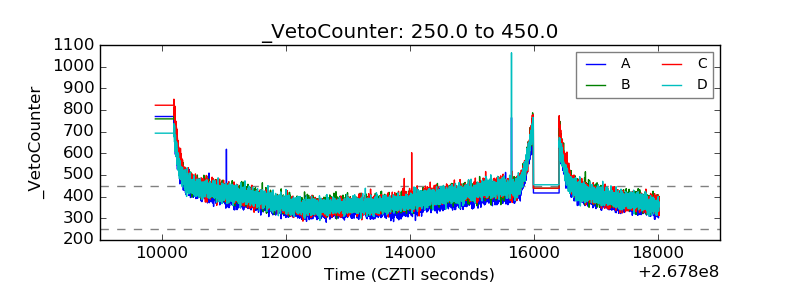 |