| Param | Original file | Final file |
|---|---|---|
| Filename | modeM0/AS1A04_218T01_9000002194_14859cztM0_level2.evt | modeM0/AS1A04_218T01_9000002194_14859cztM0_level2_quad_clean.evt |
| Size (bytes) | 720,714,240 | 90,555,840 |
| Size | 687.3 MB | 86.4 MB |
| Events in quadrant A | 3,604,275 | 603,431 |
| Events in quadrant B | 4,335,981 | 582,157 |
| Events in quadrant C | 3,737,311 | 587,650 |
| Events in quadrant D | 9,636,044 | 440,897 |
| Mode SS | |||
|---|---|---|---|
| Quadrant | BADHDUFLAG | Total packets | Discarded packets |
| A | 0 | 156 | 0 |
| B | 0 | 156 | 0 |
| C | 0 | 156 | 0 |
| D | 0 | 156 | 0 |
| Mode M0 | |||
|---|---|---|---|
| Quadrant | BADHDUFLAG | Total packets | Discarded packets |
| A | 0 | 15513 | 3 |
| B | 0 | 17665 | 2 |
| C | 0 | 15644 | 2 |
| D | 0 | 33793 | 2 |
| Mode M9 | |||
|---|---|---|---|
| Quadrant | BADHDUFLAG | Total packets | Discarded packets |
| A | 0 | 15 | 0 |
| B | 0 | 15 | 0 |
| C | 0 | 15 | 0 |
| D | 0 | 15 | 0 |
| Quadrant | Total seconds | Saturated seconds | Saturation percentage |
|---|---|---|---|
| A | 7578 | 41 | 0.541040% |
| B | 7578 | 232 | 3.061494% |
| C | 7578 | 21 | 0.277118% |
| D | 7578 | 2396 | 31.617841% |
Noise dominated data is calculated using 1-second bins in cleaned event files. If a bin has >2000 counts, and if more than 50% of those come from <1% of pixels, then it is considered to be noise-dominated and hence unusable.
| Quadrant | # 1 sec bins | Bins with >0 counts | Bins with >2000 counts | High rate bins dominated by noise | Noise dominated (total time) | Noise dominated (detector-on time) | Marked lightcurve |
|---|---|---|---|---|---|---|---|
| A | 9119 | 7581 | 0 | 0 | 0.00% | 0.00% | 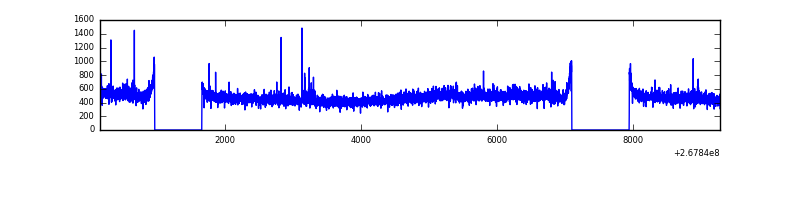 |
| B | 9119 | 7581 | 114 | 114 | 1.25% | 1.50% | 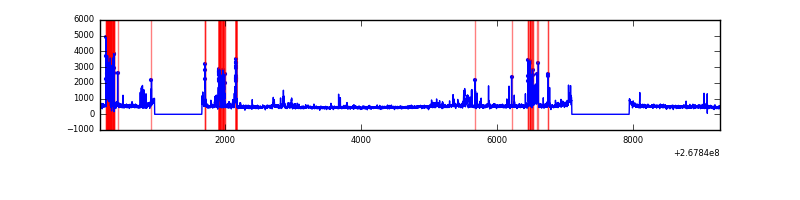 |
| C | 9119 | 7581 | 1 | 1 | 0.01% | 0.01% |  |
| D | 9119 | 7581 | 2098 | 2098 | 23.01% | 27.67% |  |
Top three noisy pixels from each quadrant. If the there are fewer than three noisy pixels in the level2.evt file, extra rows are filled as -1
| Pixel properties | Quadrant properties | ||||||
|---|---|---|---|---|---|---|---|
| Quadrant | DetID | PixID | Counts | Sigma | Mean | Median | Sigma |
| A | 12 | 189 | 62002 | 329.98 | 912 | 891 | 185.2 |
| A | 9 | 143 | 26213 | 136.73 | 912 | 891 | 185.2 |
| A | 15 | 239 | 8637 | 41.83 | 912 | 891 | 185.2 |
| B | 3 | 64 | 456737 | 2630.55 | 897 | 873 | 173.3 |
| B | 0 | 229 | 141639 | 812.29 | 897 | 873 | 173.3 |
| B | 0 | 189 | 98214 | 561.7 | 897 | 873 | 173.3 |
| C | 3 | 233 | 279773 | 1382.28 | 874 | 878 | 201.8 |
| C | 6 | 96 | 49206 | 239.53 | 874 | 878 | 201.8 |
| C | 13 | 61 | 6224 | 26.5 | 874 | 878 | 201.8 |
| D | 13 | 104 | 4406074 | 24336.74 | 729 | 708 | 181.0 |
| D | 7 | 254 | 1478608 | 8164.42 | 729 | 708 | 181.0 |
| D | 15 | 0 | 893006 | 4929.36 | 729 | 708 | 181.0 |
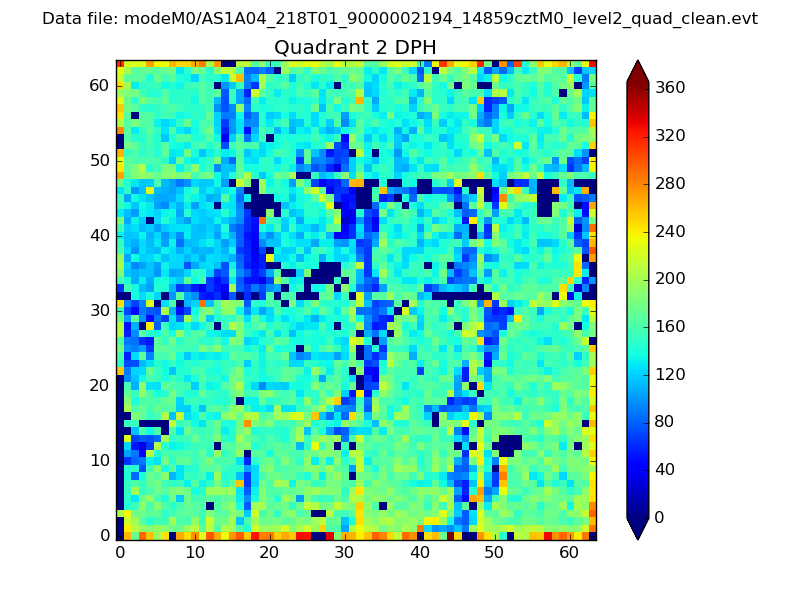
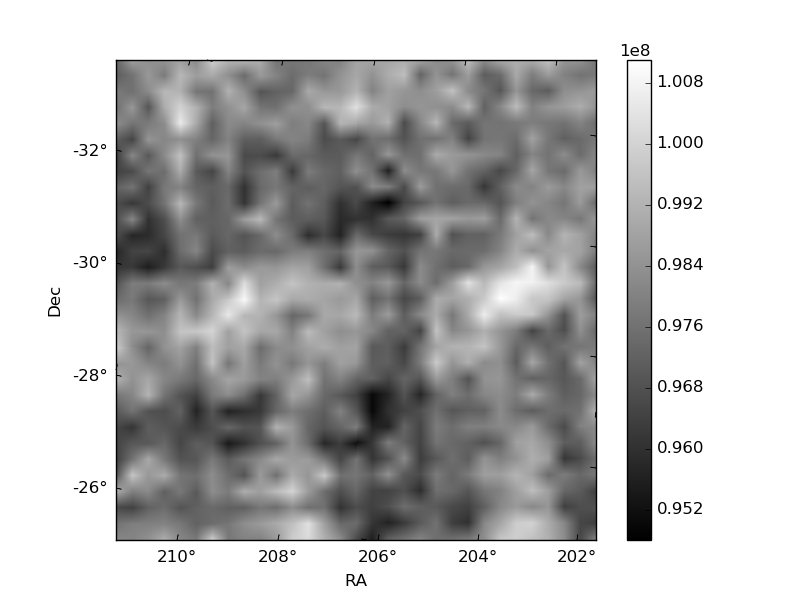
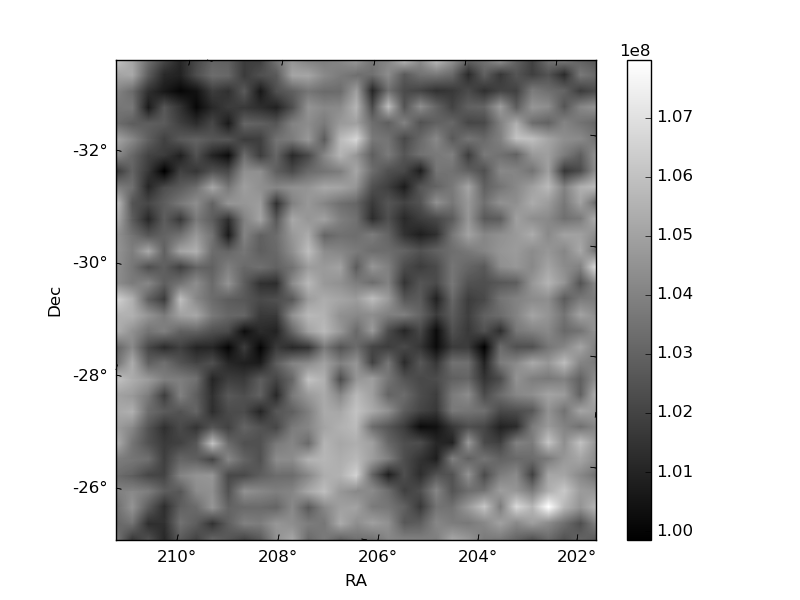
Histogram calculated using DETX and DETY for each event in the final _common_clean file
| Quadrant A |  |
 |
Quadrant B |
|---|---|---|---|
| Quadrant D |  |
 |
Quadrant C |
| Plot type | Count rate plots | Images |
|---|---|---|
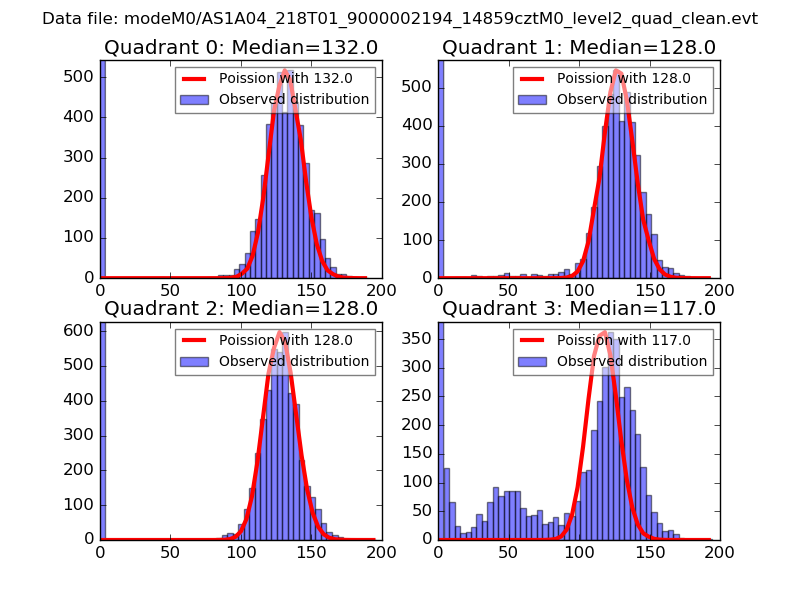
| Comparison with Poisson distribution Blue bars denote a histogram of data divided into 1 sec bins. Red curve is a Poisson curve with rate = median count rate of data. |
 |
 |
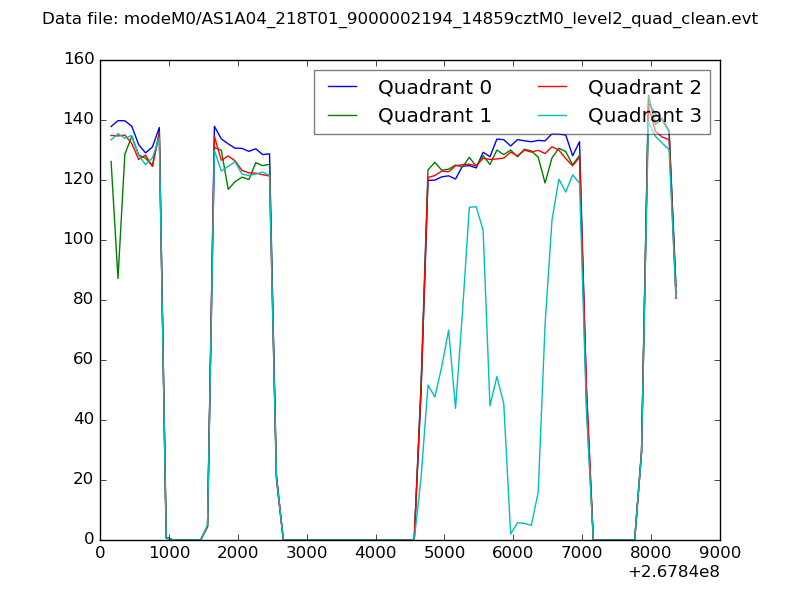
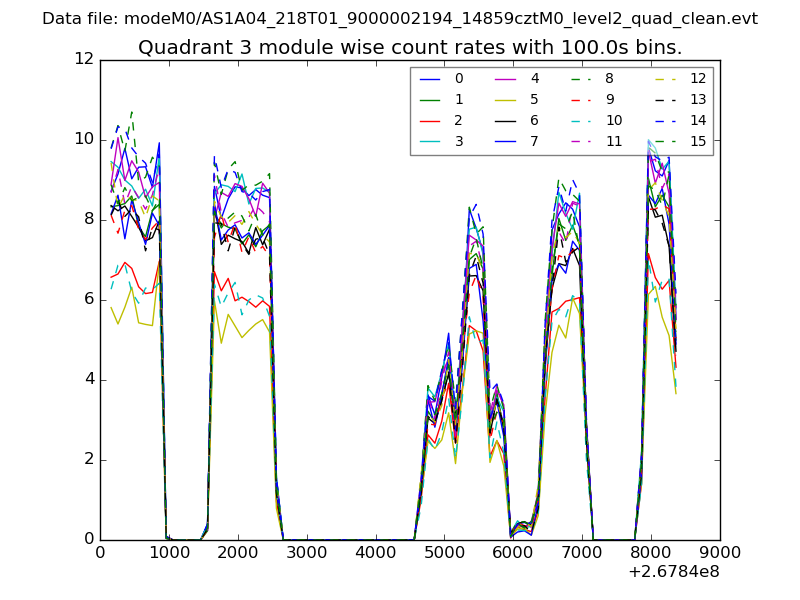
| Quadrant-wise count rates Data is divided into 100 sec bins |
 |
|
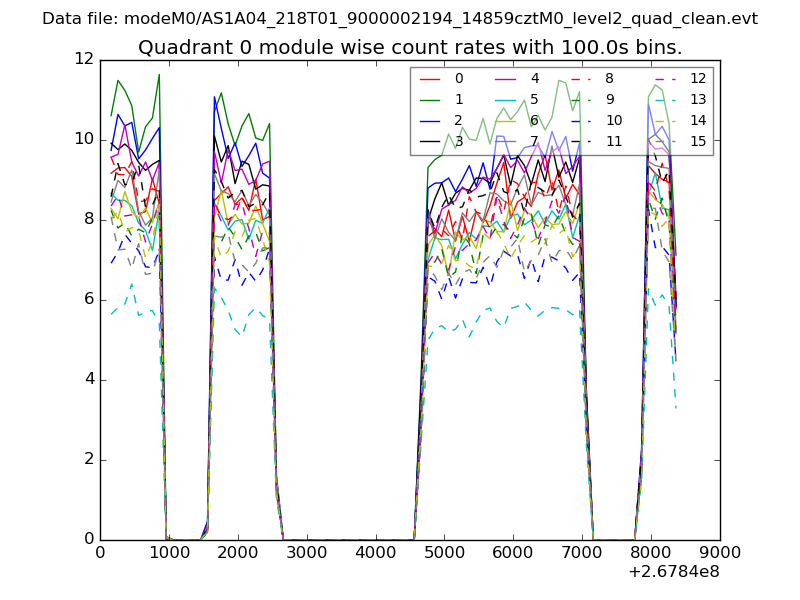
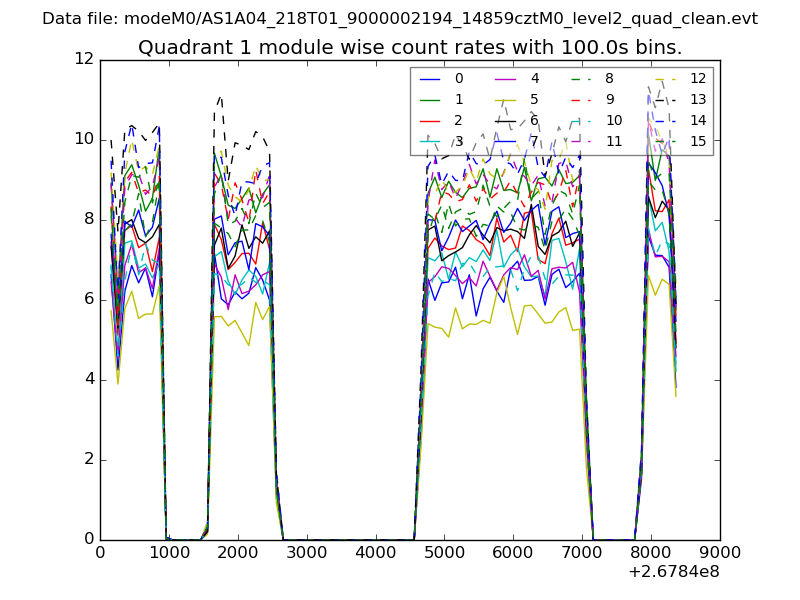
| Module-wise count rates for Quadrant A Data is divided into 100 sec bins |
 |
 |
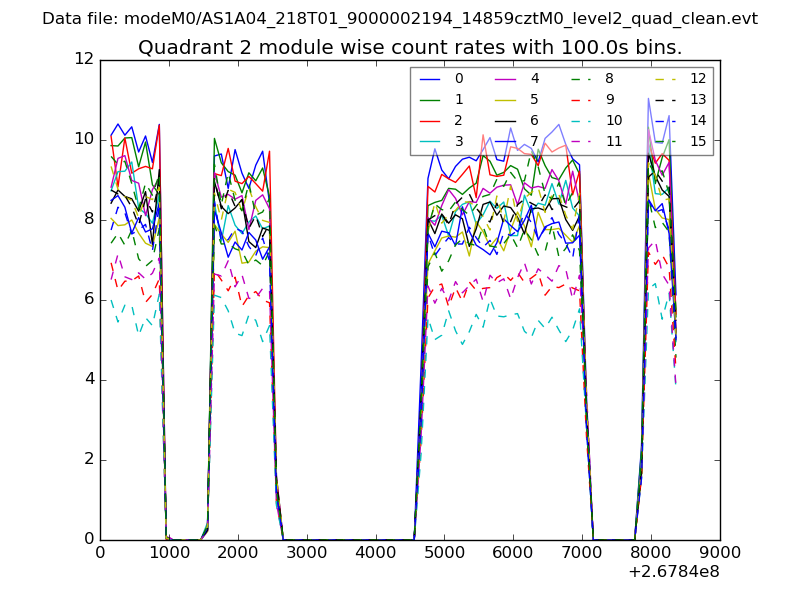
| Module-wise count rates for Quadrant B Data is divided into 100 sec bins |
 |
 |
| Module-wise count rates for Quadrant C Data is divided into 100 sec bins |
 |
 |
| Module-wise count rates for Quadrant D Data is divided into 100 sec bins |
 |
 |
| Parameter | Plot |
|---|---|
| CZT HV Monitor |  |
| D_VDD | 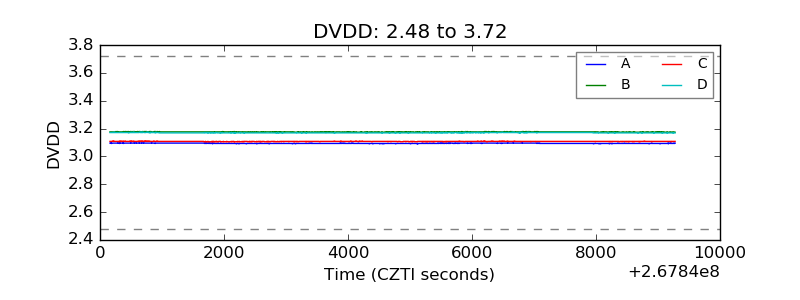 |
| Temperature 1 | 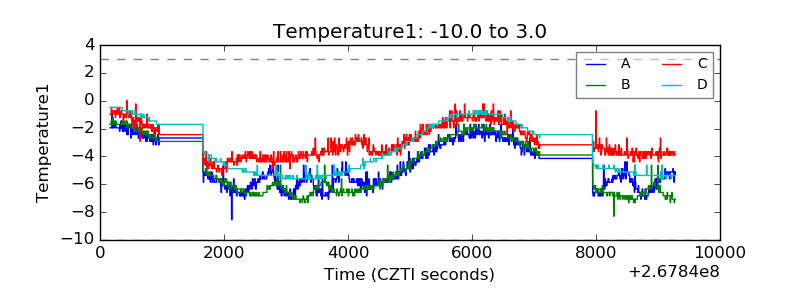 |
| Veto HV Monitor | 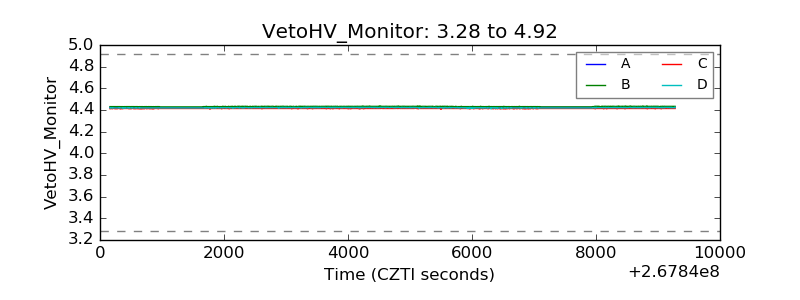 |
| Veto LLD | 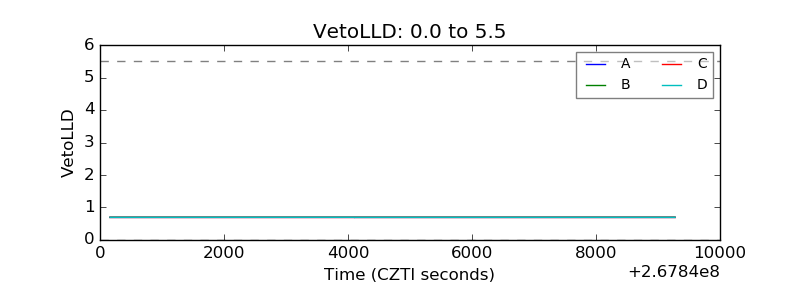 |
| Alpha Counter | 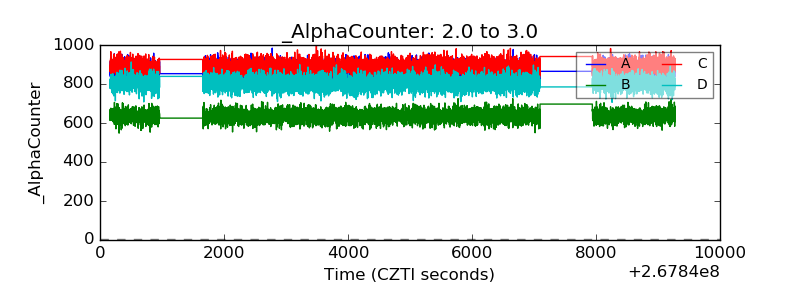 |
| _CPM_Rate | 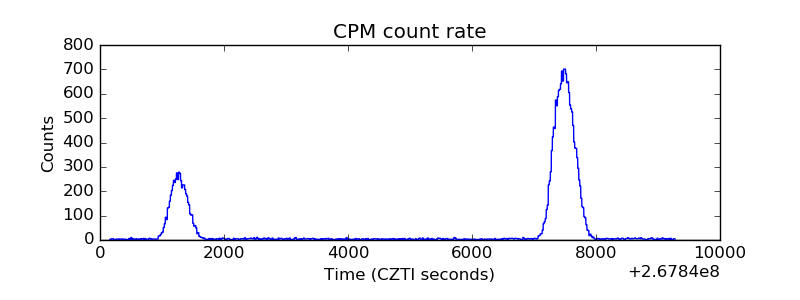 |
| CZT Counter | 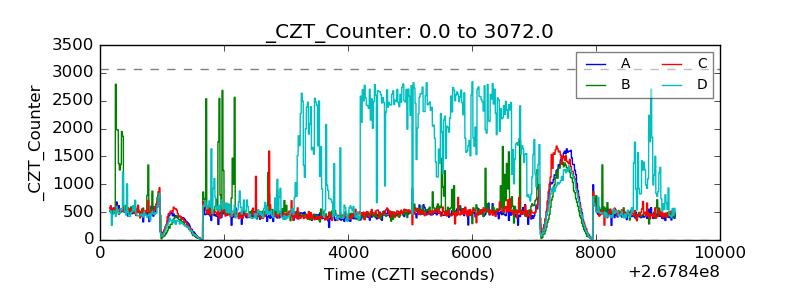 |
| +2.5 Volts monitor |  |
| +5 Volts monitor | 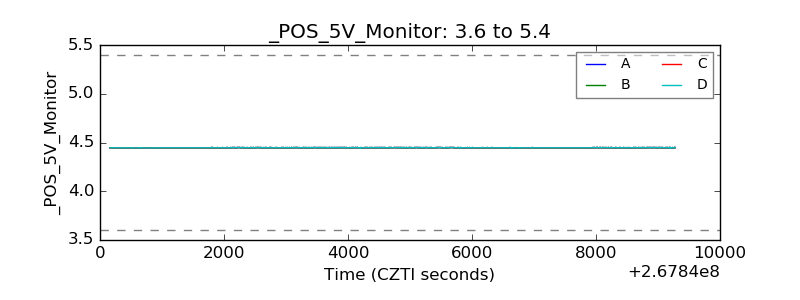 |
| _ROLL_ROT | 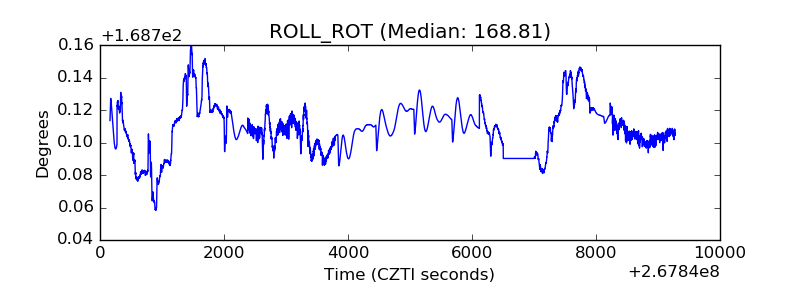 |
| _Roll_DEC | 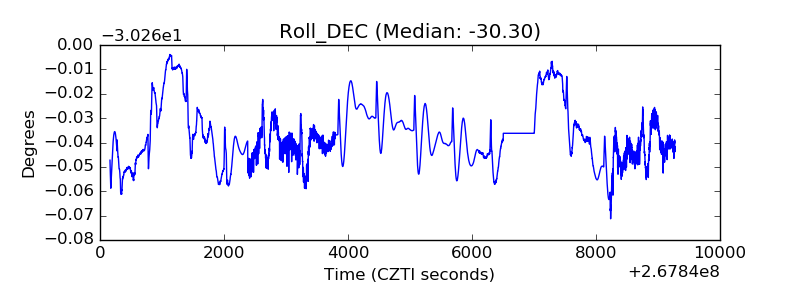 |
| _Roll_RA | 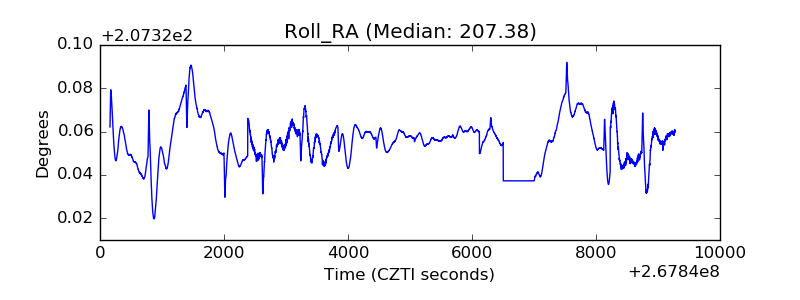 |
| Veto Counter | 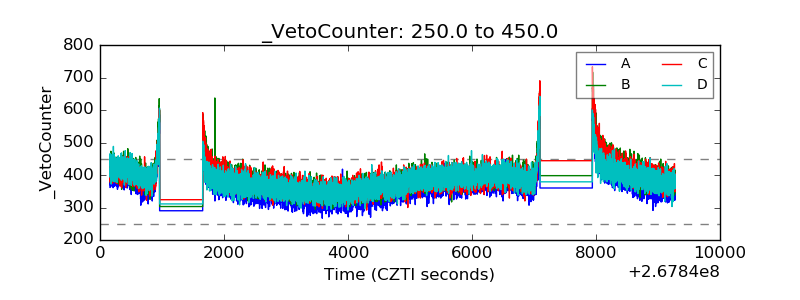 |