| Param | Original file | Final file |
|---|---|---|
| Filename | modeM0/AS1A04_218T01_9000002194_14860cztM0_level2.evt | modeM0/AS1A04_218T01_9000002194_14860cztM0_level2_quad_clean.evt |
| Size (bytes) | 595,293,120 | 69,511,680 |
| Size | 567.7 MB | 66.3 MB |
| Events in quadrant A | 3,317,567 | 425,104 |
| Events in quadrant B | 3,658,492 | 419,399 |
| Events in quadrant C | 3,381,535 | 417,012 |
| Events in quadrant D | 7,202,550 | 361,545 |
| Mode SS | |||
|---|---|---|---|
| Quadrant | BADHDUFLAG | Total packets | Discarded packets |
| A | 0 | 142 | 0 |
| B | 0 | 142 | 0 |
| C | 0 | 142 | 0 |
| D | 0 | 142 | 0 |
| Mode M0 | |||
|---|---|---|---|
| Quadrant | BADHDUFLAG | Total packets | Discarded packets |
| A | 0 | 14292 | 3 |
| B | 0 | 15125 | 2 |
| C | 0 | 14185 | 2 |
| D | 0 | 25952 | 2 |
| Mode M9 | |||
|---|---|---|---|
| Quadrant | BADHDUFLAG | Total packets | Discarded packets |
| A | 0 | 18 | 0 |
| B | 0 | 18 | 0 |
| C | 0 | 18 | 0 |
| D | 0 | 18 | 0 |
| Quadrant | Total seconds | Saturated seconds | Saturation percentage |
|---|---|---|---|
| A | 6908 | 39 | 0.564563% |
| B | 6908 | 63 | 0.911986% |
| C | 6908 | 29 | 0.419803% |
| D | 6908 | 1388 | 20.092646% |
Noise dominated data is calculated using 1-second bins in cleaned event files. If a bin has >2000 counts, and if more than 50% of those come from <1% of pixels, then it is considered to be noise-dominated and hence unusable.
| Quadrant | # 1 sec bins | Bins with >0 counts | Bins with >2000 counts | High rate bins dominated by noise | Noise dominated (total time) | Noise dominated (detector-on time) | Marked lightcurve |
|---|---|---|---|---|---|---|---|
| A | 8779 | 6911 | 0 | 0 | 0.00% | 0.00% | 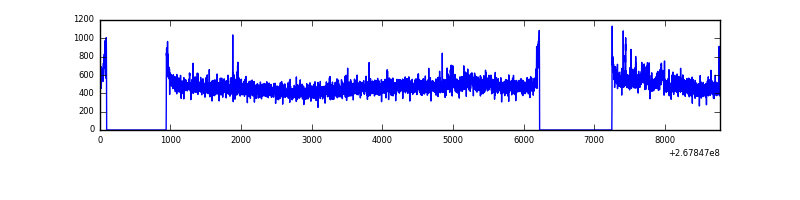 |
| B | 8779 | 6911 | 5 | 5 | 0.06% | 0.07% | 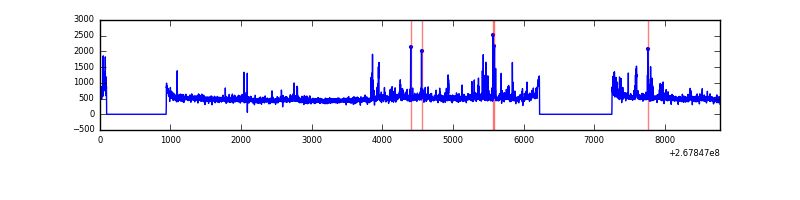 |
| C | 8779 | 6911 | 1 | 1 | 0.01% | 0.01% | 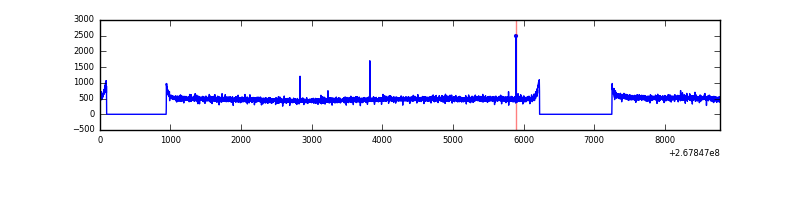 |
| D | 8779 | 6911 | 1278 | 1278 | 14.56% | 18.49% | 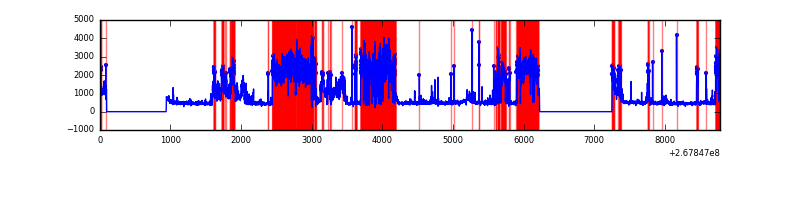 |
Top three noisy pixels from each quadrant. If the there are fewer than three noisy pixels in the level2.evt file, extra rows are filled as -1
| Pixel properties | Quadrant properties | ||||||
|---|---|---|---|---|---|---|---|
| Quadrant | DetID | PixID | Counts | Sigma | Mean | Median | Sigma |
| A | 12 | 189 | 74628 | 434.5 | 841 | 824 | 169.9 |
| A | 9 | 143 | 7536 | 39.51 | 841 | 824 | 169.9 |
| A | 0 | 226 | 7468 | 39.11 | 841 | 824 | 169.9 |
| B | 0 | 189 | 96982 | 600.57 | 838 | 817 | 160.1 |
| B | 0 | 219 | 86894 | 537.57 | 838 | 817 | 160.1 |
| B | 3 | 64 | 72591 | 448.24 | 838 | 817 | 160.1 |
| C | 3 | 233 | 213151 | 1136.16 | 809 | 814 | 186.9 |
| C | 14 | 234 | 6813 | 32.1 | 809 | 814 | 186.9 |
| C | 13 | 61 | 5790 | 26.63 | 809 | 814 | 186.9 |
| D | 13 | 104 | 3595597 | 18003.53 | 749 | 731 | 199.7 |
| D | 7 | 254 | 311859 | 1558.17 | 749 | 731 | 199.7 |
| D | 15 | 0 | 288971 | 1443.54 | 749 | 731 | 199.7 |
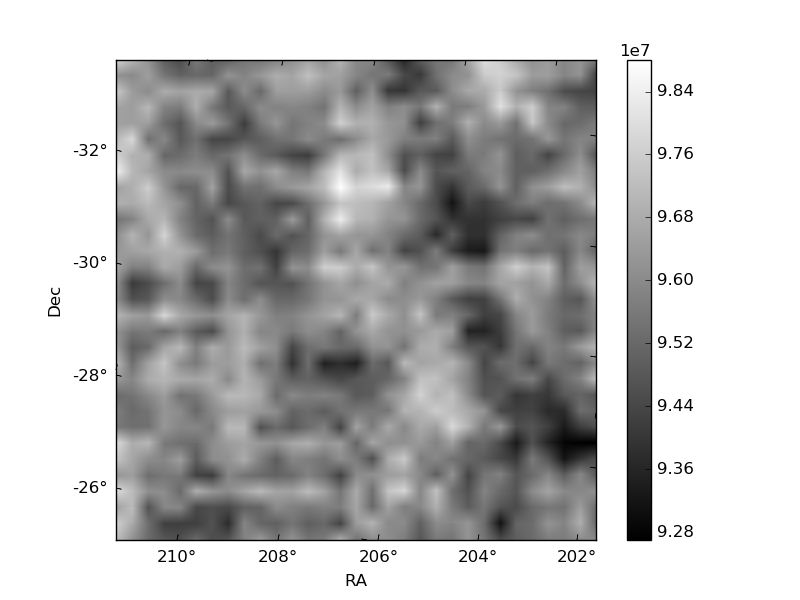
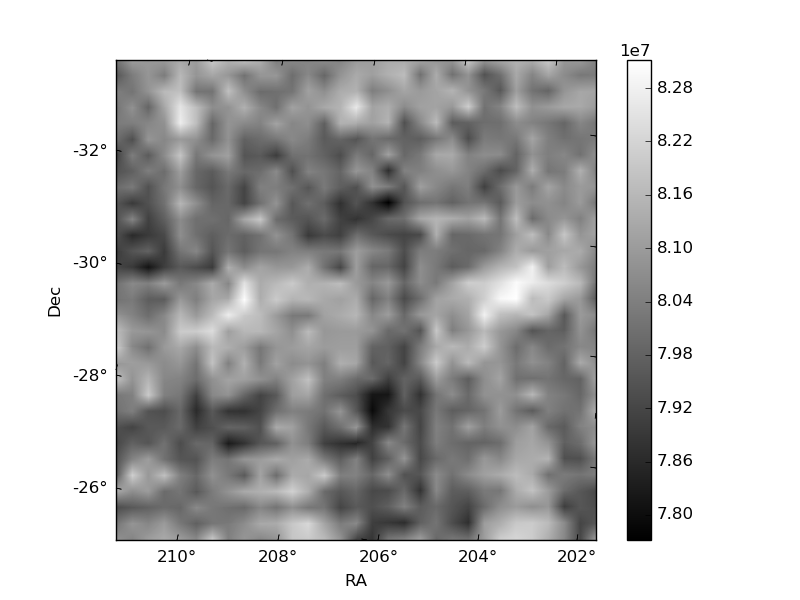
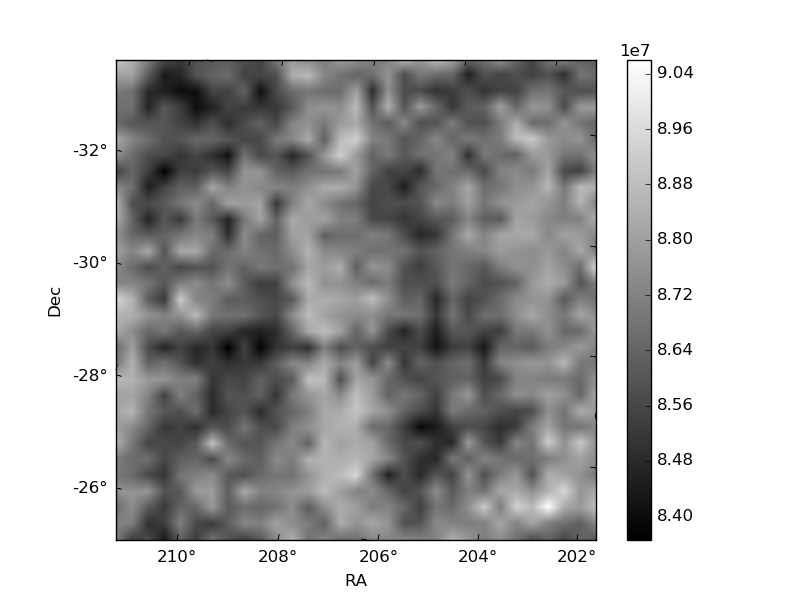
Histogram calculated using DETX and DETY for each event in the final _common_clean file
| Quadrant A | 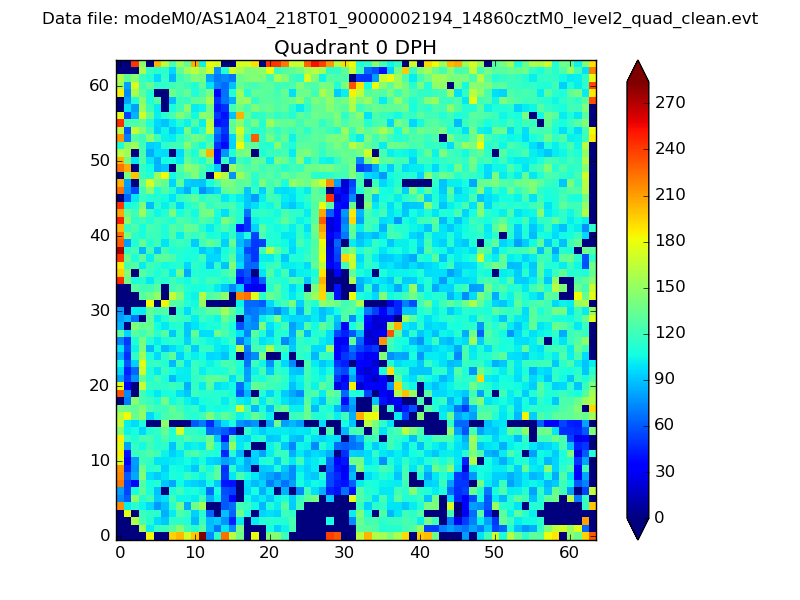 |
 |
Quadrant B |
|---|---|---|---|
| Quadrant D | 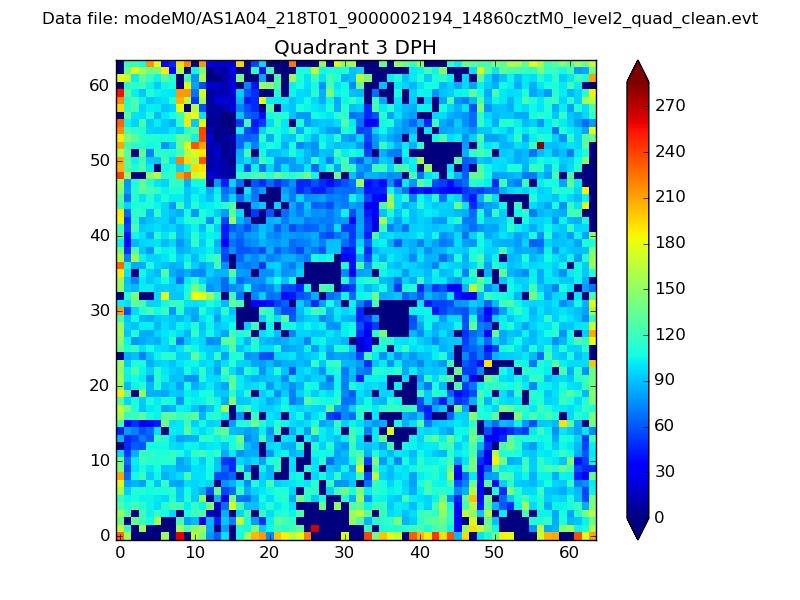 |
 |
Quadrant C |
| Plot type | Count rate plots | Images |
|---|---|---|
| Comparison with Poisson distribution Blue bars denote a histogram of data divided into 1 sec bins. Red curve is a Poisson curve with rate = median count rate of data. |
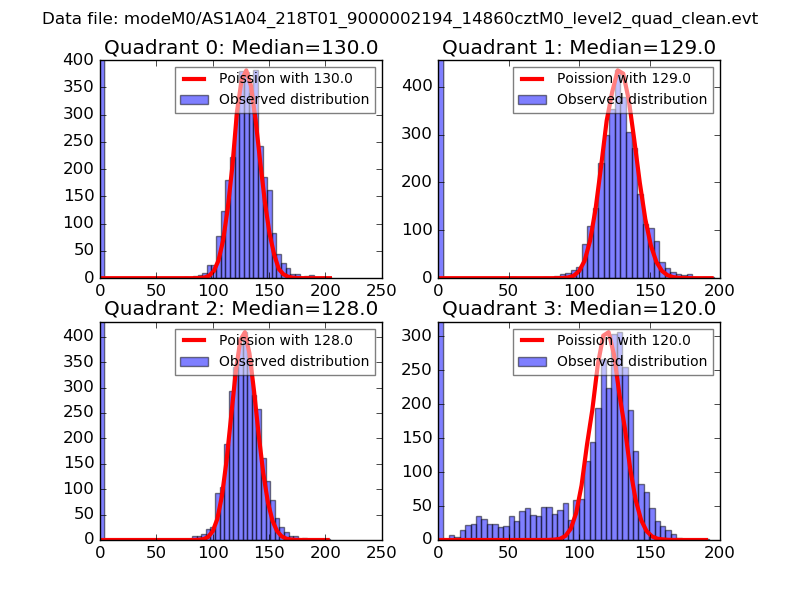 |
 |
| Quadrant-wise count rates Data is divided into 100 sec bins |
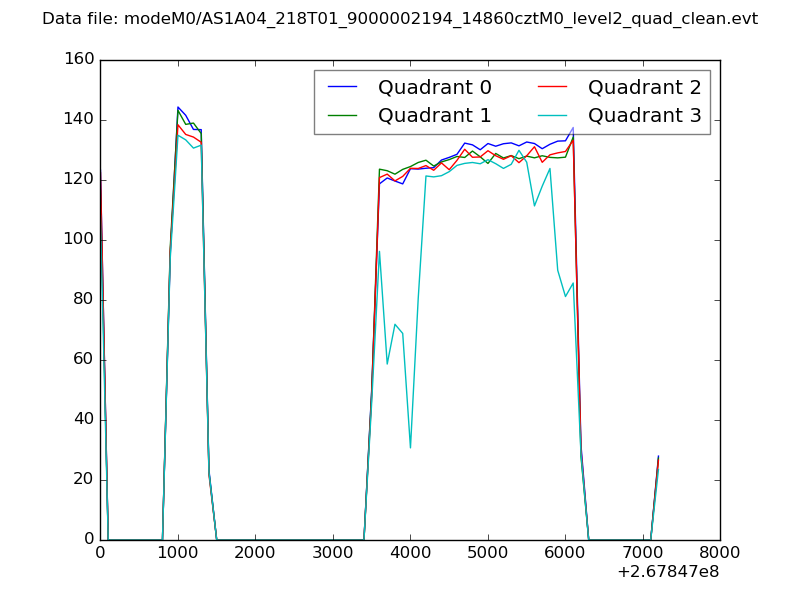 |
|
| Module-wise count rates for Quadrant A Data is divided into 100 sec bins |
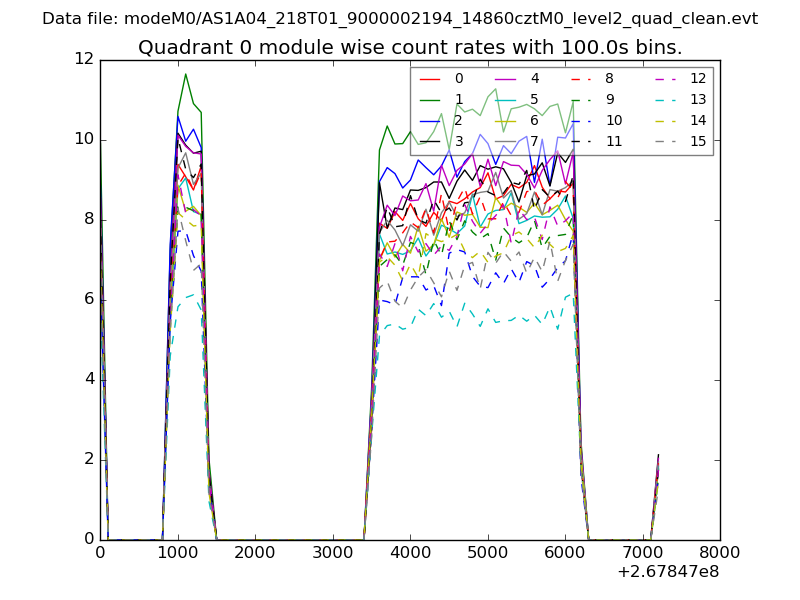 |
 |
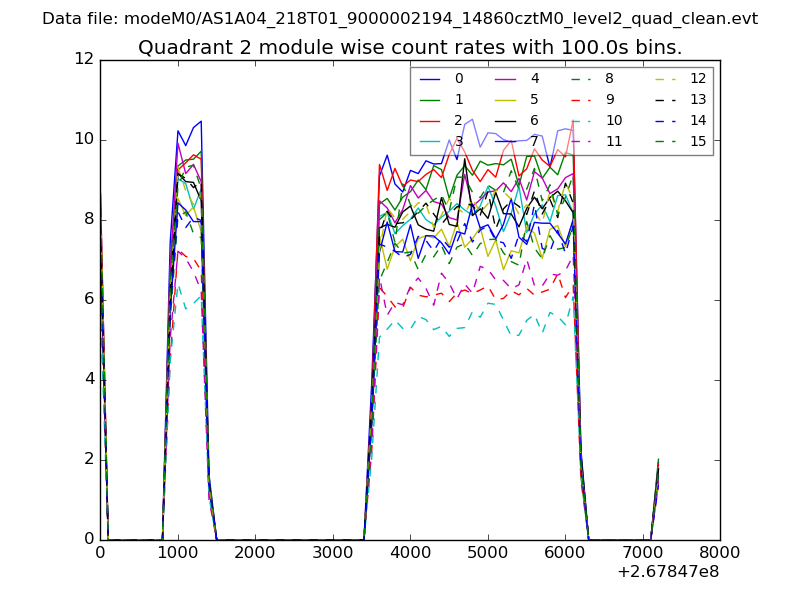
| Module-wise count rates for Quadrant B Data is divided into 100 sec bins |
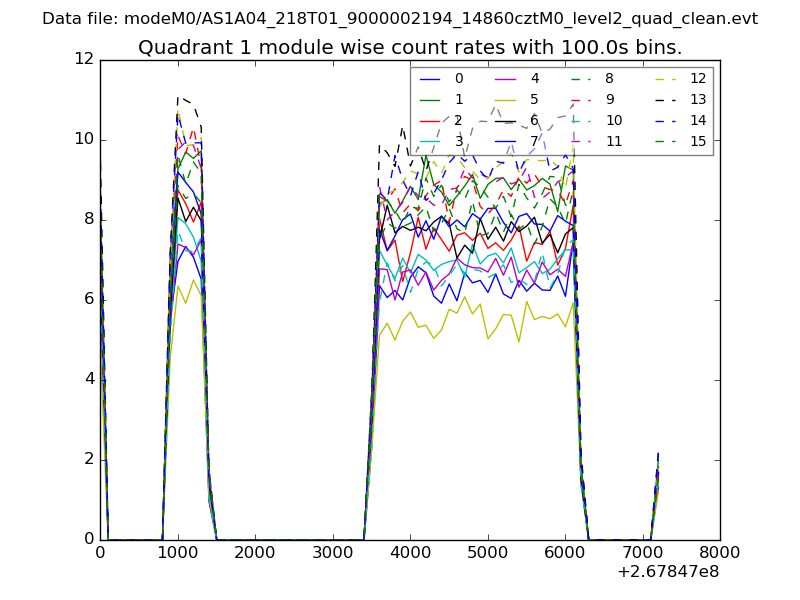 |
 |
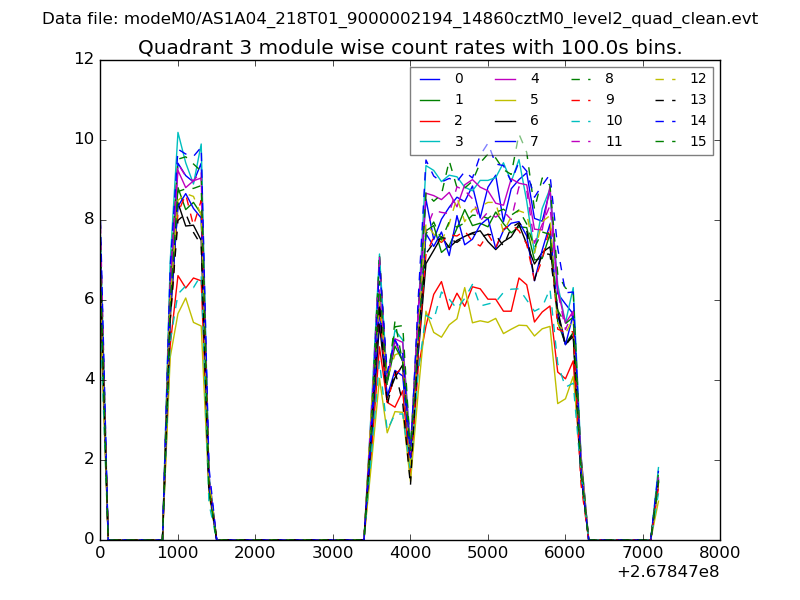
| Module-wise count rates for Quadrant C Data is divided into 100 sec bins |
 |
 |
| Module-wise count rates for Quadrant D Data is divided into 100 sec bins |
 |
 |
| Parameter | Plot |
|---|---|
| CZT HV Monitor | 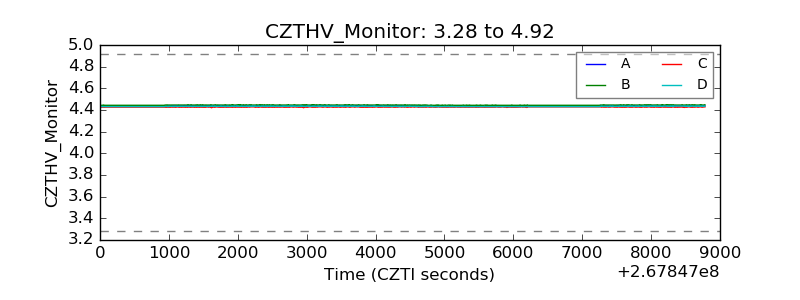 |
| D_VDD | 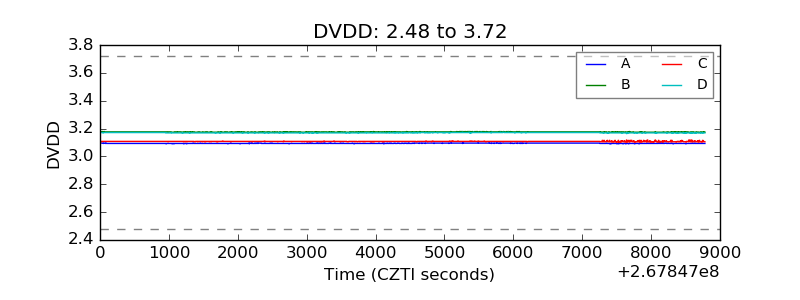 |
| Temperature 1 | 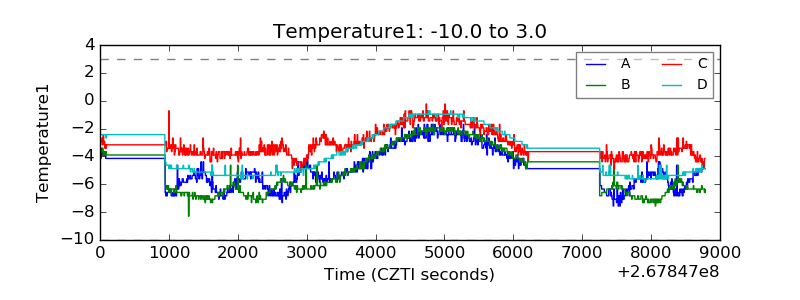 |
| Veto HV Monitor | 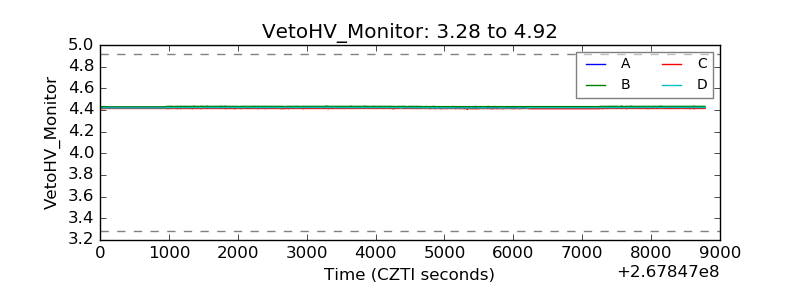 |
| Veto LLD | 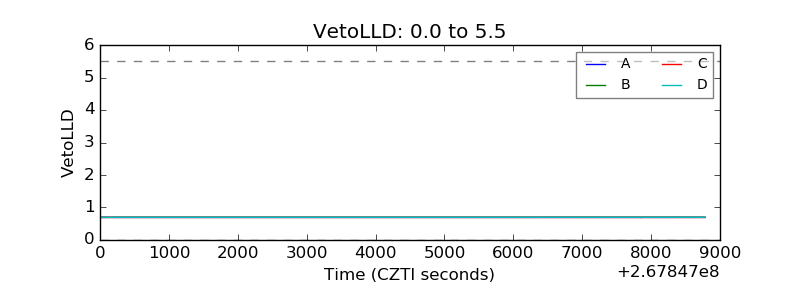 |
| Alpha Counter | 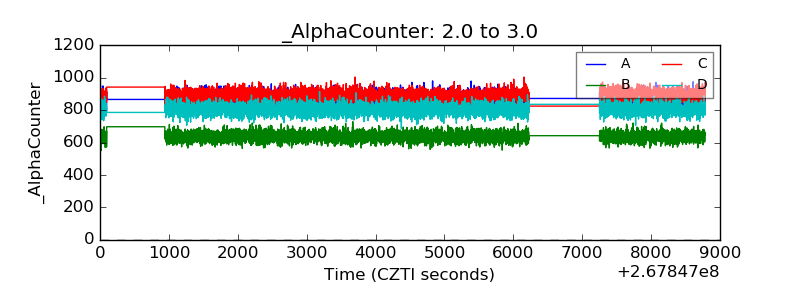 |
| _CPM_Rate | 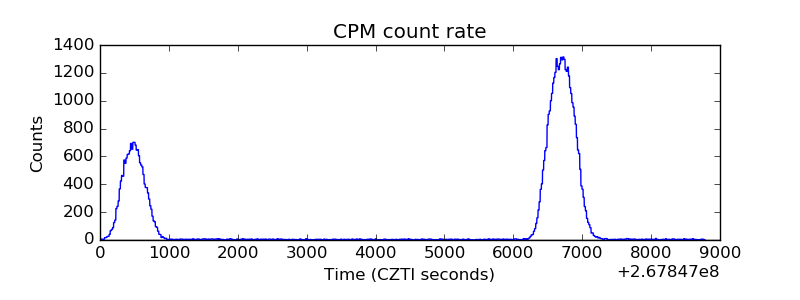 |
| CZT Counter |  |
| +2.5 Volts monitor |  |
| +5 Volts monitor |  |
| _ROLL_ROT | 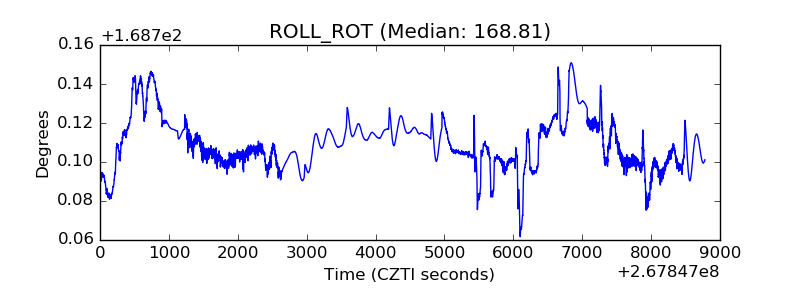 |
| _Roll_DEC | 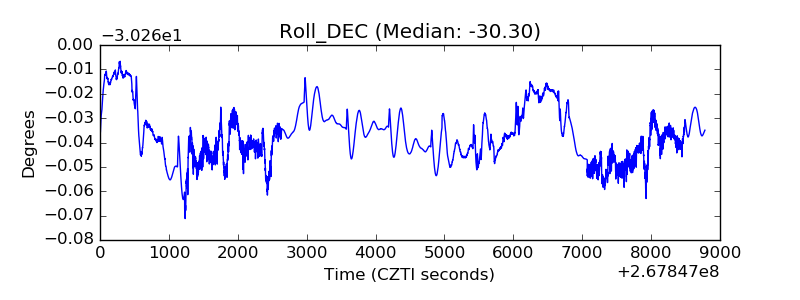 |
| _Roll_RA | 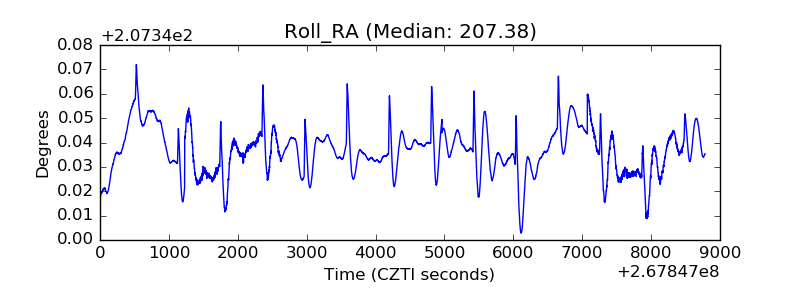 |
| Veto Counter | 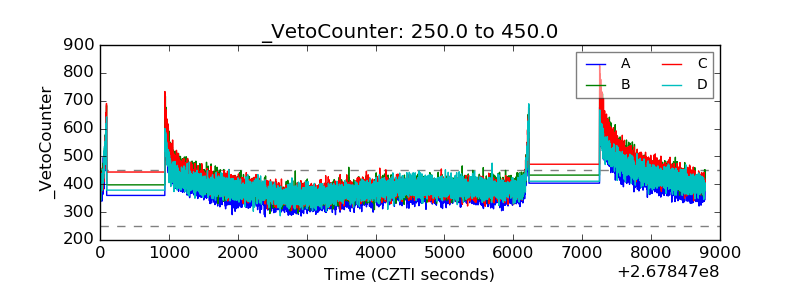 |