| Param | Original file | Final file |
|---|---|---|
| Filename | modeM0/AS1A04_218T01_9000002194_14861cztM0_level2.evt | modeM0/AS1A04_218T01_9000002194_14861cztM0_level2_quad_clean.evt |
| Size (bytes) | 529,539,840 | 64,391,040 |
| Size | 505.0 MB | 61.4 MB |
| Events in quadrant A | 3,259,881 | 388,104 |
| Events in quadrant B | 3,555,439 | 384,677 |
| Events in quadrant C | 3,330,102 | 381,196 |
| Events in quadrant D | 5,452,537 | 343,817 |
| Mode SS | |||
|---|---|---|---|
| Quadrant | BADHDUFLAG | Total packets | Discarded packets |
| A | 0 | 130 | 0 |
| B | 0 | 130 | 0 |
| C | 0 | 130 | 0 |
| D | 0 | 130 | 0 |
| Mode M0 | |||
|---|---|---|---|
| Quadrant | BADHDUFLAG | Total packets | Discarded packets |
| A | 0 | 13632 | 2 |
| B | 0 | 14559 | 1 |
| C | 0 | 13500 | 1 |
| D | 0 | 20397 | 1 |
| Mode M9 | |||
|---|---|---|---|
| Quadrant | BADHDUFLAG | Total packets | Discarded packets |
| A | 0 | 11 | 0 |
| B | 0 | 11 | 0 |
| C | 0 | 11 | 0 |
| D | 0 | 11 | 0 |
| Quadrant | Total seconds | Saturated seconds | Saturation percentage |
|---|---|---|---|
| A | 6471 | 59 | 0.911760% |
| B | 6471 | 66 | 1.019935% |
| C | 6471 | 42 | 0.649050% |
| D | 6471 | 938 | 14.495441% |
Noise dominated data is calculated using 1-second bins in cleaned event files. If a bin has >2000 counts, and if more than 50% of those come from <1% of pixels, then it is considered to be noise-dominated and hence unusable.
| Quadrant | # 1 sec bins | Bins with >0 counts | Bins with >2000 counts | High rate bins dominated by noise | Noise dominated (total time) | Noise dominated (detector-on time) | Marked lightcurve |
|---|---|---|---|---|---|---|---|
| A | 7592 | 6473 | 2 | 2 | 0.03% | 0.03% | 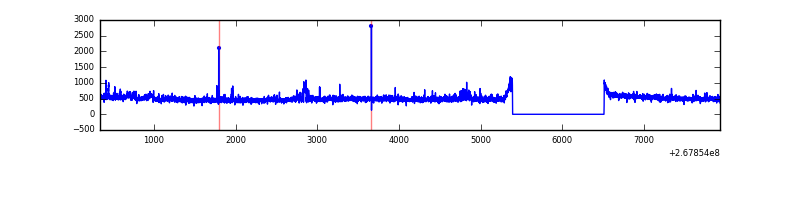 |
| B | 7592 | 6473 | 2 | 2 | 0.03% | 0.03% | 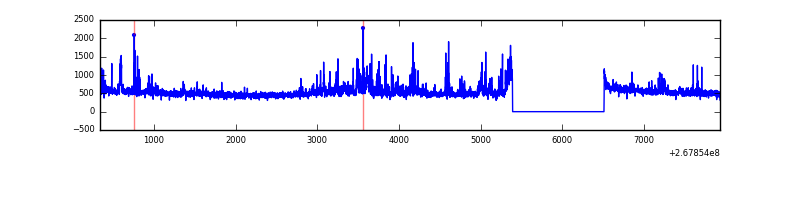 |
| C | 7592 | 6473 | 0 | 0 | 0.00% | 0.00% | 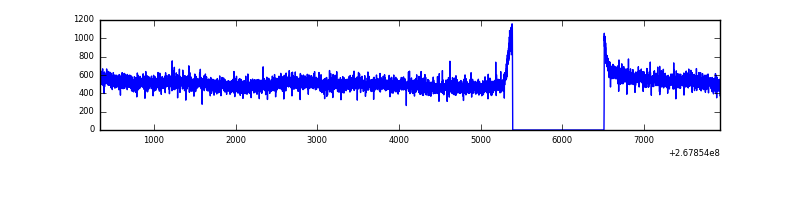 |
| D | 7592 | 6473 | 824 | 824 | 10.85% | 12.73% | 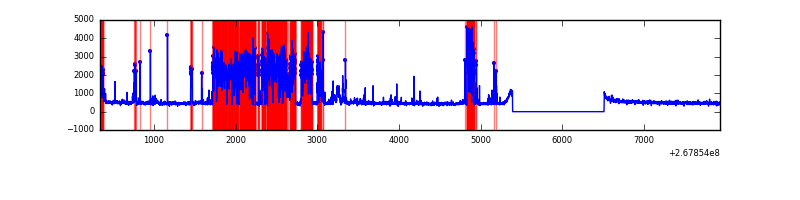 |
Top three noisy pixels from each quadrant. If the there are fewer than three noisy pixels in the level2.evt file, extra rows are filled as -1
| Pixel properties | Quadrant properties | ||||||
|---|---|---|---|---|---|---|---|
| Quadrant | DetID | PixID | Counts | Sigma | Mean | Median | Sigma |
| A | 12 | 189 | 112073 | 685.14 | 813 | 798 | 162.4 |
| A | 9 | 143 | 12979 | 75.0 | 813 | 798 | 162.4 |
| A | 0 | 226 | 7123 | 38.94 | 813 | 798 | 162.4 |
| B | 0 | 219 | 113491 | 740.45 | 811 | 790 | 152.2 |
| B | 0 | 189 | 109698 | 715.53 | 811 | 790 | 152.2 |
| B | 3 | 64 | 36159 | 232.37 | 811 | 790 | 152.2 |
| C | 3 | 233 | 239886 | 1323.73 | 787 | 792 | 180.6 |
| C | 8 | 128 | 11717 | 60.48 | 787 | 792 | 180.6 |
| C | 13 | 61 | 5858 | 28.05 | 787 | 792 | 180.6 |
| D | 13 | 104 | 2219680 | 11577.06 | 743 | 727 | 191.7 |
| D | 9 | 1 | 239897 | 1247.83 | 743 | 727 | 191.7 |
| D | 10 | 70 | 63740 | 328.76 | 743 | 727 | 191.7 |
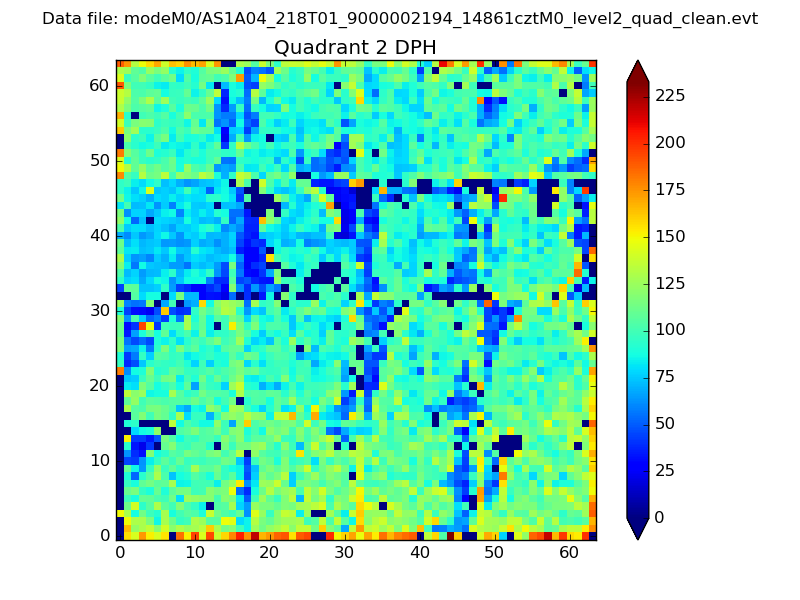
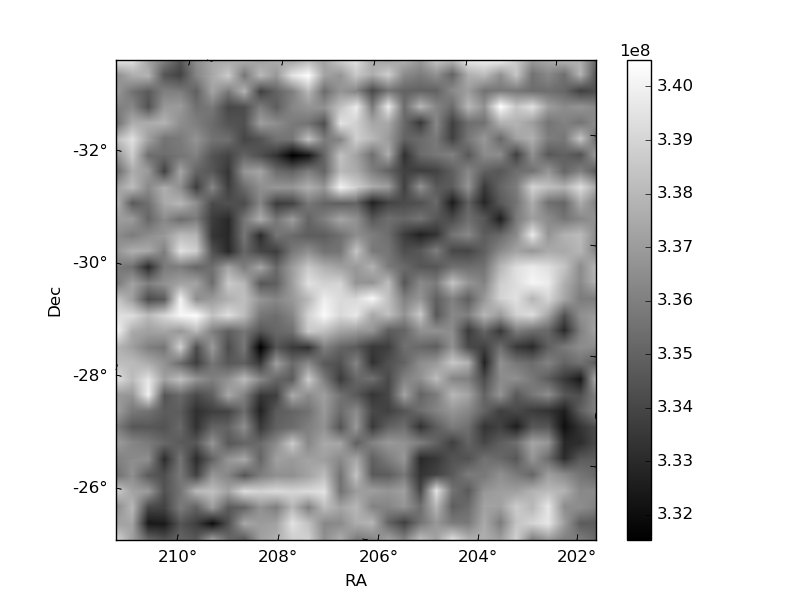
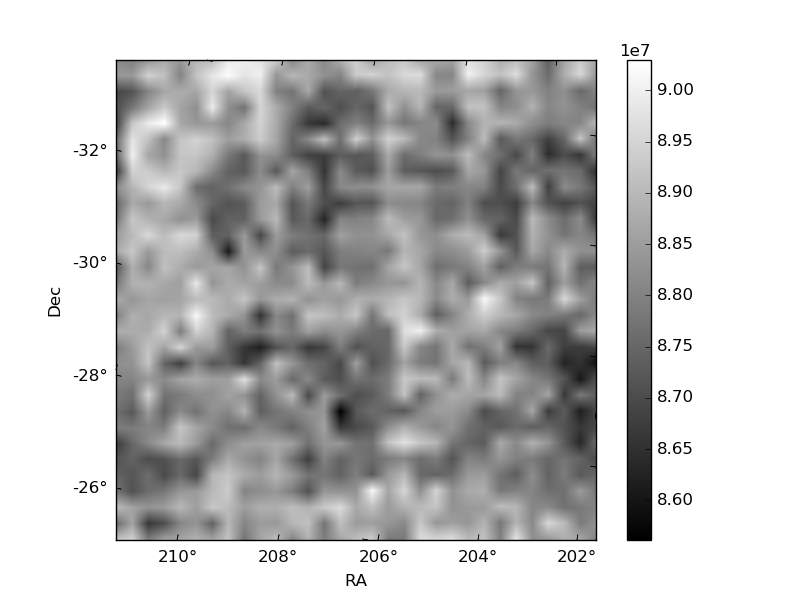
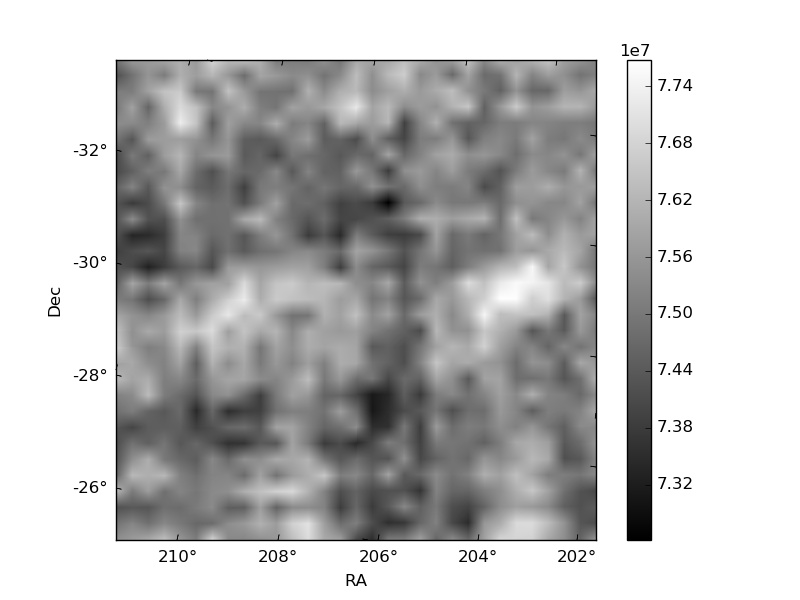
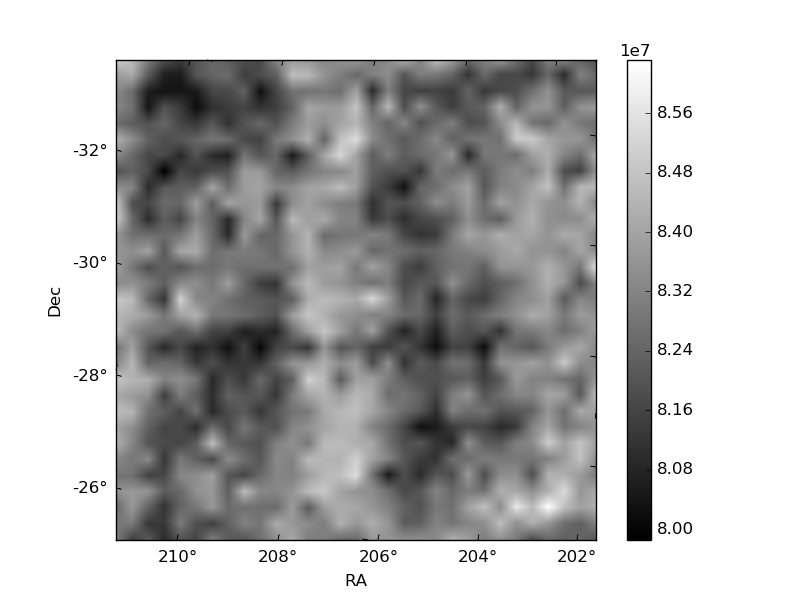
Histogram calculated using DETX and DETY for each event in the final _common_clean file
| Quadrant A | 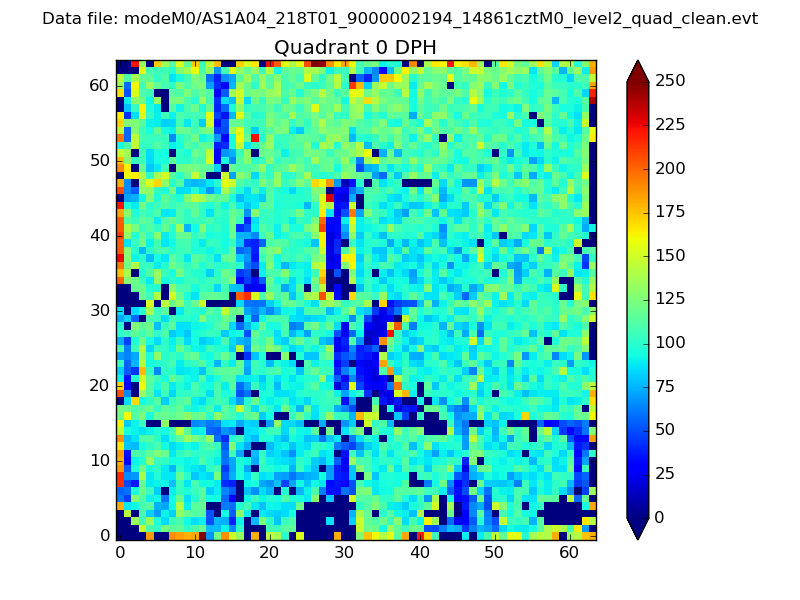 |
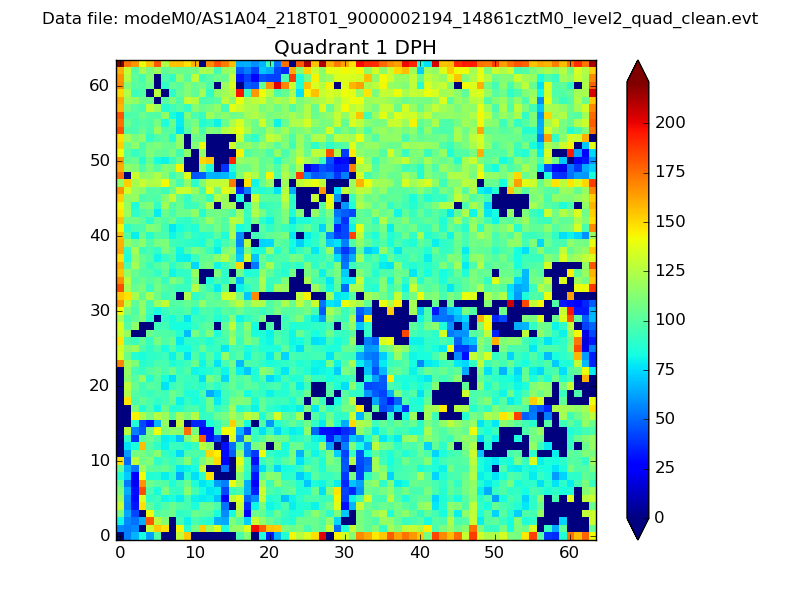 |
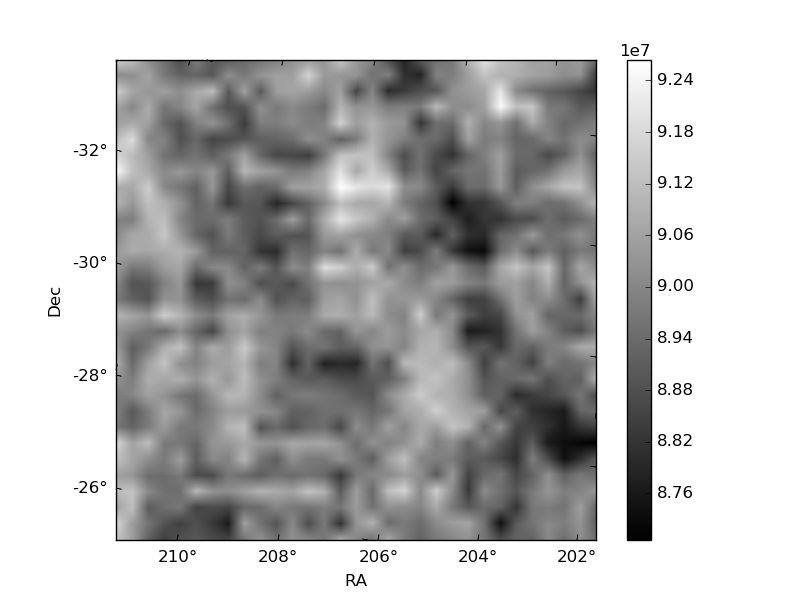
Quadrant B |
|---|---|---|---|
| Quadrant D | 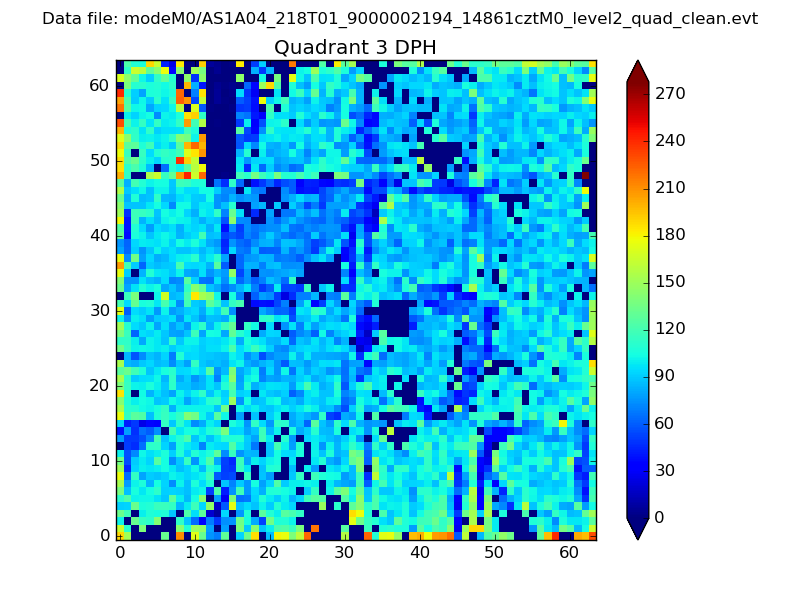 |
 |
Quadrant C |
| Plot type | Count rate plots | Images |
|---|---|---|
| Comparison with Poisson distribution Blue bars denote a histogram of data divided into 1 sec bins. Red curve is a Poisson curve with rate = median count rate of data. |
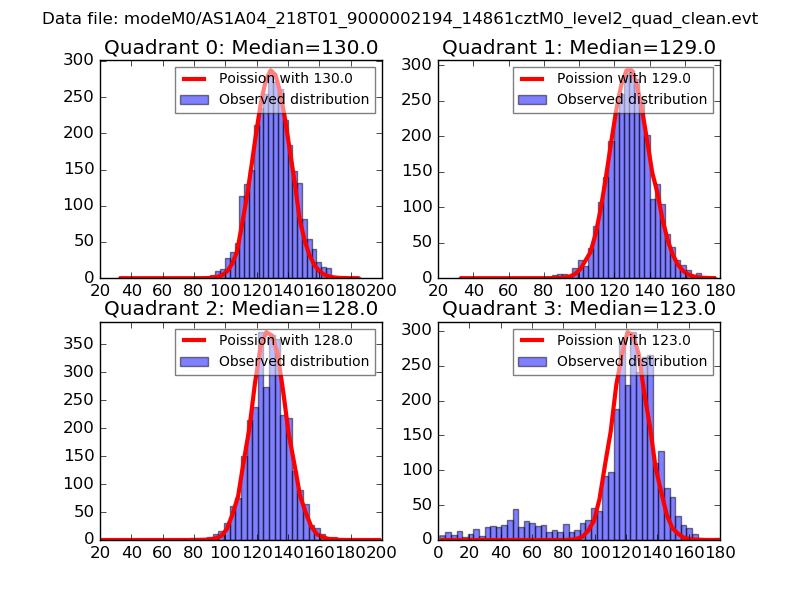 |
 |
| Quadrant-wise count rates Data is divided into 100 sec bins |
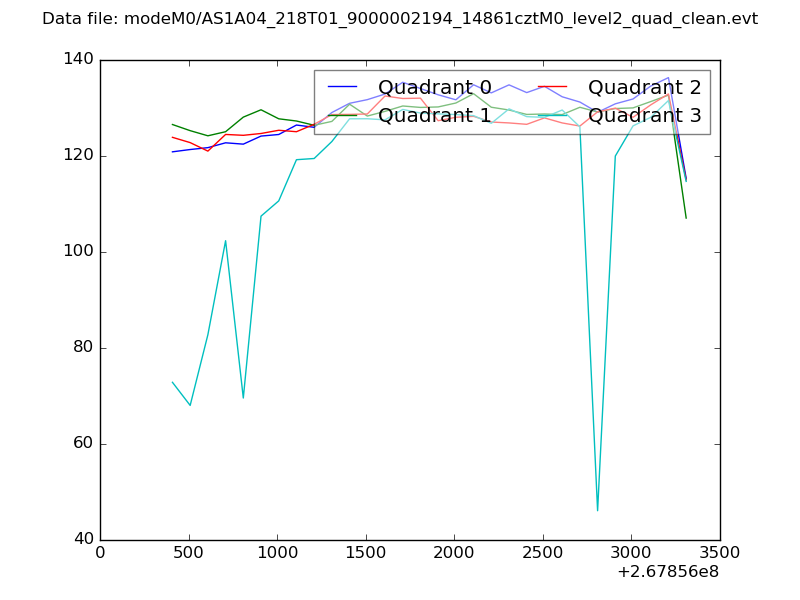 |
|
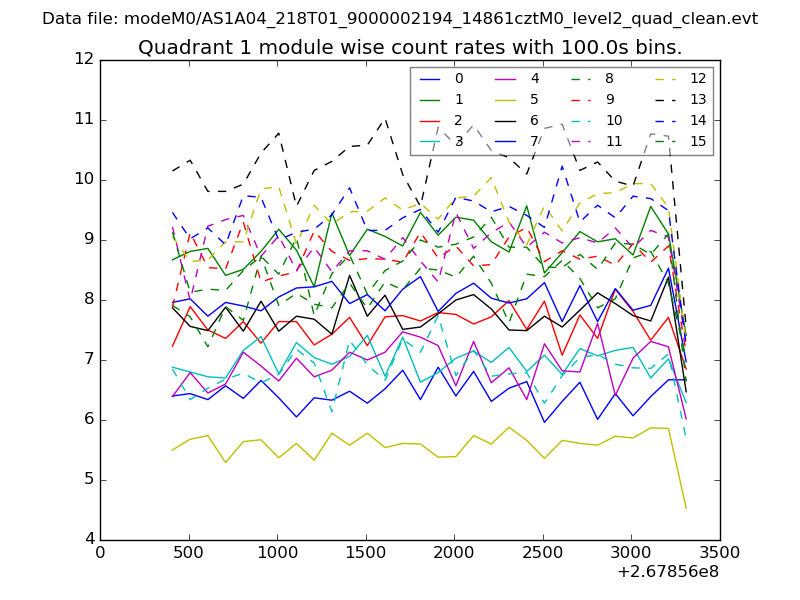
| Module-wise count rates for Quadrant A Data is divided into 100 sec bins |
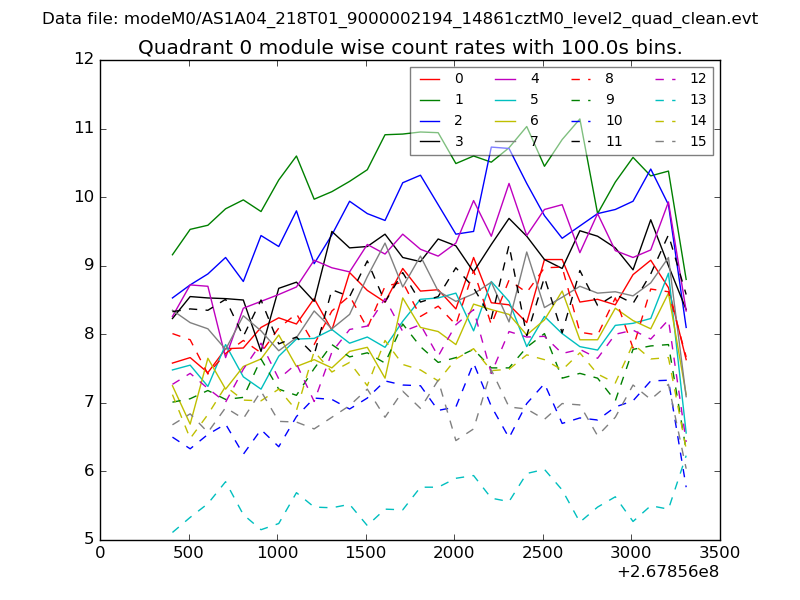 |
 |
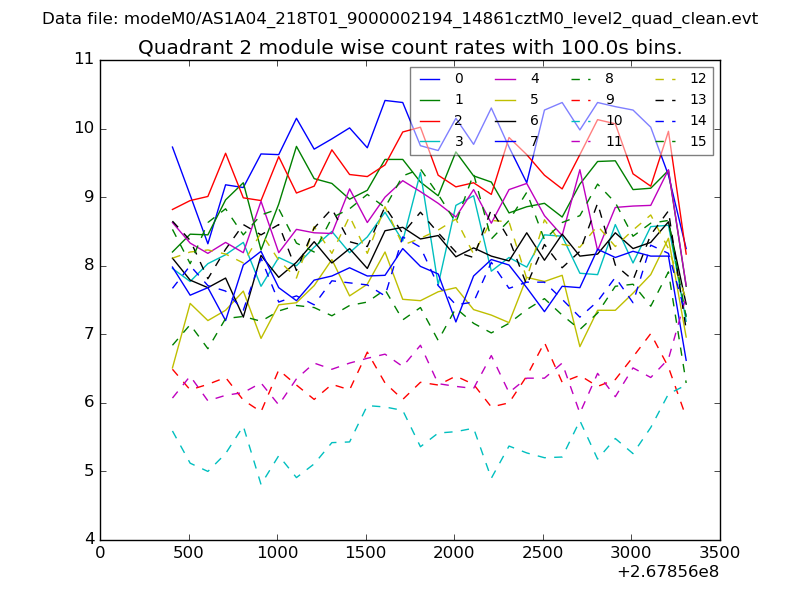
| Module-wise count rates for Quadrant B Data is divided into 100 sec bins |
 |
 |
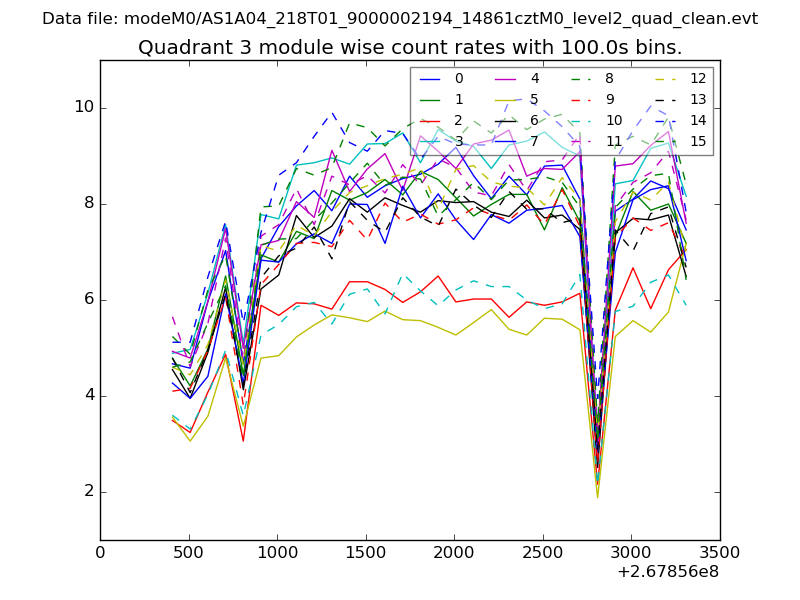
| Module-wise count rates for Quadrant C Data is divided into 100 sec bins |
 |
 |
| Module-wise count rates for Quadrant D Data is divided into 100 sec bins |
 |
 |
| Parameter | Plot |
|---|---|
| CZT HV Monitor | 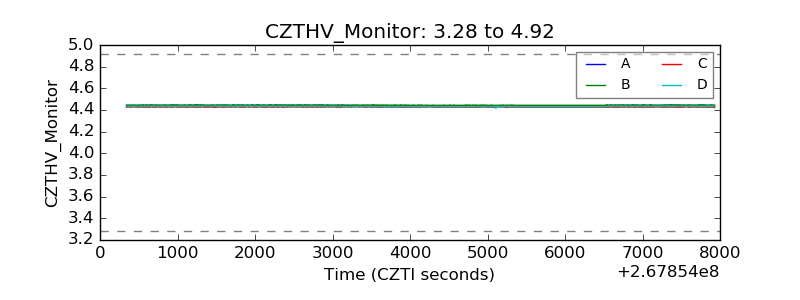 |
| D_VDD | 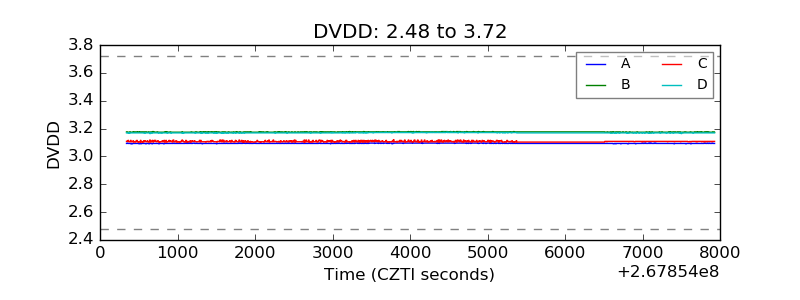 |
| Temperature 1 | 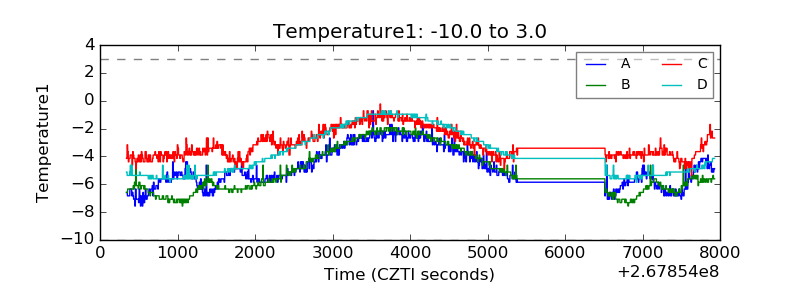 |
| Veto HV Monitor | 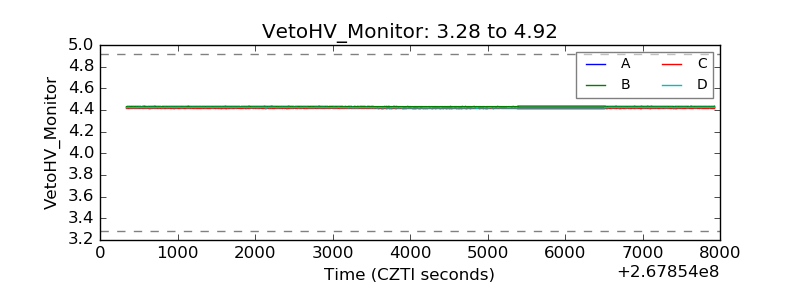 |
| Veto LLD | 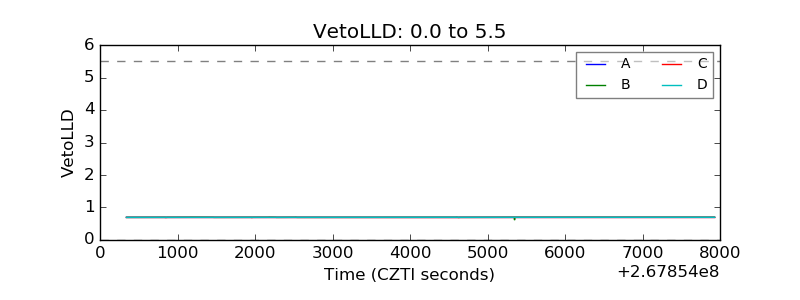 |
| Alpha Counter | 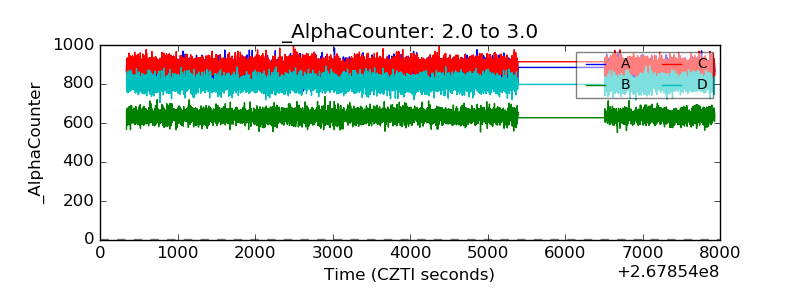 |
| _CPM_Rate | 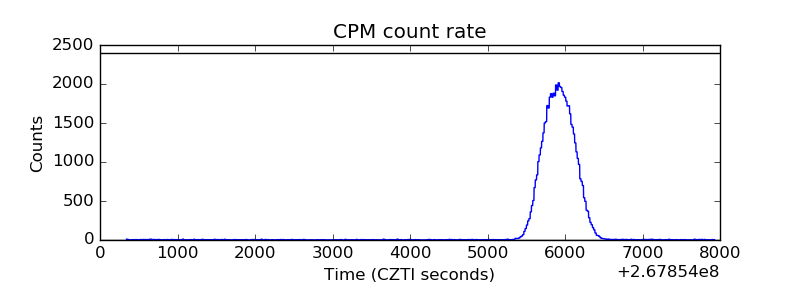 |
| CZT Counter | 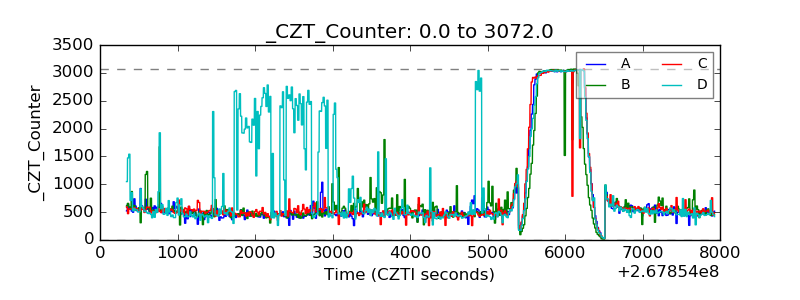 |
| +2.5 Volts monitor |  |
| +5 Volts monitor | 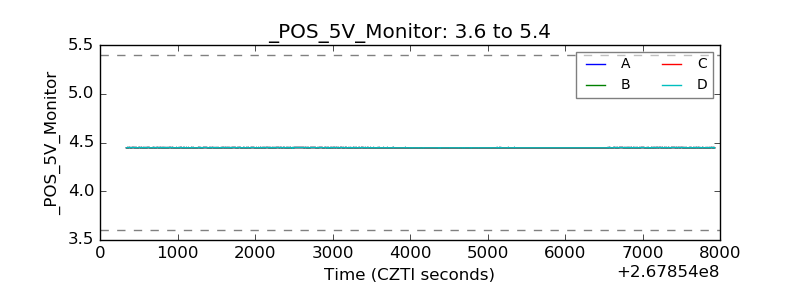 |
| _ROLL_ROT |  |
| _Roll_DEC |  |
| _Roll_RA | 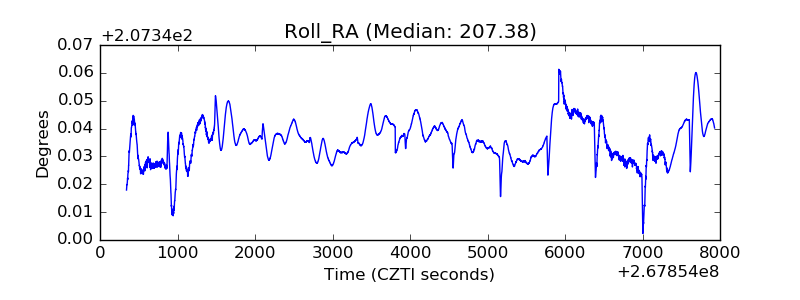 |
| Veto Counter | 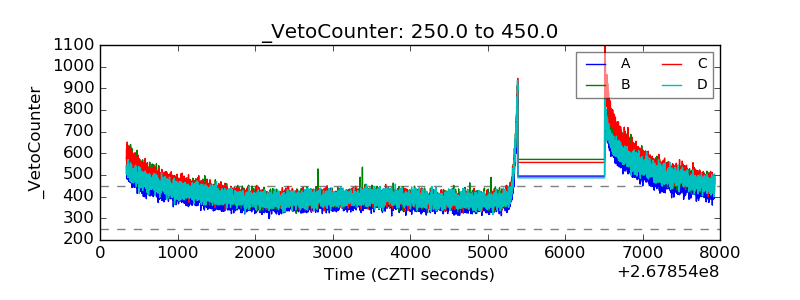 |