| Param | Original file | Final file |
|---|---|---|
| Filename | modeM0/AS1A04_218T01_9000002194_14864cztM0_level2.evt | modeM0/AS1A04_218T01_9000002194_14864cztM0_level2_quad_clean.evt |
| Size (bytes) | 469,137,600 | 89,481,600 |
| Size | 447.4 MB | 85.3 MB |
| Events in quadrant A | 3,376,576 | 578,739 |
| Events in quadrant B | 3,577,273 | 574,402 |
| Events in quadrant C | 3,419,024 | 570,429 |
| Events in quadrant D | 3,412,998 | 552,266 |
| Mode SS | |||
|---|---|---|---|
| Quadrant | BADHDUFLAG | Total packets | Discarded packets |
| A | 0 | 128 | 0 |
| B | 0 | 128 | 0 |
| C | 0 | 128 | 0 |
| D | 0 | 128 | 0 |
| Mode M0 | |||
|---|---|---|---|
| Quadrant | BADHDUFLAG | Total packets | Discarded packets |
| A | 0 | 13823 | 3 |
| B | 0 | 14577 | 2 |
| C | 0 | 14001 | 2 |
| D | 0 | 13962 | 2 |
| Mode M9 | |||
|---|---|---|---|
| Quadrant | BADHDUFLAG | Total packets | Discarded packets |
| A | 0 | 21 | 0 |
| B | 0 | 21 | 0 |
| C | 0 | 21 | 0 |
| D | 0 | 22 | 0 |
| Quadrant | Total seconds | Saturated seconds | Saturation percentage |
|---|---|---|---|
| A | 6210 | 81 | 1.304348% |
| B | 6210 | 98 | 1.578100% |
| C | 6210 | 79 | 1.272142% |
| D | 6210 | 121 | 1.948470% |
Noise dominated data is calculated using 1-second bins in cleaned event files. If a bin has >2000 counts, and if more than 50% of those come from <1% of pixels, then it is considered to be noise-dominated and hence unusable.
| Quadrant | # 1 sec bins | Bins with >0 counts | Bins with >2000 counts | High rate bins dominated by noise | Noise dominated (total time) | Noise dominated (detector-on time) | Marked lightcurve |
|---|---|---|---|---|---|---|---|
| A | 7516 | 6212 | 0 | 0 | 0.00% | 0.00% | 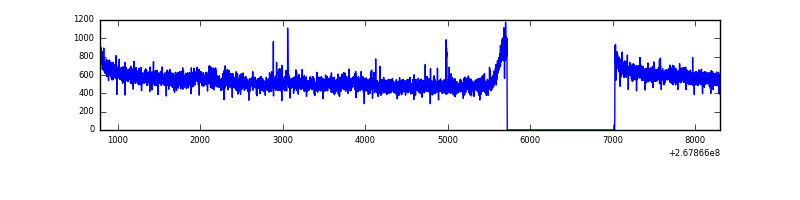 |
| B | 7516 | 6212 | 2 | 2 | 0.03% | 0.03% | 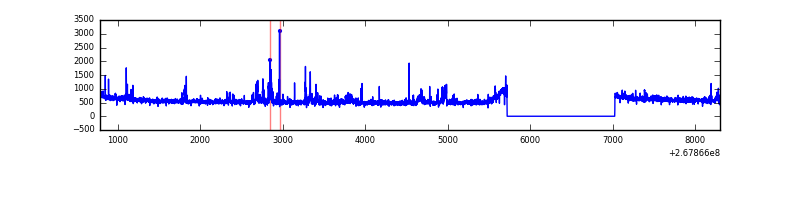 |
| C | 7516 | 6212 | 0 | 0 | 0.00% | 0.00% | 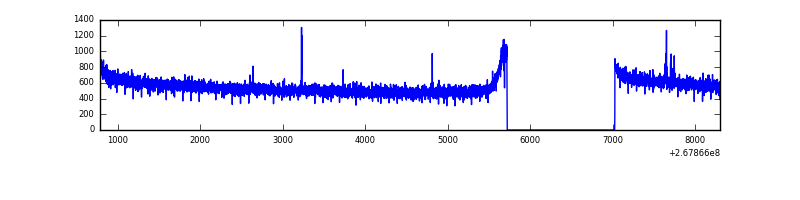 |
| D | 7516 | 6212 | 40 | 40 | 0.53% | 0.64% | 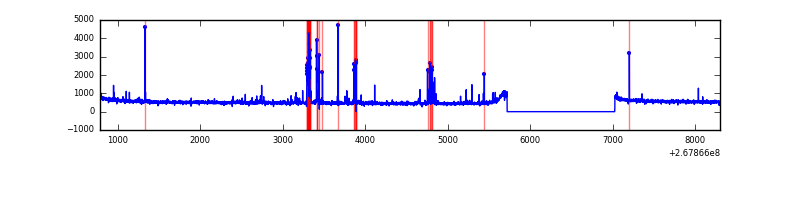 |
Top three noisy pixels from each quadrant. If the there are fewer than three noisy pixels in the level2.evt file, extra rows are filled as -1
| Pixel properties | Quadrant properties | ||||||
|---|---|---|---|---|---|---|---|
| Quadrant | DetID | PixID | Counts | Sigma | Mean | Median | Sigma |
| A | 12 | 189 | 47706 | 274.05 | 862 | 849 | 171.0 |
| A | 3 | 1 | 8777 | 46.37 | 862 | 849 | 171.0 |
| A | 0 | 226 | 7678 | 39.94 | 862 | 849 | 171.0 |
| B | 0 | 189 | 75842 | 473.42 | 848 | 829 | 158.4 |
| B | 0 | 219 | 66480 | 414.34 | 848 | 829 | 158.4 |
| B | 4 | 48 | 33490 | 206.13 | 848 | 829 | 158.4 |
| C | 3 | 233 | 165957 | 876.0 | 831 | 836 | 188.5 |
| C | 6 | 96 | 13531 | 67.35 | 831 | 836 | 188.5 |
| C | 13 | 61 | 5945 | 27.1 | 831 | 836 | 188.5 |
| D | 7 | 254 | 157823 | 746.01 | 829 | 811 | 210.5 |
| D | 7 | 38 | 52693 | 246.51 | 829 | 811 | 210.5 |
| D | 2 | 234 | 24219 | 111.22 | 829 | 811 | 210.5 |
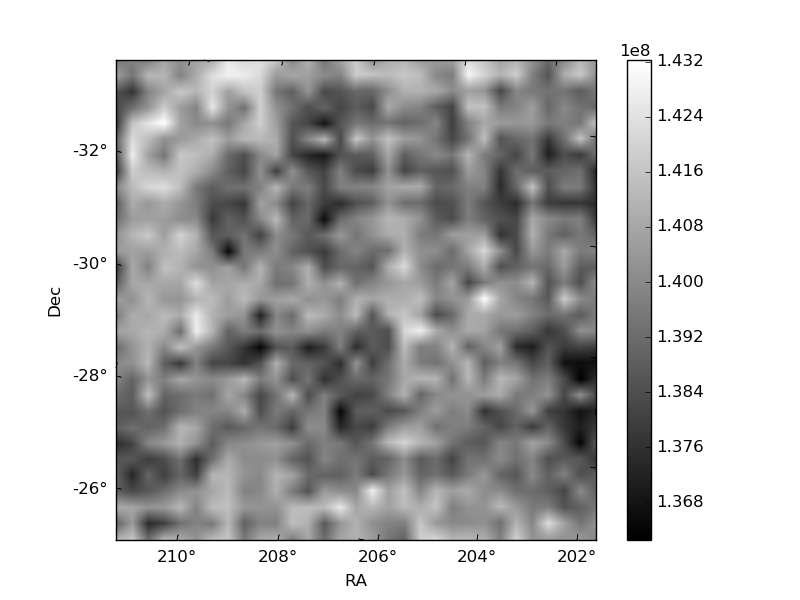
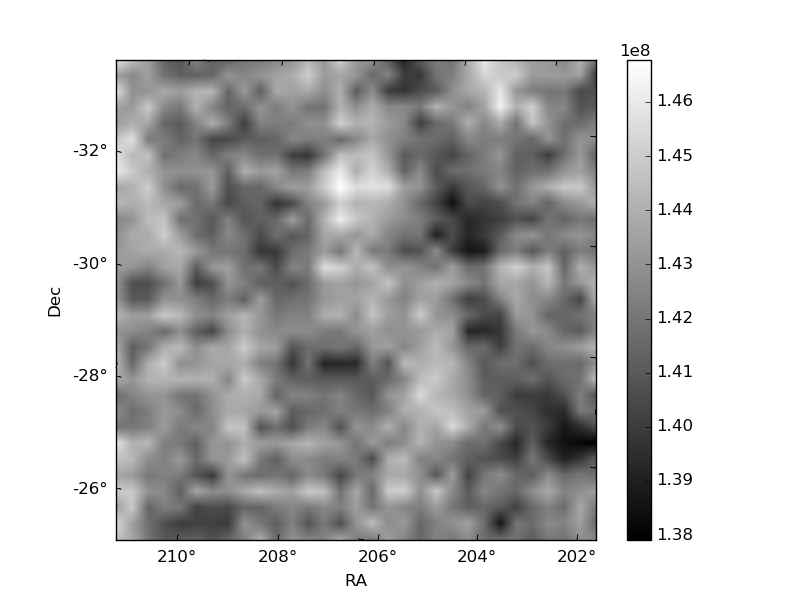
Histogram calculated using DETX and DETY for each event in the final _common_clean file
| Quadrant A | 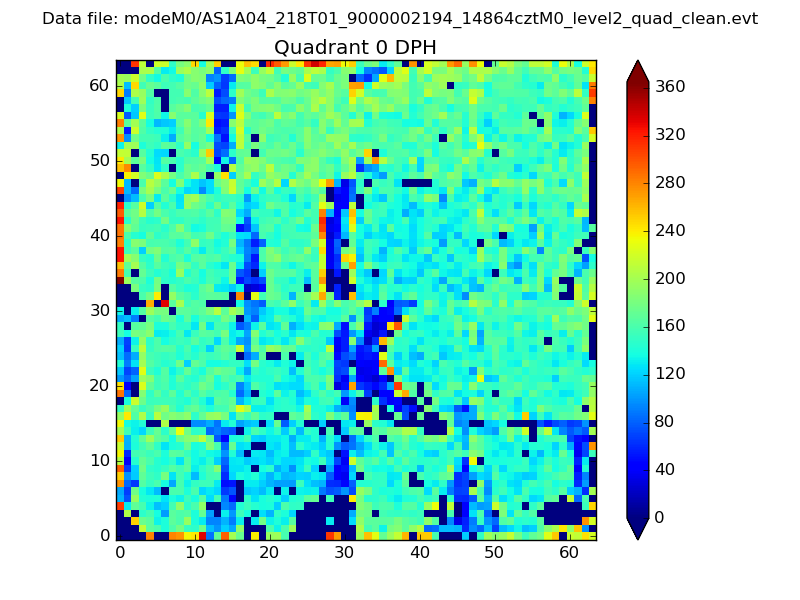 |
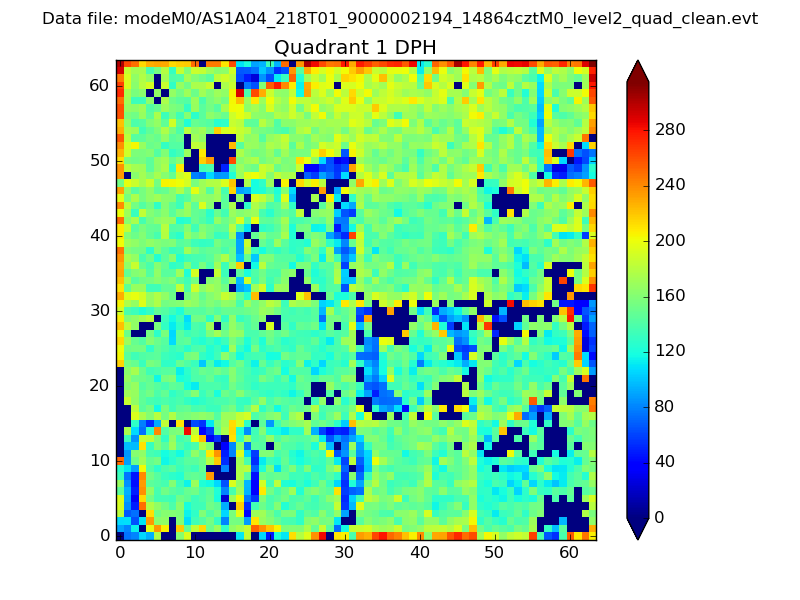 |
Quadrant B |
|---|---|---|---|
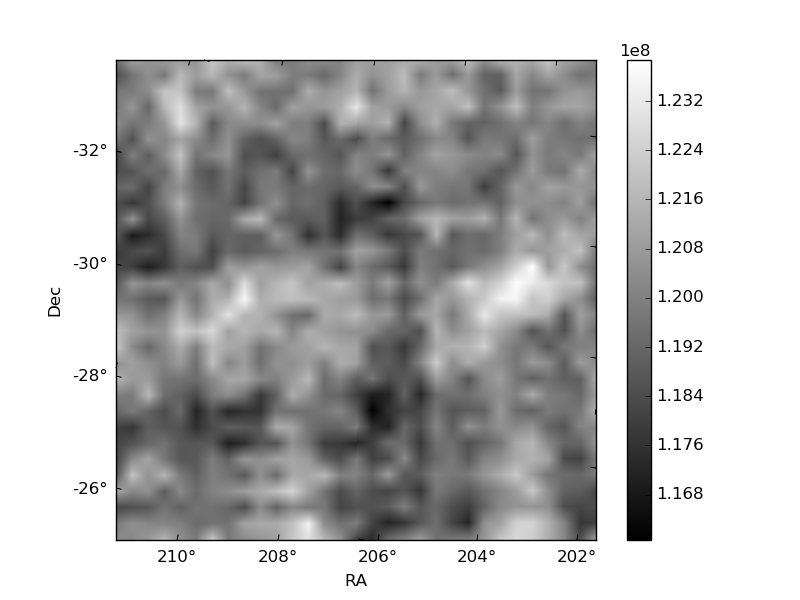
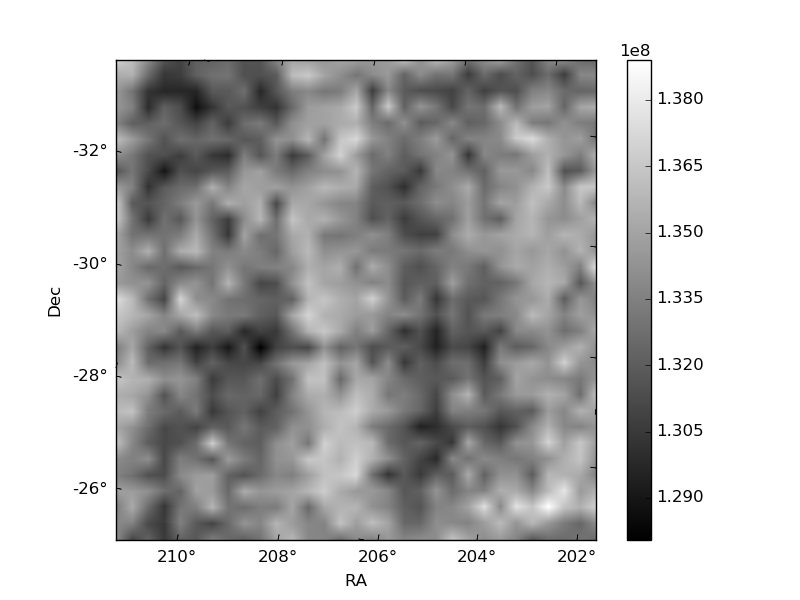
| Quadrant D | 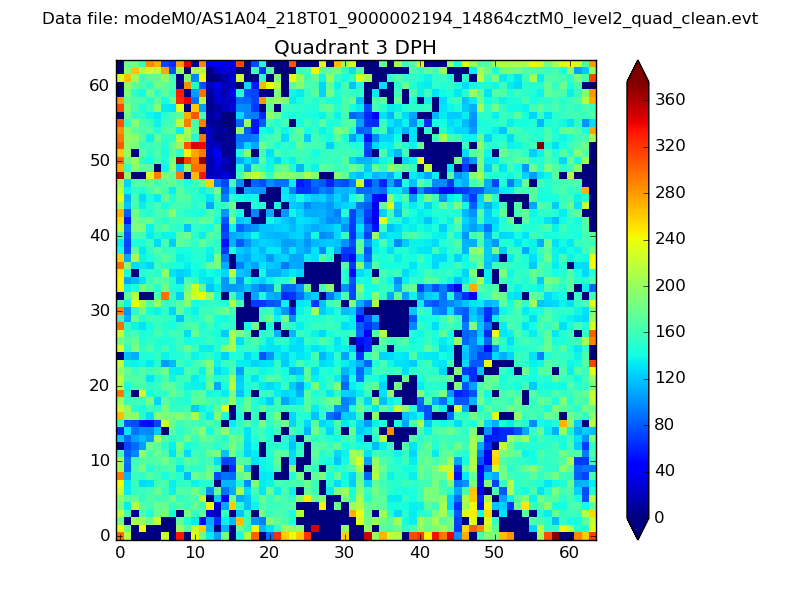 |
 |
Quadrant C |
| Plot type | Count rate plots | Images |
|---|---|---|
| Comparison with Poisson distribution Blue bars denote a histogram of data divided into 1 sec bins. Red curve is a Poisson curve with rate = median count rate of data. |
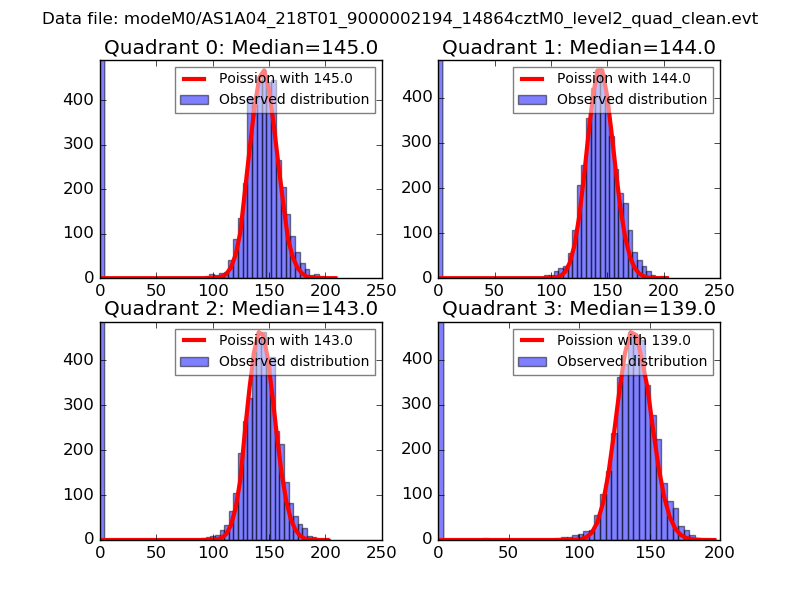 |
 |
| Quadrant-wise count rates Data is divided into 100 sec bins |
 |
|
| Module-wise count rates for Quadrant A Data is divided into 100 sec bins |
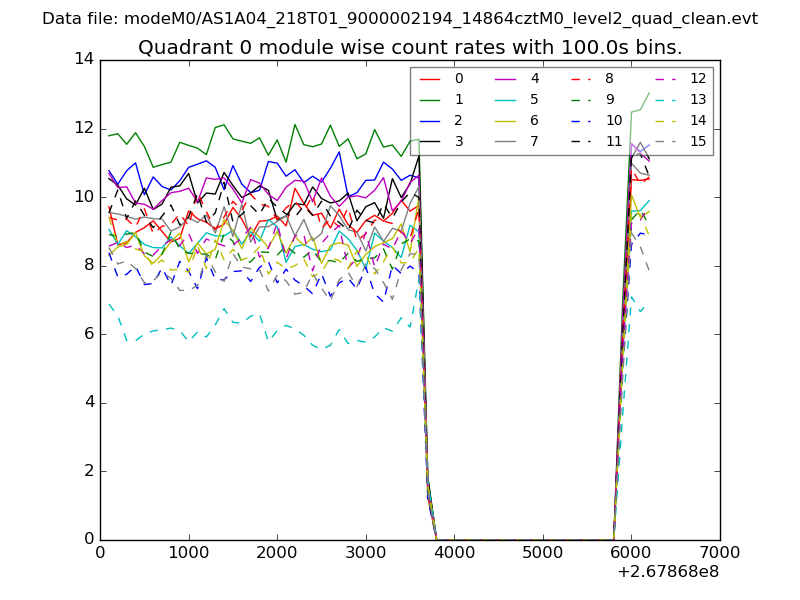 |
 |
| Module-wise count rates for Quadrant B Data is divided into 100 sec bins |
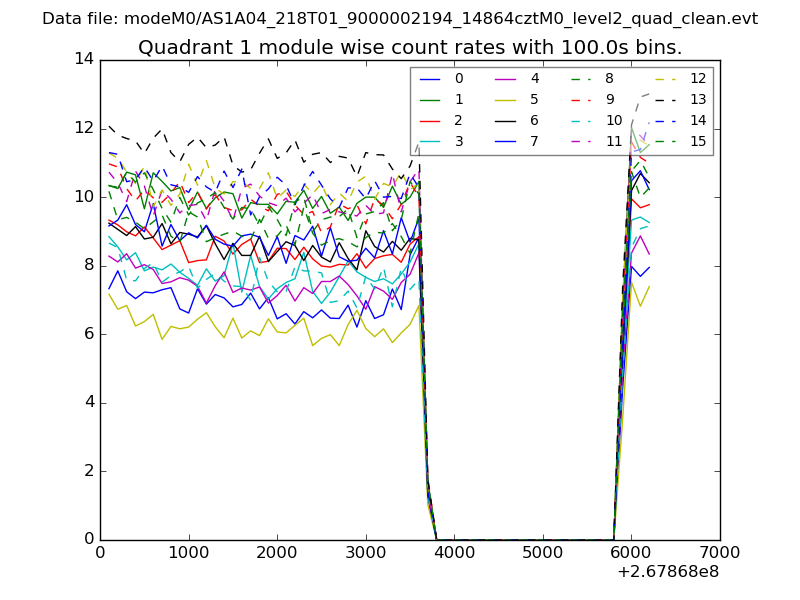 |
 |
| Module-wise count rates for Quadrant C Data is divided into 100 sec bins |
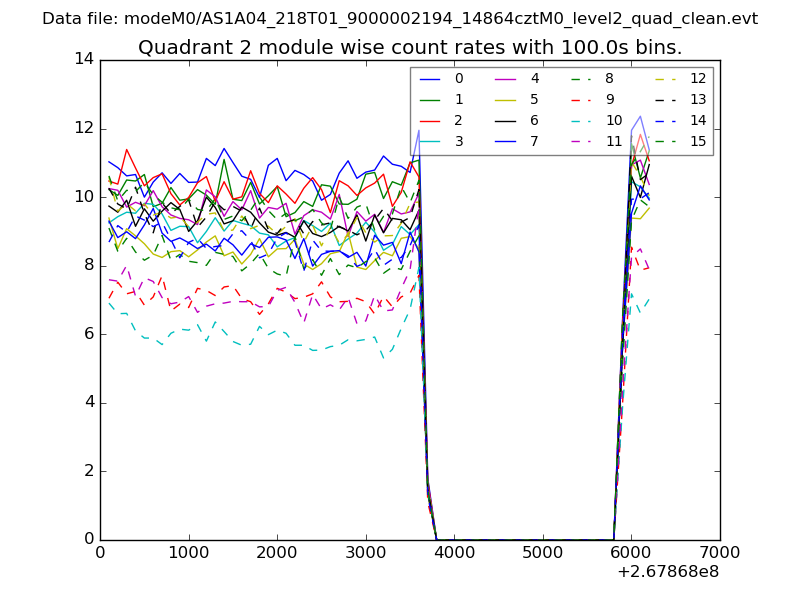 |
 |
| Module-wise count rates for Quadrant D Data is divided into 100 sec bins |
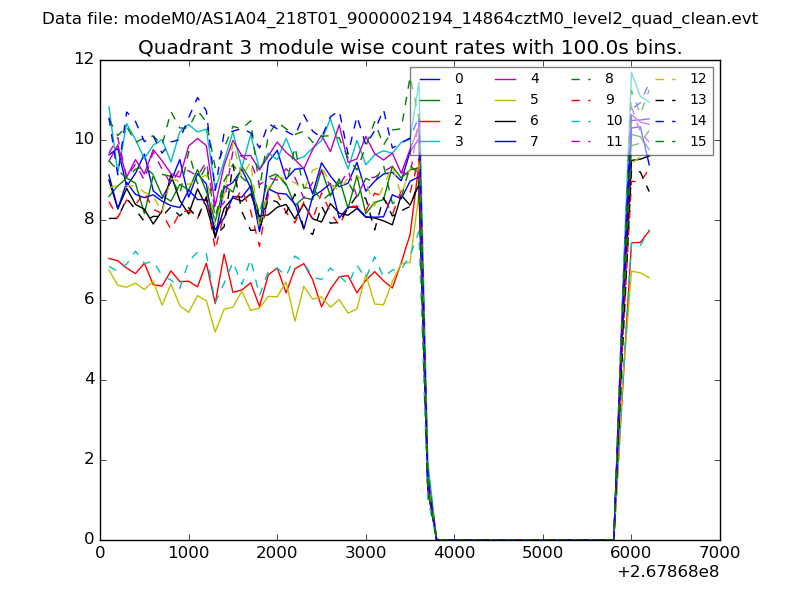 |
 |
| Parameter | Plot |
|---|---|
| CZT HV Monitor | 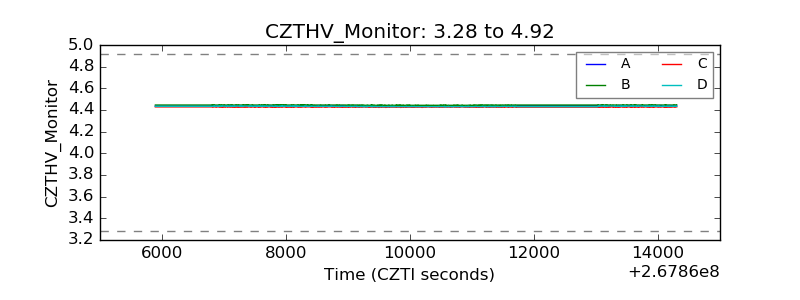 |
| D_VDD | 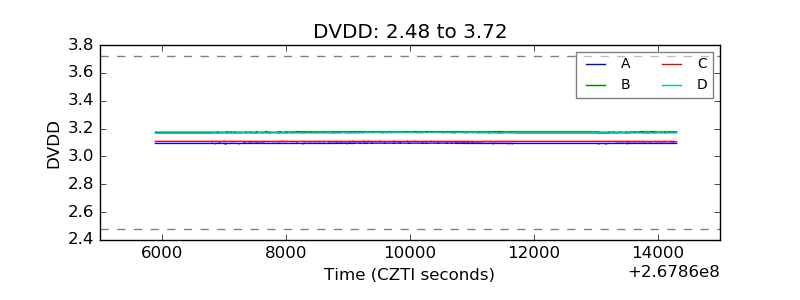 |
| Temperature 1 | 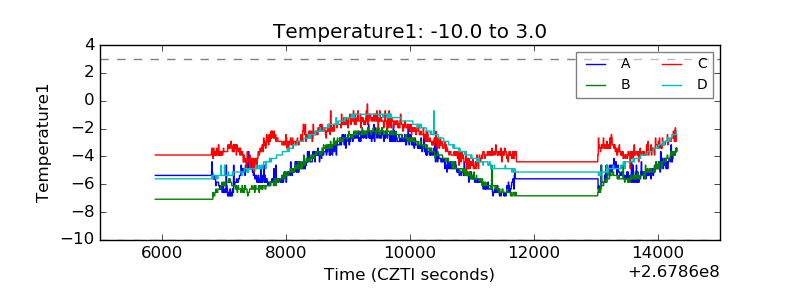 |
| Veto HV Monitor | 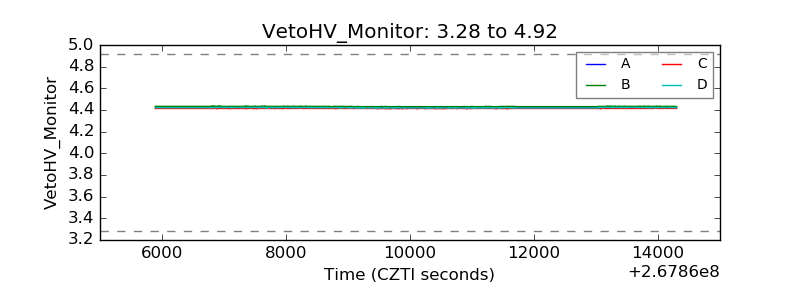 |
| Veto LLD | 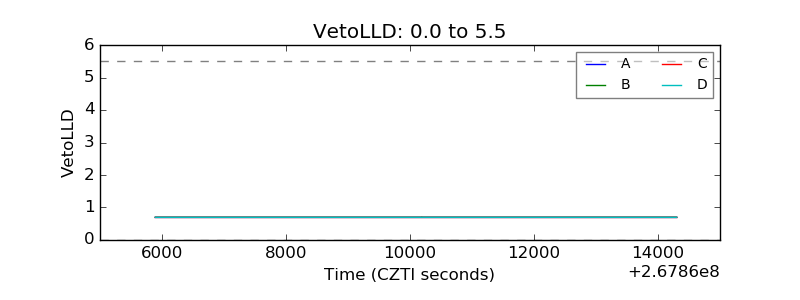 |
| Alpha Counter | 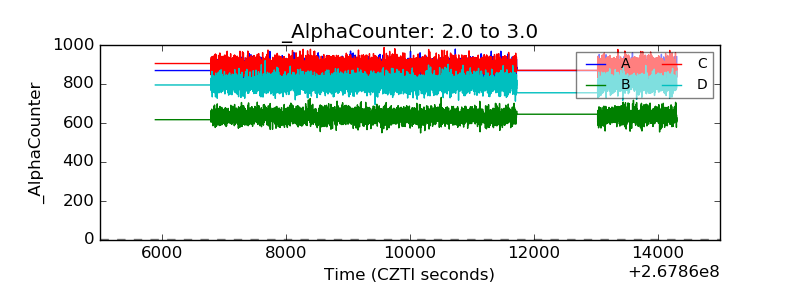 |
| _CPM_Rate | 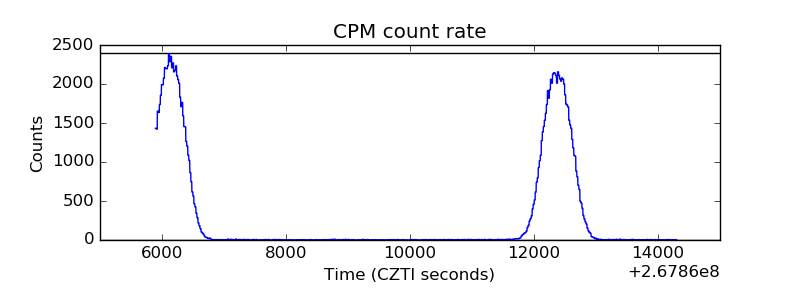 |
| CZT Counter | 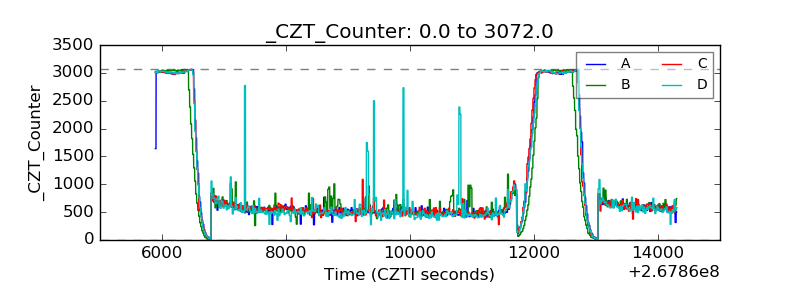 |
| +2.5 Volts monitor |  |
| +5 Volts monitor |  |
| _ROLL_ROT | 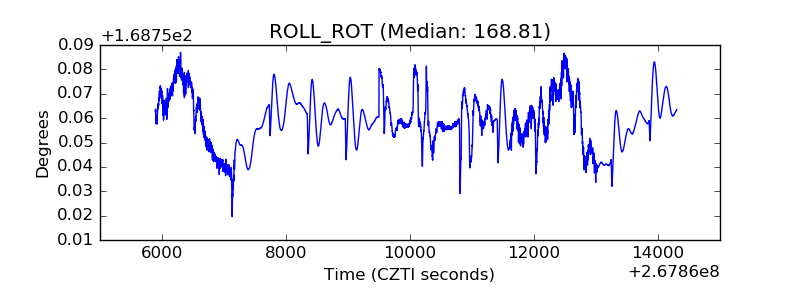 |
| _Roll_DEC | 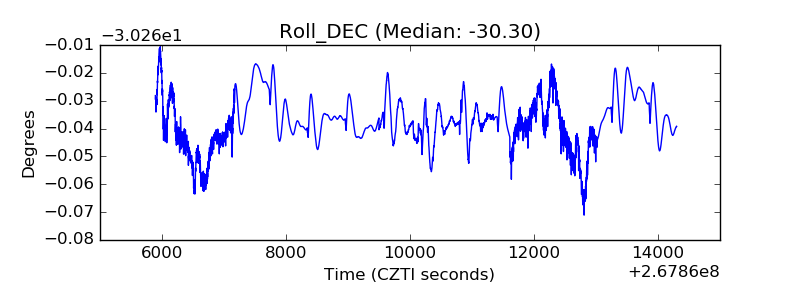 |
| _Roll_RA |  |
| Veto Counter | 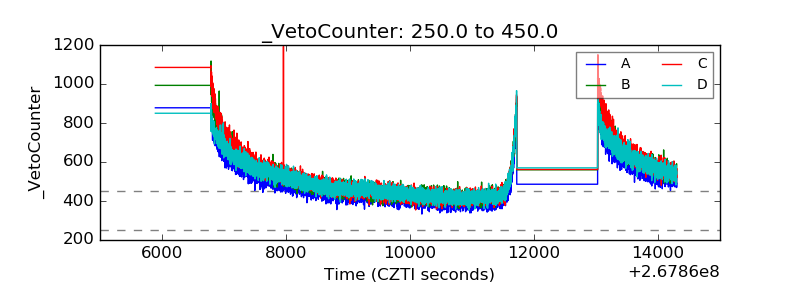 |