| Param | Original file | Final file |
|---|---|---|
| Filename | modeM0/AS1A04_218T01_9000002194_14865cztM0_level2.evt | modeM0/AS1A04_218T01_9000002194_14865cztM0_level2_quad_clean.evt |
| Size (bytes) | 538,657,920 | 101,378,880 |
| Size | 513.7 MB | 96.7 MB |
| Events in quadrant A | 3,430,833 | 677,240 |
| Events in quadrant B | 3,809,749 | 666,410 |
| Events in quadrant C | 3,448,918 | 661,805 |
| Events in quadrant D | 5,201,834 | 630,277 |
| Mode SS | |||
|---|---|---|---|
| Quadrant | BADHDUFLAG | Total packets | Discarded packets |
| A | 0 | 126 | 0 |
| B | 0 | 126 | 0 |
| C | 0 | 126 | 0 |
| D | 0 | 126 | 0 |
| Mode M0 | |||
|---|---|---|---|
| Quadrant | BADHDUFLAG | Total packets | Discarded packets |
| A | 0 | 14001 | 3 |
| B | 0 | 15507 | 2 |
| C | 0 | 14136 | 2 |
| D | 0 | 19431 | 2 |
| Mode M9 | |||
|---|---|---|---|
| Quadrant | BADHDUFLAG | Total packets | Discarded packets |
| A | 0 | 23 | 0 |
| B | 0 | 23 | 0 |
| C | 0 | 23 | 0 |
| D | 0 | 24 | 0 |
| Quadrant | Total seconds | Saturated seconds | Saturation percentage |
|---|---|---|---|
| A | 6228 | 95 | 1.525369% |
| B | 6228 | 149 | 2.392421% |
| C | 6228 | 85 | 1.364804% |
| D | 6228 | 709 | 11.384072% |
Noise dominated data is calculated using 1-second bins in cleaned event files. If a bin has >2000 counts, and if more than 50% of those come from <1% of pixels, then it is considered to be noise-dominated and hence unusable.
| Quadrant | # 1 sec bins | Bins with >0 counts | Bins with >2000 counts | High rate bins dominated by noise | Noise dominated (total time) | Noise dominated (detector-on time) | Marked lightcurve |
|---|---|---|---|---|---|---|---|
| A | 7554 | 6230 | 0 | 0 | 0.00% | 0.00% | 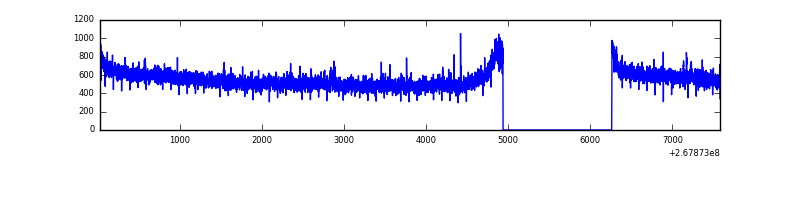 |
| B | 7554 | 6230 | 29 | 29 | 0.38% | 0.47% | 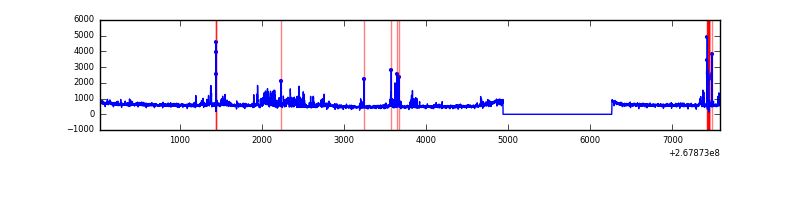 |
| C | 7554 | 6230 | 0 | 0 | 0.00% | 0.00% | 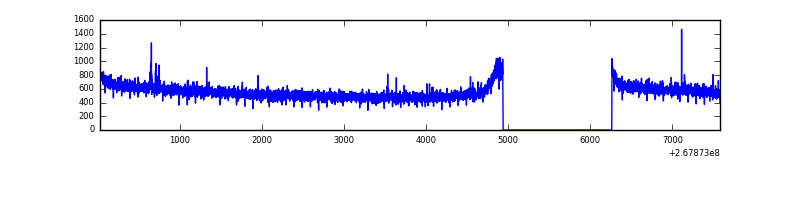 |
| D | 7554 | 6230 | 502 | 502 | 6.65% | 8.06% | 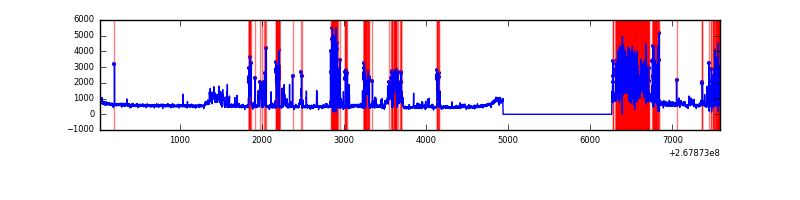 |
Top three noisy pixels from each quadrant. If the there are fewer than three noisy pixels in the level2.evt file, extra rows are filled as -1
| Pixel properties | Quadrant properties | ||||||
|---|---|---|---|---|---|---|---|
| Quadrant | DetID | PixID | Counts | Sigma | Mean | Median | Sigma |
| A | 12 | 189 | 64089 | 363.88 | 872 | 856 | 173.8 |
| A | 15 | 239 | 11940 | 63.78 | 872 | 856 | 173.8 |
| A | 0 | 226 | 7919 | 40.64 | 872 | 856 | 173.8 |
| B | 0 | 219 | 195390 | 1220.15 | 851 | 832 | 159.5 |
| B | 0 | 189 | 74243 | 460.39 | 851 | 832 | 159.5 |
| B | 3 | 64 | 61506 | 380.51 | 851 | 832 | 159.5 |
| C | 3 | 233 | 179142 | 937.63 | 836 | 842 | 190.2 |
| C | 6 | 96 | 7760 | 36.38 | 836 | 842 | 190.2 |
| C | 13 | 61 | 5990 | 27.07 | 836 | 842 | 190.2 |
| D | 7 | 254 | 1194335 | 6137.62 | 800 | 783 | 194.5 |
| D | 13 | 104 | 870439 | 4472.04 | 800 | 783 | 194.5 |
| D | 13 | 172 | 46304 | 234.08 | 800 | 783 | 194.5 |
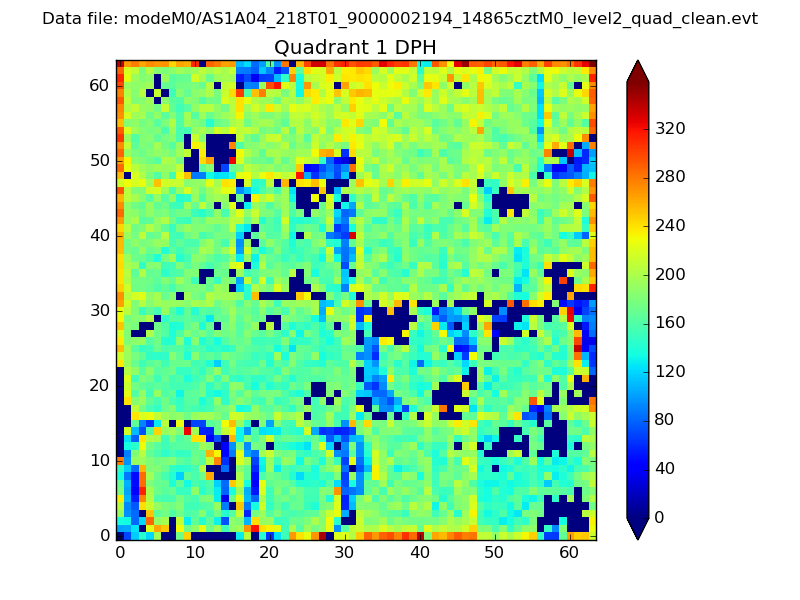
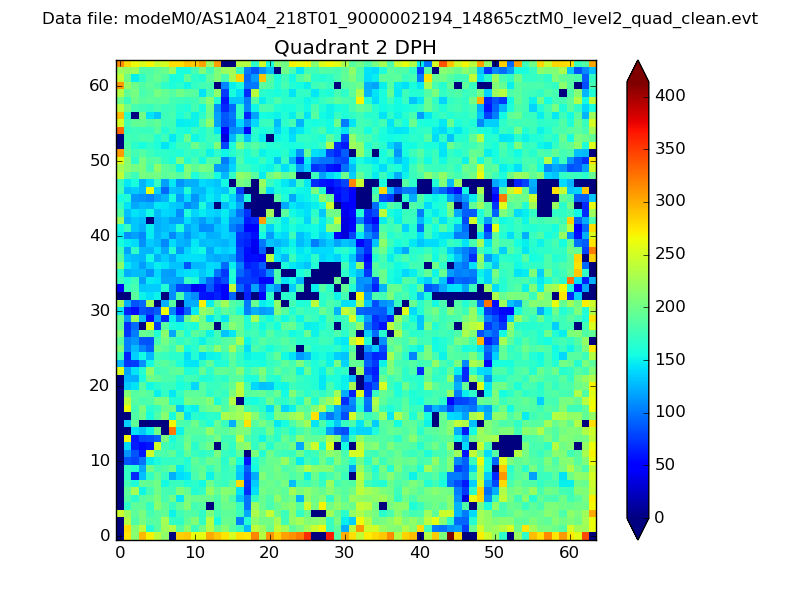
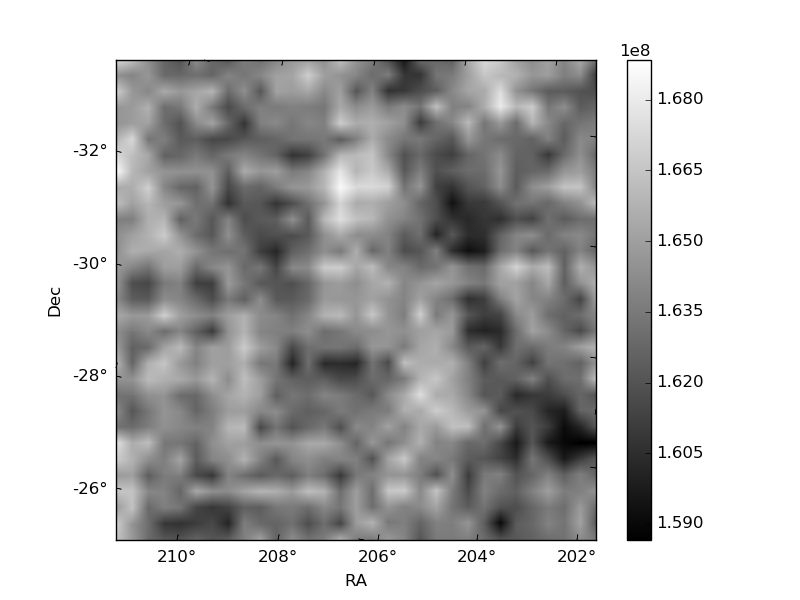
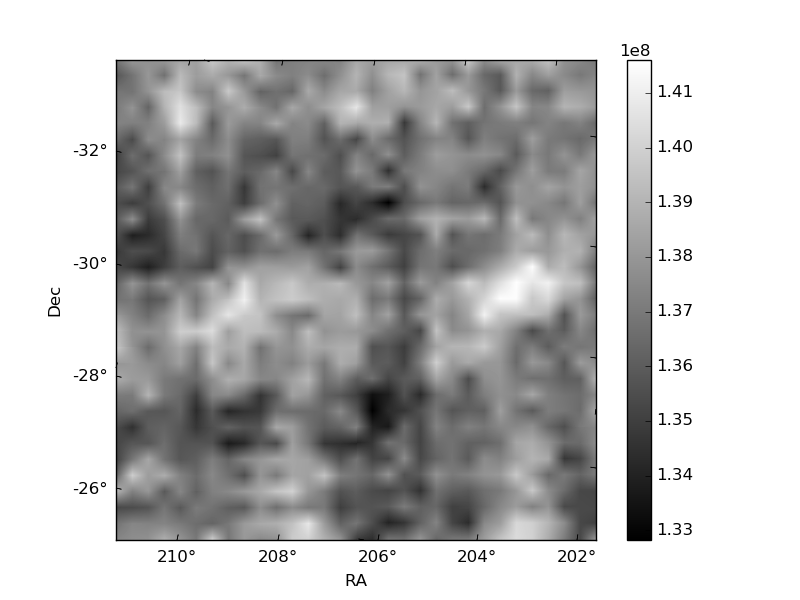
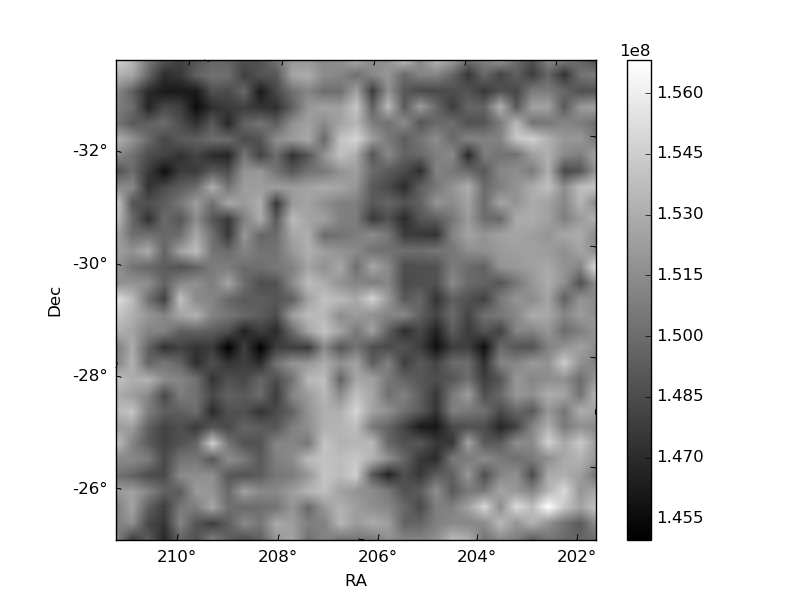
Histogram calculated using DETX and DETY for each event in the final _common_clean file
| Quadrant A |  |
 |
Quadrant B |
|---|---|---|---|
| Quadrant D |  |
 |
Quadrant C |
| Plot type | Count rate plots | Images |
|---|---|---|
| Comparison with Poisson distribution Blue bars denote a histogram of data divided into 1 sec bins. Red curve is a Poisson curve with rate = median count rate of data. |
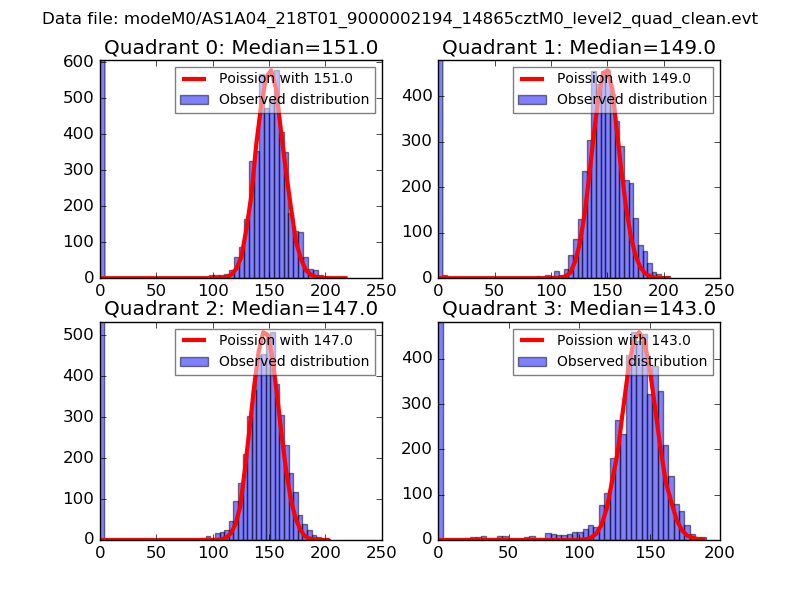 |
 |
| Quadrant-wise count rates Data is divided into 100 sec bins |
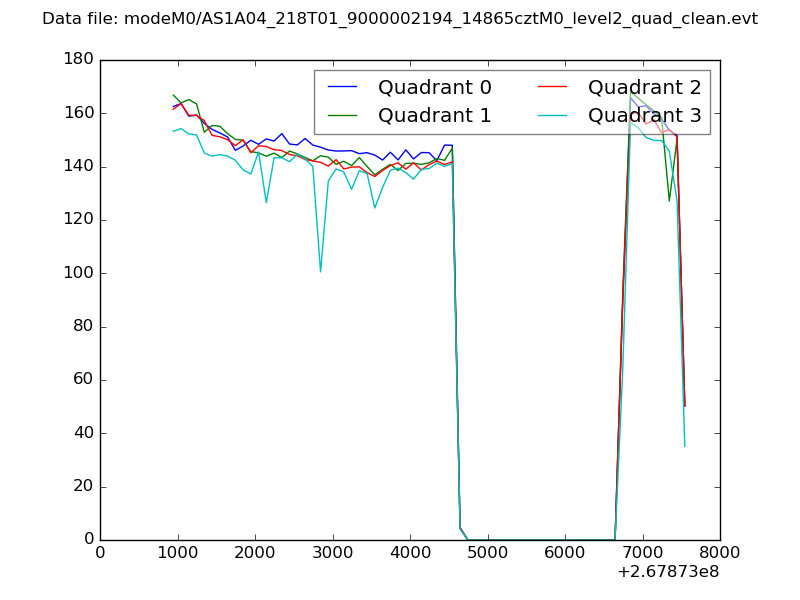 |
|
| Module-wise count rates for Quadrant A Data is divided into 100 sec bins |
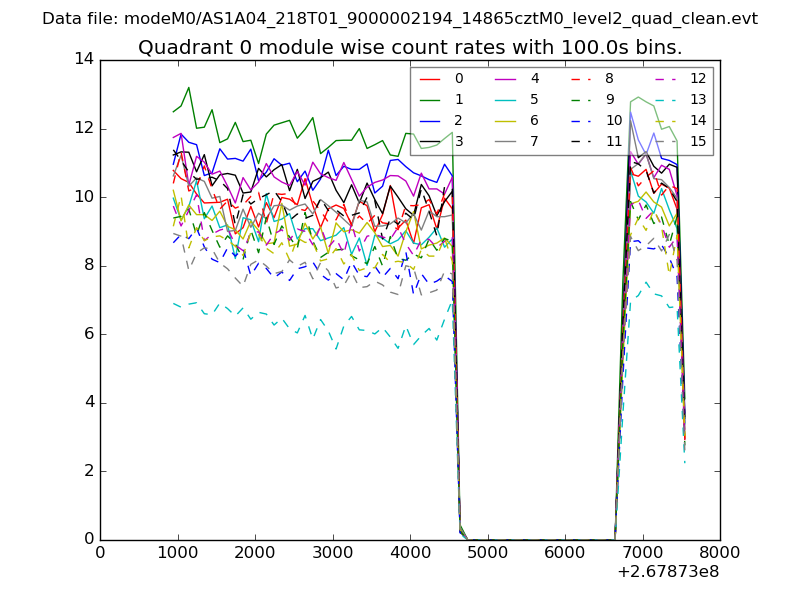 |
 |
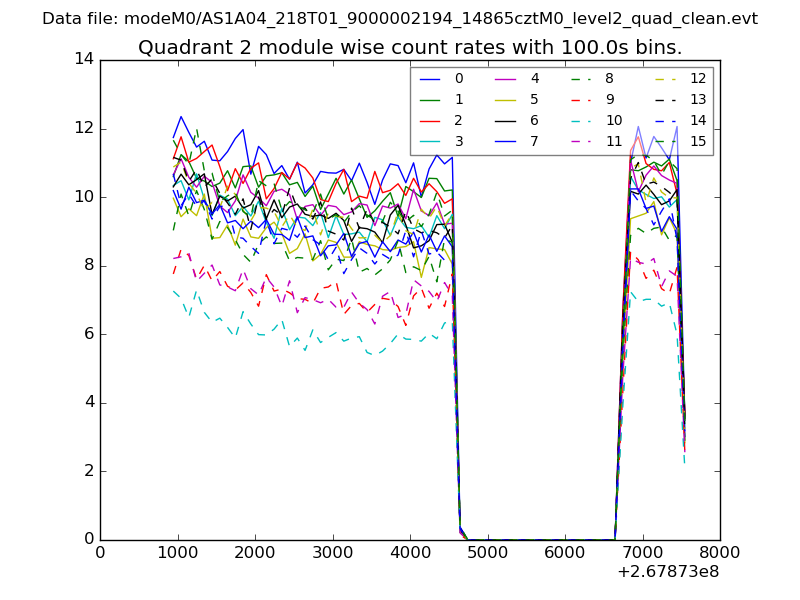
| Module-wise count rates for Quadrant B Data is divided into 100 sec bins |
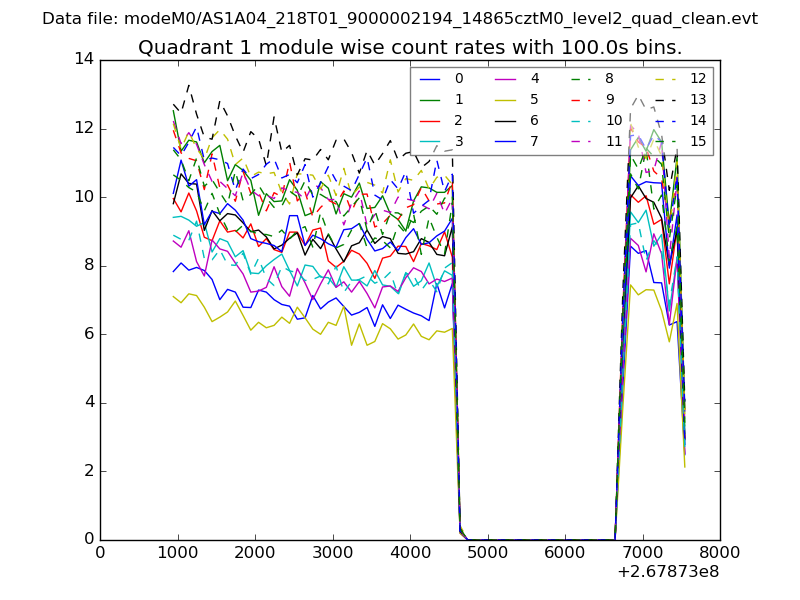 |
 |
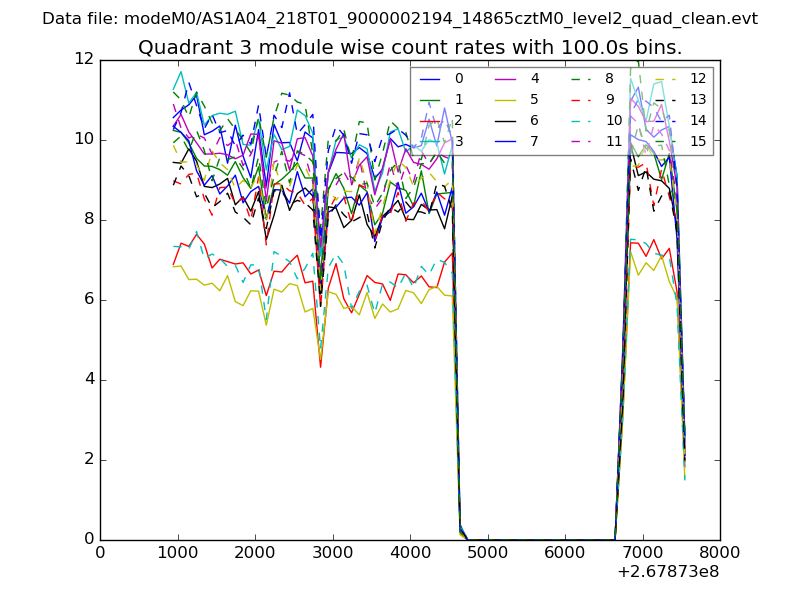
| Module-wise count rates for Quadrant C Data is divided into 100 sec bins |
 |
 |
| Module-wise count rates for Quadrant D Data is divided into 100 sec bins |
 |
 |
| Parameter | Plot |
|---|---|
| CZT HV Monitor | 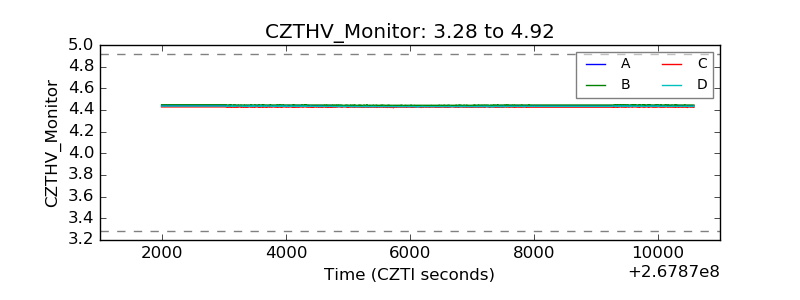 |
| D_VDD | 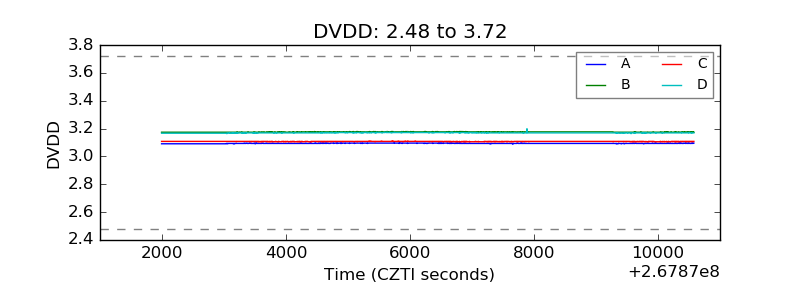 |
| Temperature 1 | 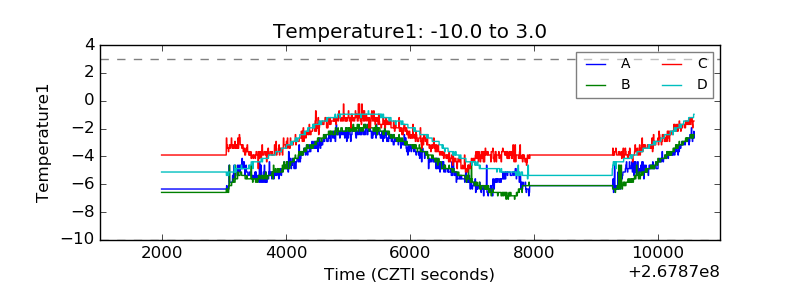 |
| Veto HV Monitor | 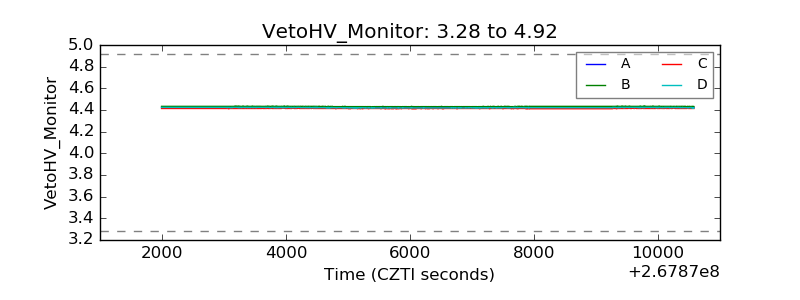 |
| Veto LLD | 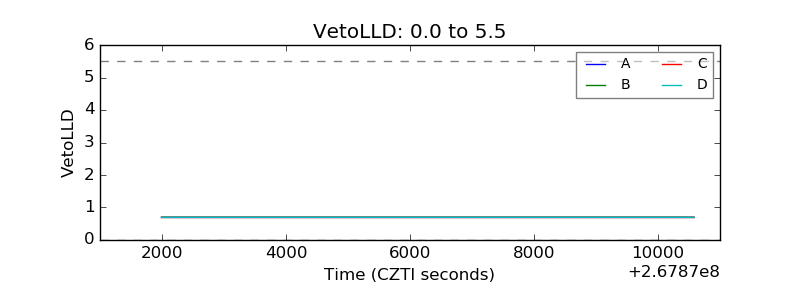 |
| Alpha Counter | 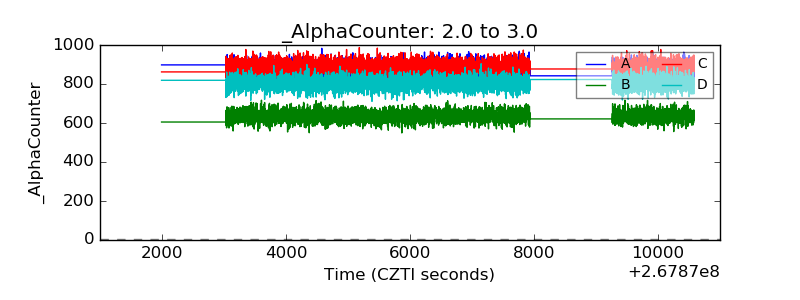 |
| _CPM_Rate | 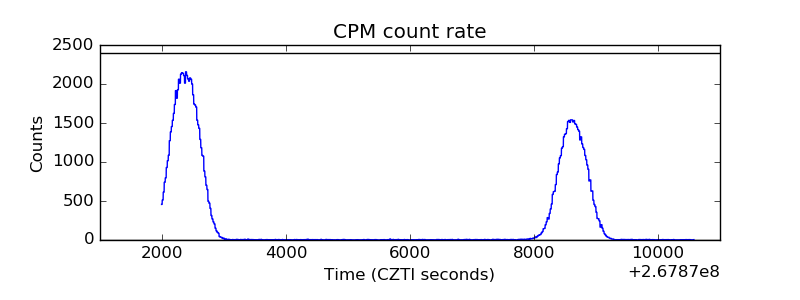 |
| CZT Counter | 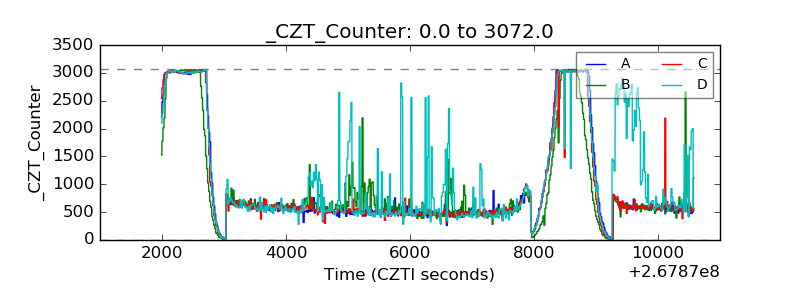 |
| +2.5 Volts monitor |  |
| +5 Volts monitor |  |
| _ROLL_ROT | 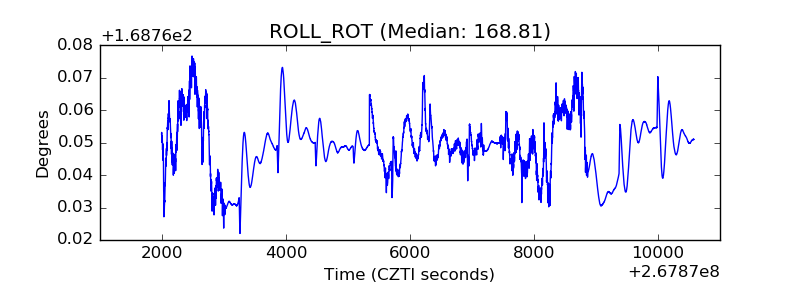 |
| _Roll_DEC | 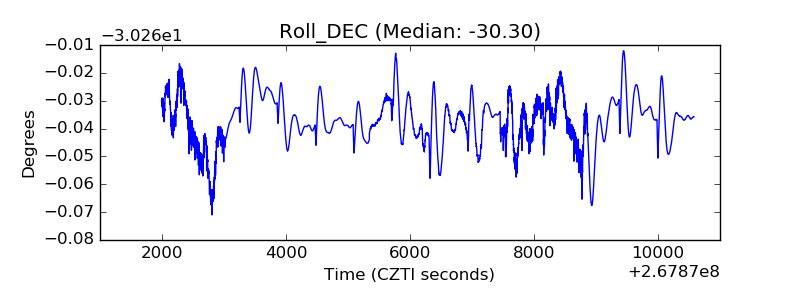 |
| _Roll_RA | 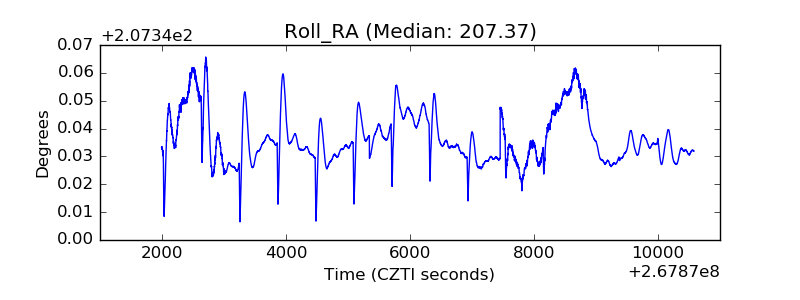 |
| Veto Counter | 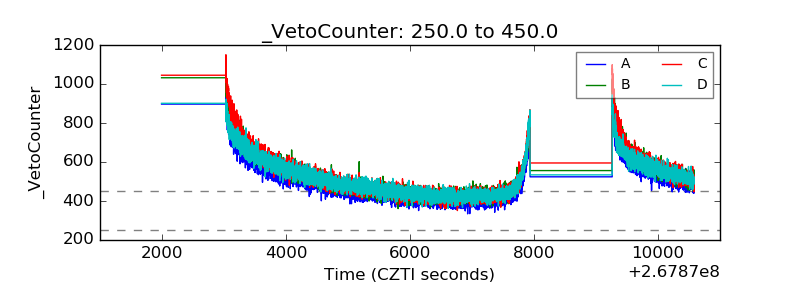 |