| Param | Original file | Final file |
|---|---|---|
| Filename | modeM0/AS1A04_218T01_9000002194_14866cztM0_level2.evt | modeM0/AS1A04_218T01_9000002194_14866cztM0_level2_quad_clean.evt |
| Size (bytes) | 500,077,440 | 105,995,520 |
| Size | 476.9 MB | 101.1 MB |
| Events in quadrant A | 3,222,250 | 728,765 |
| Events in quadrant B | 3,358,605 | 718,438 |
| Events in quadrant C | 3,171,853 | 704,212 |
| Events in quadrant D | 4,986,816 | 641,352 |
| Mode SS | |||
|---|---|---|---|
| Quadrant | BADHDUFLAG | Total packets | Discarded packets |
| A | 0 | 120 | 0 |
| B | 0 | 120 | 0 |
| C | 0 | 120 | 0 |
| D | 0 | 120 | 0 |
| Mode M0 | |||
|---|---|---|---|
| Quadrant | BADHDUFLAG | Total packets | Discarded packets |
| A | 0 | 13130 | 2 |
| B | 0 | 13673 | 1 |
| C | 0 | 12974 | 1 |
| D | 0 | 18810 | 1 |
| Mode M9 | |||
|---|---|---|---|
| Quadrant | BADHDUFLAG | Total packets | Discarded packets |
| A | 0 | 13 | 0 |
| B | 0 | 13 | 0 |
| C | 0 | 13 | 0 |
| D | 0 | 13 | 0 |
| Quadrant | Total seconds | Saturated seconds | Saturation percentage |
|---|---|---|---|
| A | 5977 | 109 | 1.823657% |
| B | 5977 | 134 | 2.241927% |
| C | 5977 | 85 | 1.422118% |
| D | 5977 | 711 | 11.895600% |
Noise dominated data is calculated using 1-second bins in cleaned event files. If a bin has >2000 counts, and if more than 50% of those come from <1% of pixels, then it is considered to be noise-dominated and hence unusable.
| Quadrant | # 1 sec bins | Bins with >0 counts | Bins with >2000 counts | High rate bins dominated by noise | Noise dominated (total time) | Noise dominated (detector-on time) | Marked lightcurve |
|---|---|---|---|---|---|---|---|
| A | 7248 | 5979 | 6 | 6 | 0.08% | 0.10% | 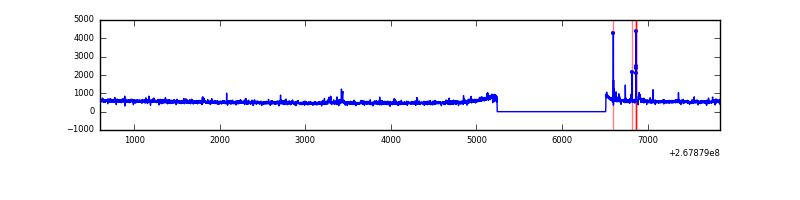 |
| B | 7248 | 5979 | 24 | 24 | 0.33% | 0.40% | 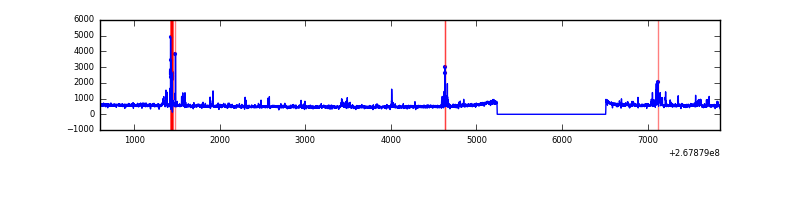 |
| C | 7248 | 5979 | 2 | 2 | 0.03% | 0.03% | 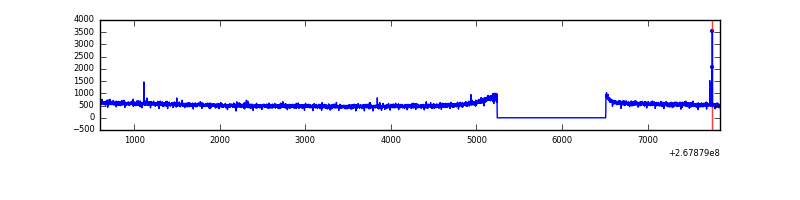 |
| D | 7248 | 5979 | 529 | 529 | 7.30% | 8.85% | 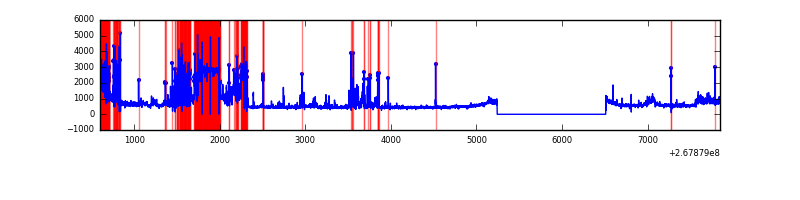 |
Top three noisy pixels from each quadrant. If the there are fewer than three noisy pixels in the level2.evt file, extra rows are filled as -1
| Pixel properties | Quadrant properties | ||||||
|---|---|---|---|---|---|---|---|
| Quadrant | DetID | PixID | Counts | Sigma | Mean | Median | Sigma |
| A | 12 | 189 | 78589 | 484.04 | 800 | 787 | 160.7 |
| A | 4 | 2 | 41727 | 254.7 | 800 | 787 | 160.7 |
| A | 15 | 239 | 14583 | 85.83 | 800 | 787 | 160.7 |
| B | 4 | 48 | 67639 | 451.39 | 780 | 762 | 148.2 |
| B | 0 | 189 | 67624 | 451.29 | 780 | 762 | 148.2 |
| B | 3 | 64 | 61159 | 407.65 | 780 | 762 | 148.2 |
| C | 3 | 233 | 186564 | 1074.28 | 760 | 767 | 172.9 |
| C | 0 | 207 | 8850 | 46.74 | 760 | 767 | 172.9 |
| C | 7 | 220 | 7453 | 38.66 | 760 | 767 | 172.9 |
| D | 7 | 254 | 1659724 | 9386.25 | 724 | 705 | 176.7 |
| D | 13 | 104 | 504105 | 2848.09 | 724 | 705 | 176.7 |
| D | 7 | 38 | 38940 | 216.32 | 724 | 705 | 176.7 |
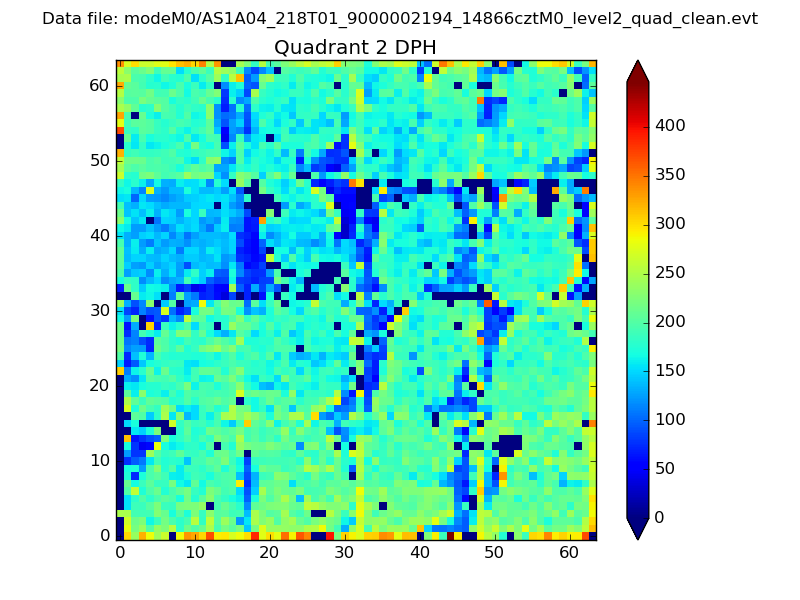
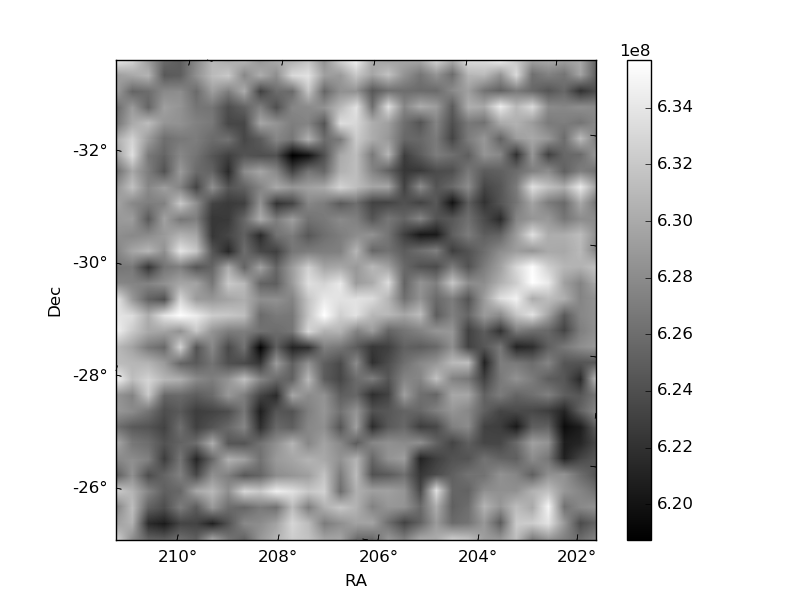
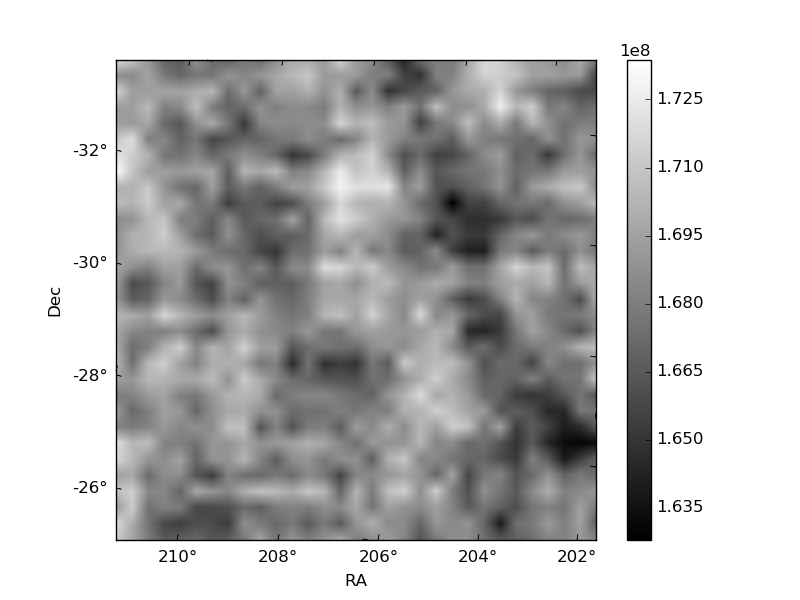
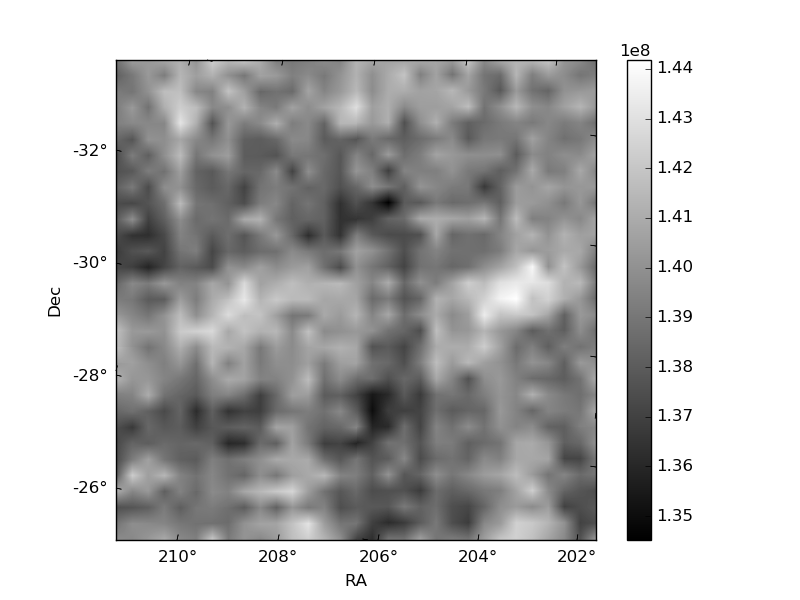
Histogram calculated using DETX and DETY for each event in the final _common_clean file
| Quadrant A | 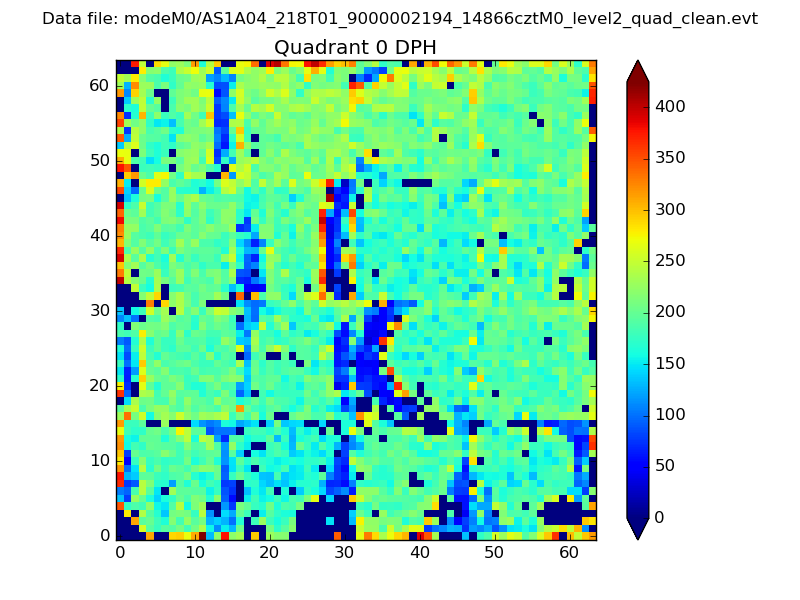 |
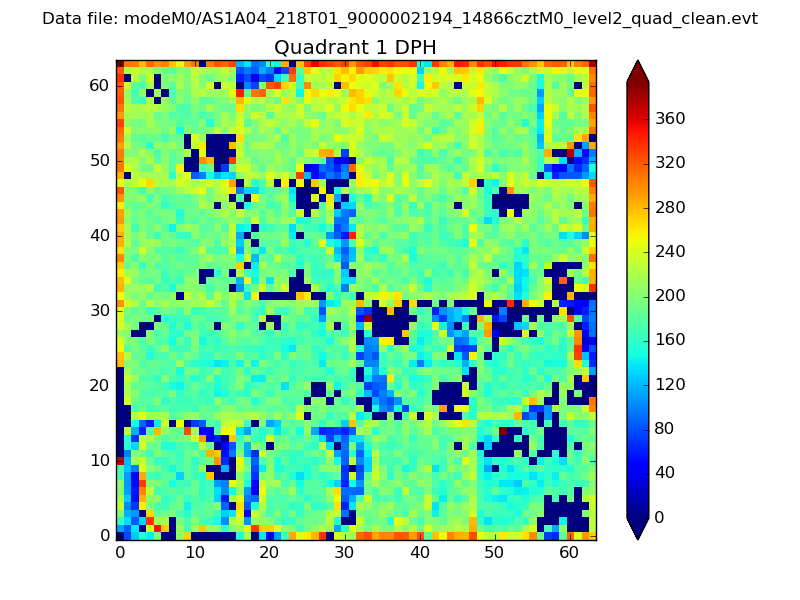 |
Quadrant B |
|---|---|---|---|
| Quadrant D | 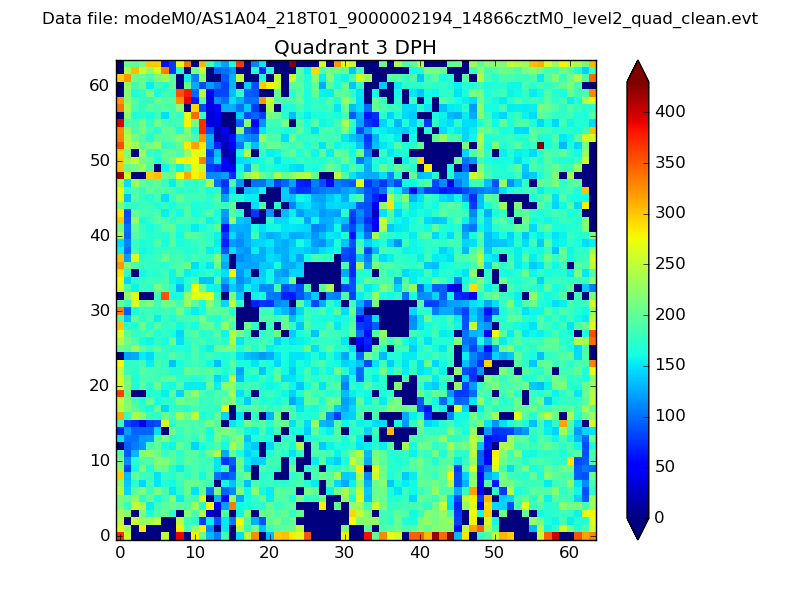 |
 |
Quadrant C |
| Plot type | Count rate plots | Images |
|---|---|---|
| Comparison with Poisson distribution Blue bars denote a histogram of data divided into 1 sec bins. Red curve is a Poisson curve with rate = median count rate of data. |
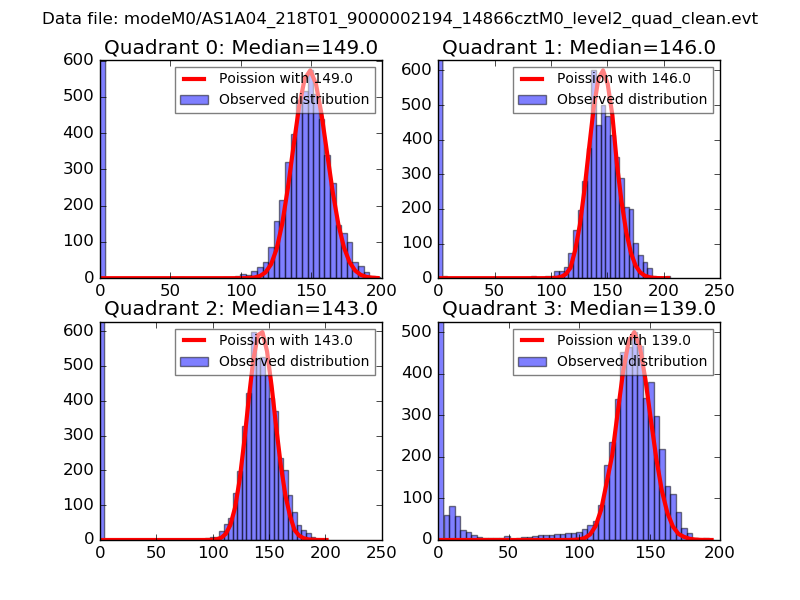 |
 |
| Quadrant-wise count rates Data is divided into 100 sec bins |
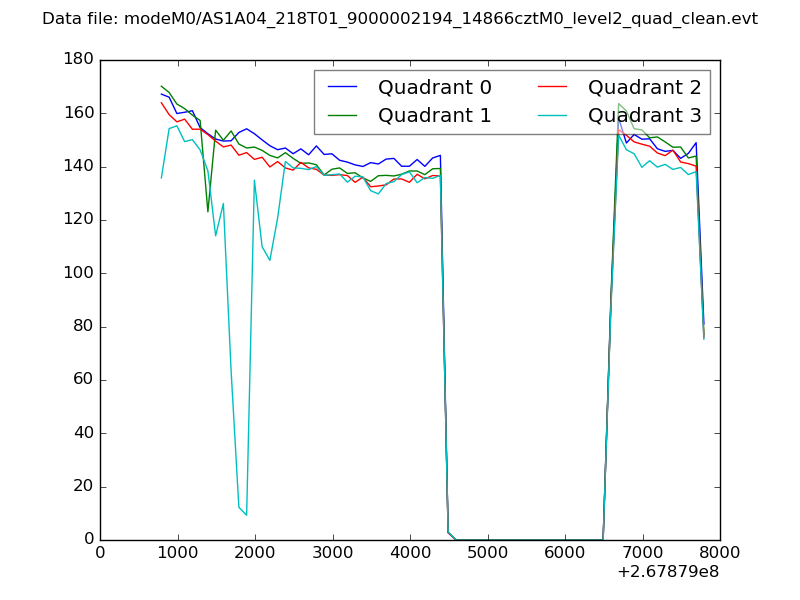 |
|
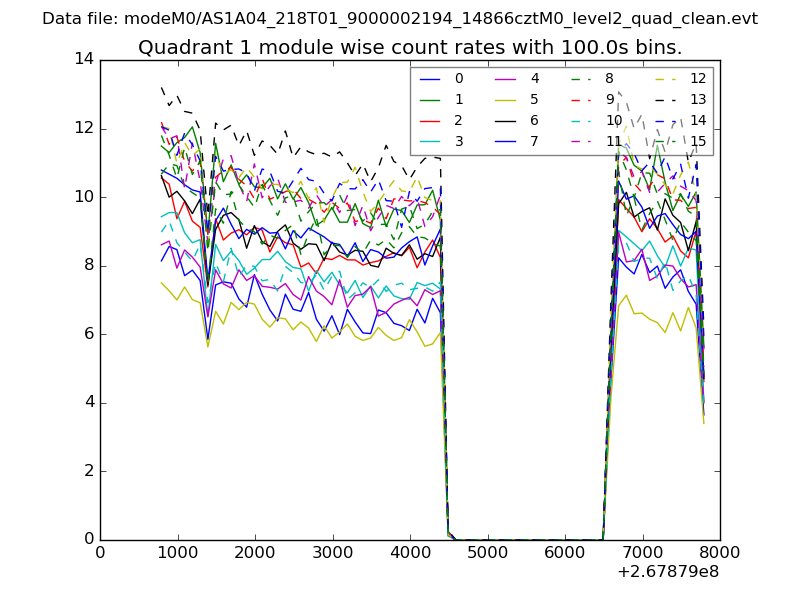
| Module-wise count rates for Quadrant A Data is divided into 100 sec bins |
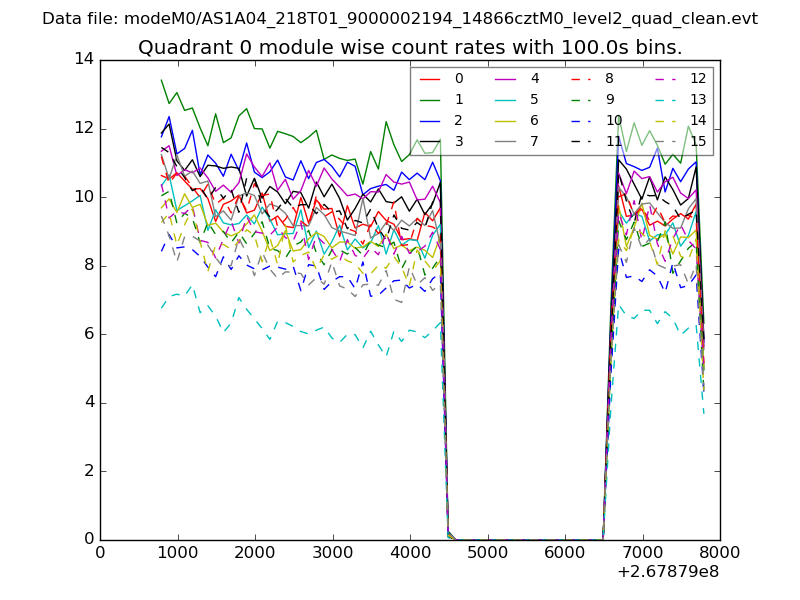 |
 |
| Module-wise count rates for Quadrant B Data is divided into 100 sec bins |
 |
 |
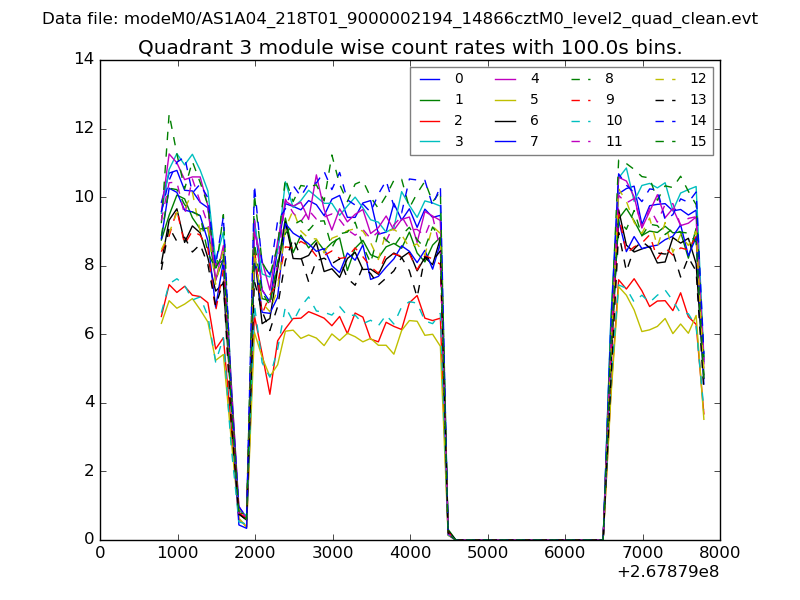
| Module-wise count rates for Quadrant C Data is divided into 100 sec bins |
 |
 |
| Module-wise count rates for Quadrant D Data is divided into 100 sec bins |
 |
 |
| Parameter | Plot |
|---|---|
| CZT HV Monitor |  |
| D_VDD | 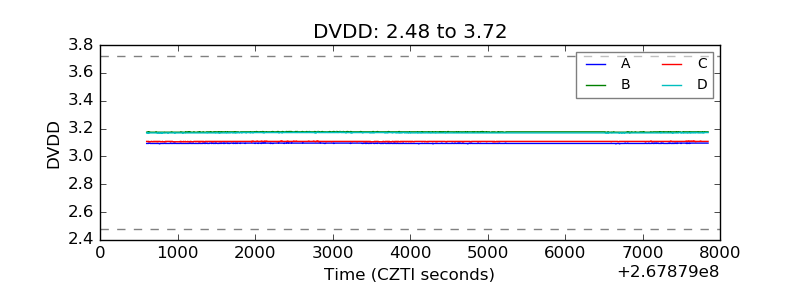 |
| Temperature 1 | 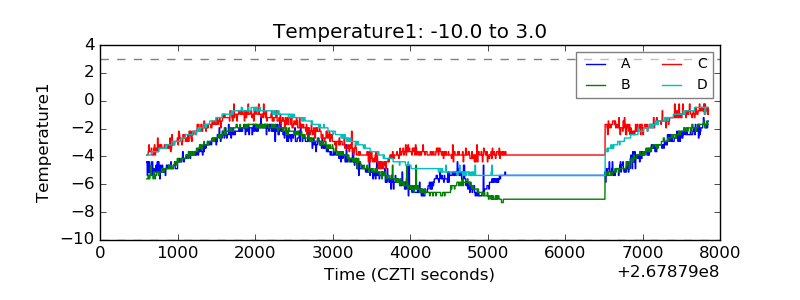 |
| Veto HV Monitor | 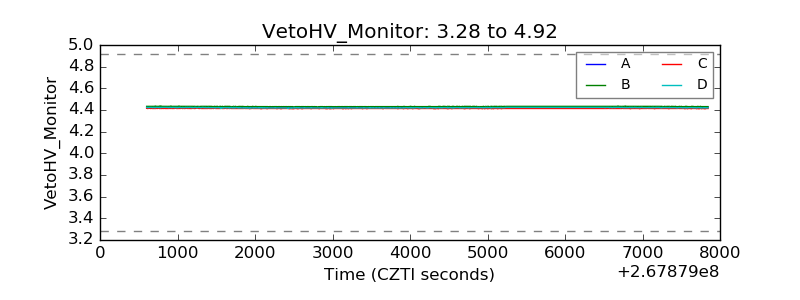 |
| Veto LLD | 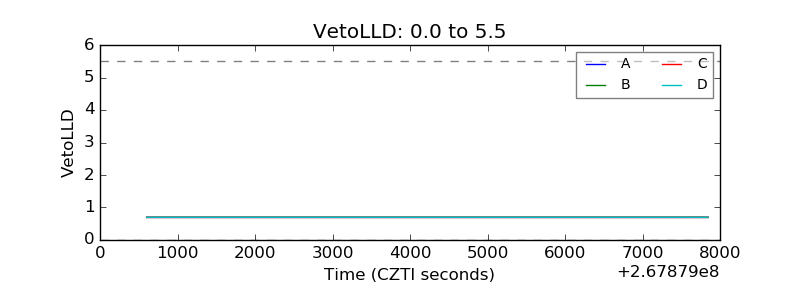 |
| Alpha Counter | 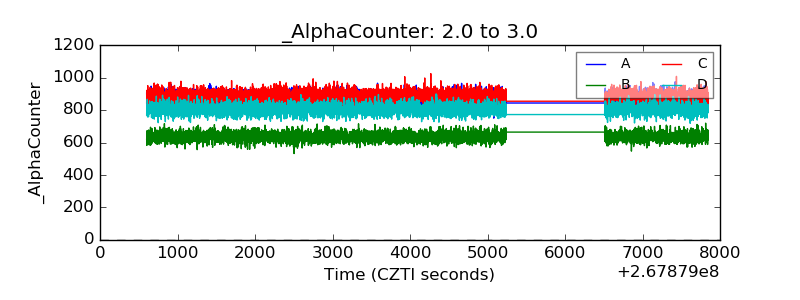 |
| _CPM_Rate | 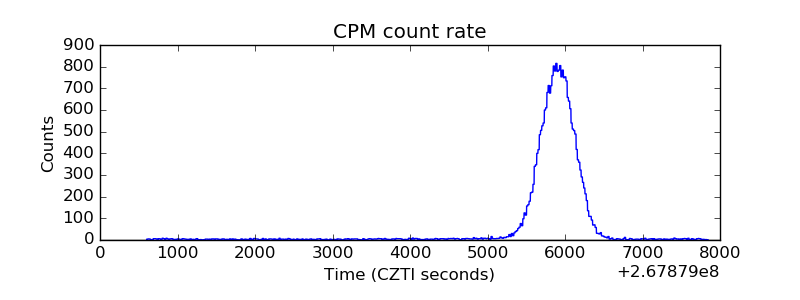 |
| CZT Counter | 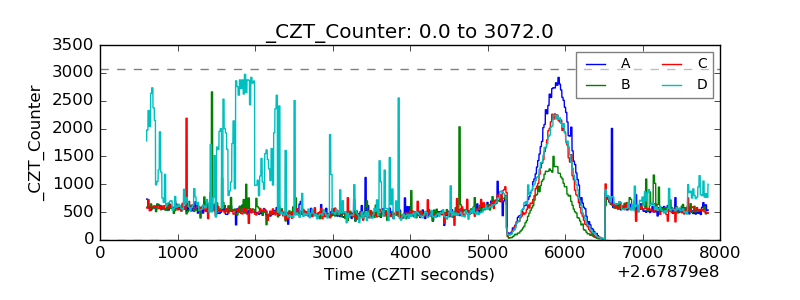 |
| +2.5 Volts monitor | 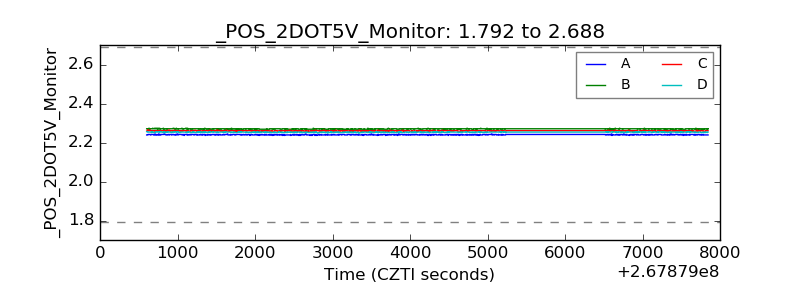 |
| +5 Volts monitor |  |
| _ROLL_ROT | 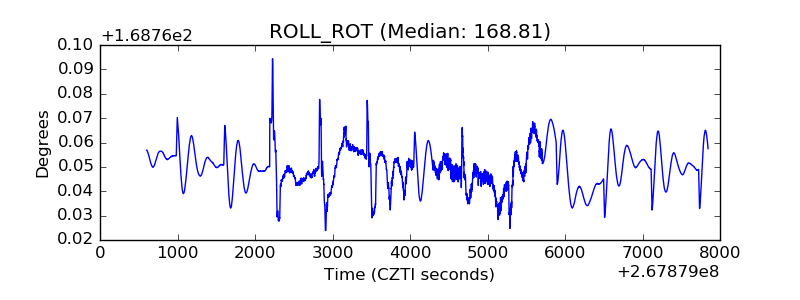 |
| _Roll_DEC | 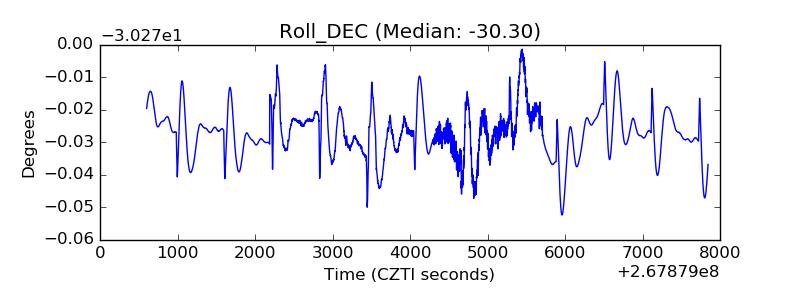 |
| _Roll_RA | 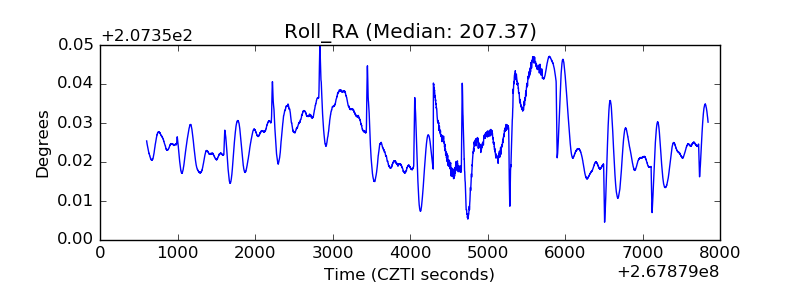 |
| Veto Counter |  |