| Param | Original file | Final file |
|---|---|---|
| Filename | modeM0/AS1A04_218T01_9000002194_14867cztM0_level2.evt | modeM0/AS1A04_218T01_9000002194_14867cztM0_level2_quad_clean.evt |
| Size (bytes) | 516,579,840 | 109,512,000 |
| Size | 492.6 MB | 104.4 MB |
| Events in quadrant A | 3,396,673 | 734,436 |
| Events in quadrant B | 3,632,715 | 724,453 |
| Events in quadrant C | 3,342,617 | 710,884 |
| Events in quadrant D | 4,826,328 | 687,785 |
| Mode SS | |||
|---|---|---|---|
| Quadrant | BADHDUFLAG | Total packets | Discarded packets |
| A | 0 | 134 | 0 |
| B | 0 | 134 | 0 |
| C | 0 | 134 | 0 |
| D | 0 | 134 | 0 |
| Mode M0 | |||
|---|---|---|---|
| Quadrant | BADHDUFLAG | Total packets | Discarded packets |
| A | 0 | 13992 | 2 |
| B | 0 | 14983 | 1 |
| C | 0 | 13885 | 1 |
| D | 0 | 18675 | 1 |
| Mode M9 | |||
|---|---|---|---|
| Quadrant | BADHDUFLAG | Total packets | Discarded packets |
| A | 0 | 10 | 0 |
| B | 0 | 10 | 0 |
| C | 0 | 10 | 0 |
| D | 0 | 10 | 0 |
| Quadrant | Total seconds | Saturated seconds | Saturation percentage |
|---|---|---|---|
| A | 6583 | 98 | 1.488683% |
| B | 6583 | 103 | 1.564636% |
| C | 6583 | 57 | 0.865867% |
| D | 6583 | 213 | 3.235607% |
Noise dominated data is calculated using 1-second bins in cleaned event files. If a bin has >2000 counts, and if more than 50% of those come from <1% of pixels, then it is considered to be noise-dominated and hence unusable.
| Quadrant | # 1 sec bins | Bins with >0 counts | Bins with >2000 counts | High rate bins dominated by noise | Noise dominated (total time) | Noise dominated (detector-on time) | Marked lightcurve |
|---|---|---|---|---|---|---|---|
| A | 7609 | 6585 | 6 | 6 | 0.08% | 0.09% | 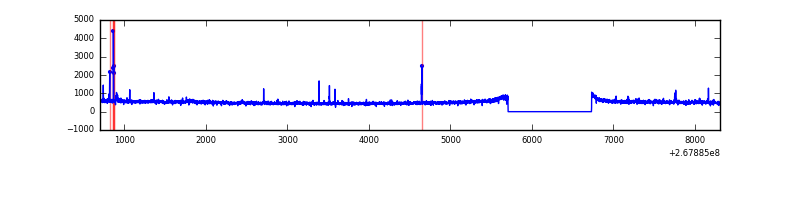 |
| B | 7609 | 6585 | 7 | 7 | 0.09% | 0.11% | 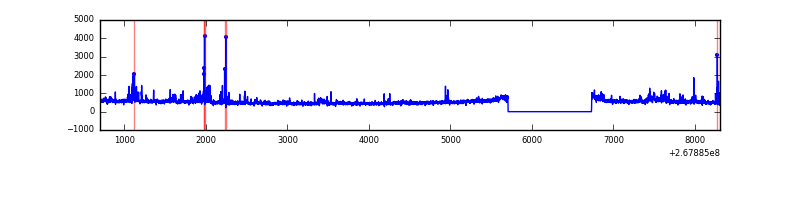 |
| C | 7609 | 6585 | 2 | 2 | 0.03% | 0.03% | 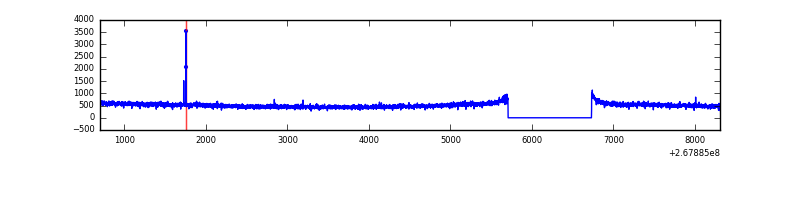 |
| D | 7609 | 6585 | 137 | 137 | 1.80% | 2.08% | 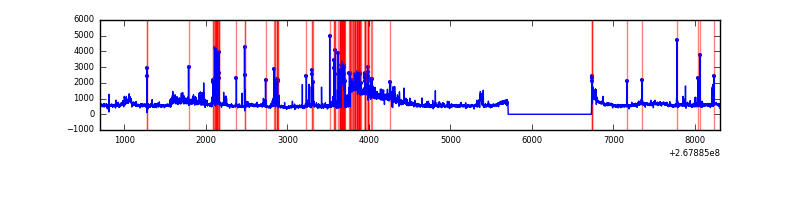 |
Top three noisy pixels from each quadrant. If the there are fewer than three noisy pixels in the level2.evt file, extra rows are filled as -1
| Pixel properties | Quadrant properties | ||||||
|---|---|---|---|---|---|---|---|
| Quadrant | DetID | PixID | Counts | Sigma | Mean | Median | Sigma |
| A | 12 | 189 | 51489 | 298.02 | 843 | 827 | 170.0 |
| A | 15 | 239 | 51093 | 295.69 | 843 | 827 | 170.0 |
| A | 4 | 2 | 40065 | 230.81 | 843 | 827 | 170.0 |
| B | 0 | 219 | 157358 | 1000.19 | 827 | 809 | 156.5 |
| B | 0 | 189 | 54032 | 340.04 | 827 | 809 | 156.5 |
| B | 5 | 236 | 31064 | 193.3 | 827 | 809 | 156.5 |
| C | 3 | 233 | 210972 | 1137.48 | 801 | 805 | 184.8 |
| C | 0 | 207 | 10173 | 50.7 | 801 | 805 | 184.8 |
| C | 13 | 61 | 5765 | 26.84 | 801 | 805 | 184.8 |
| D | 7 | 254 | 978025 | 4730.75 | 807 | 788 | 206.6 |
| D | 13 | 104 | 515897 | 2493.61 | 807 | 788 | 206.6 |
| D | 7 | 38 | 168773 | 813.2 | 807 | 788 | 206.6 |
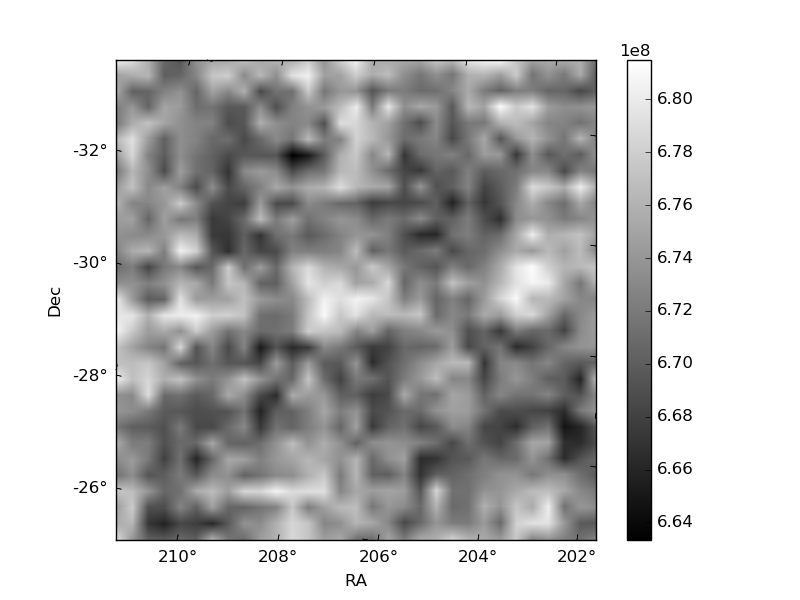
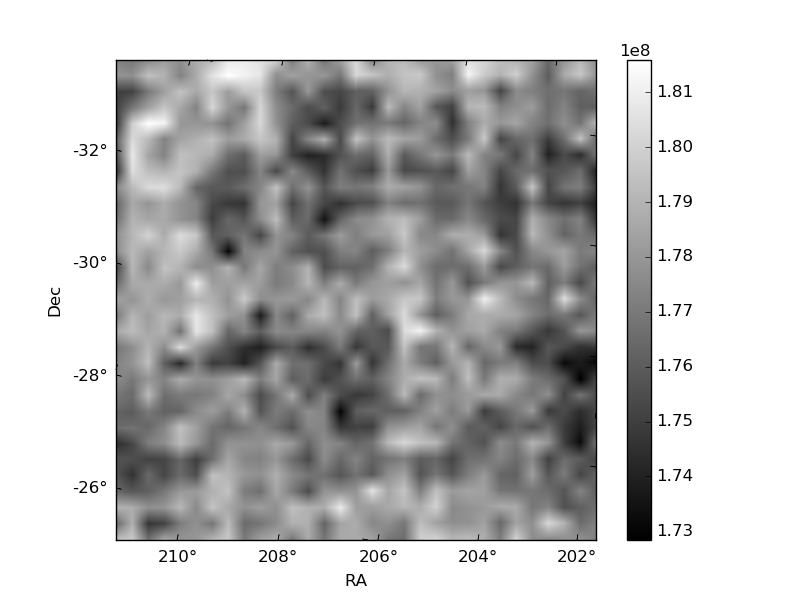
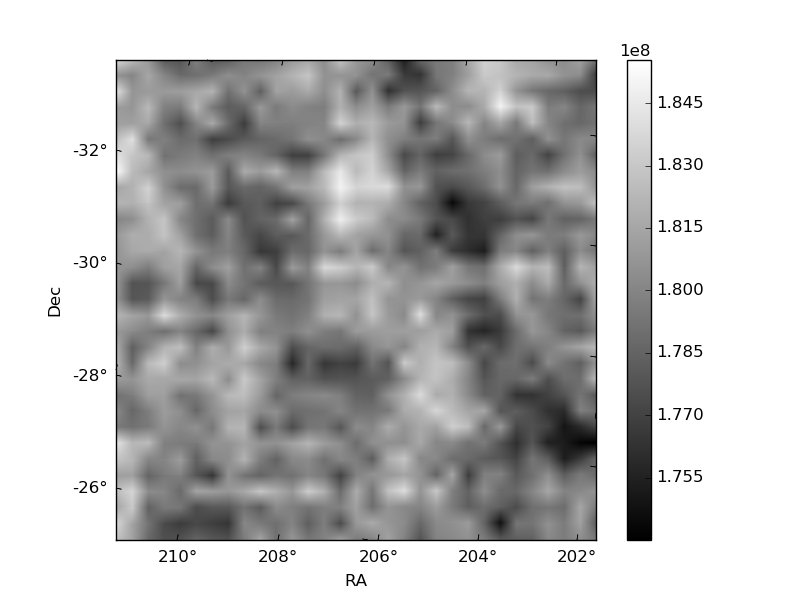
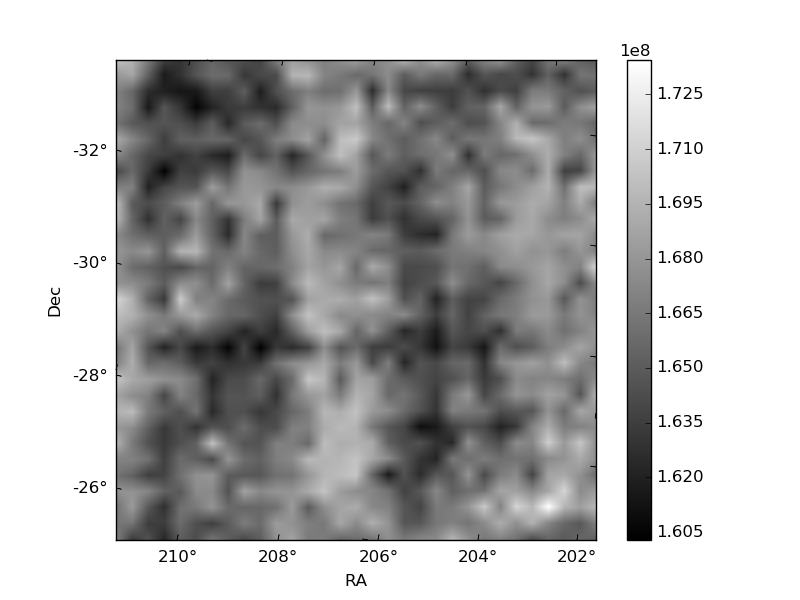
Histogram calculated using DETX and DETY for each event in the final _common_clean file
| Quadrant A | 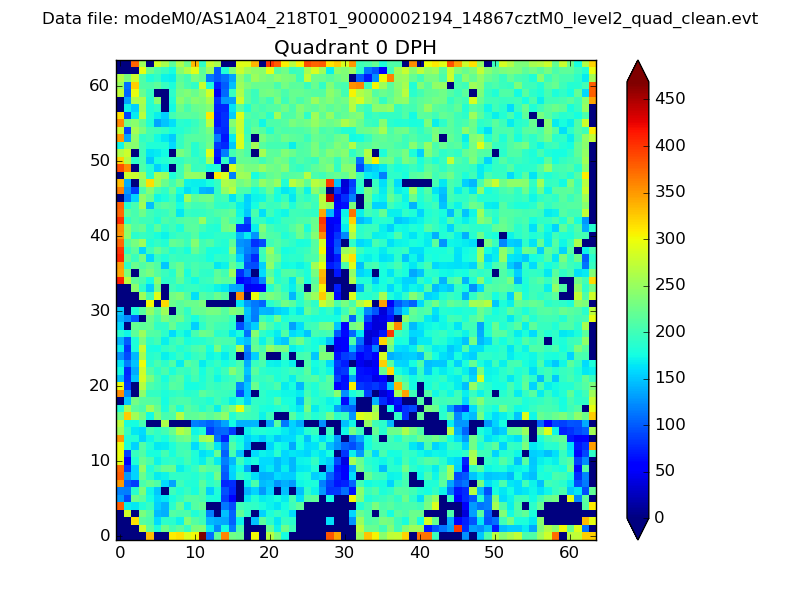 |
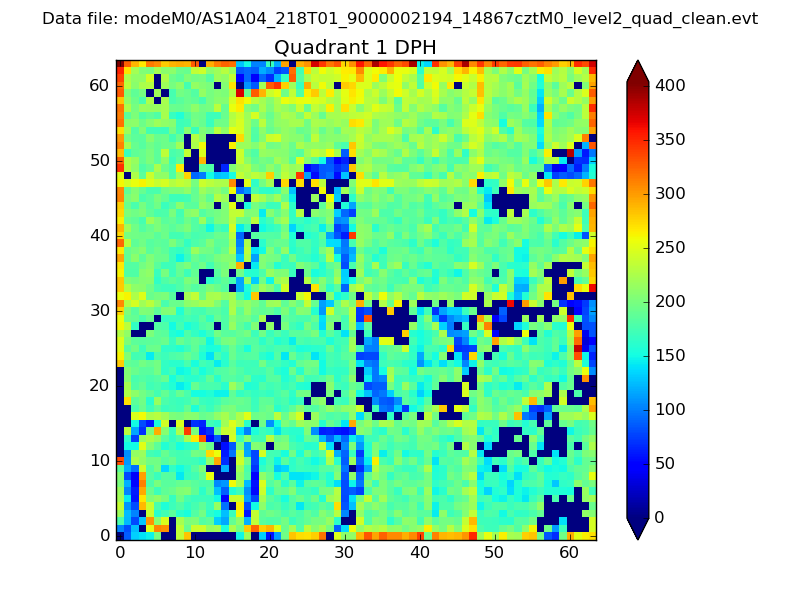 |
Quadrant B |
|---|---|---|---|
| Quadrant D | 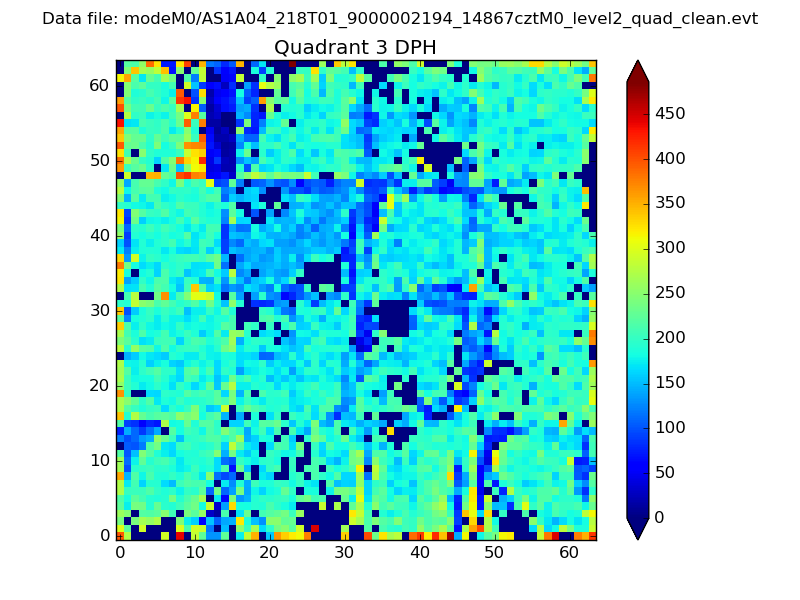 |
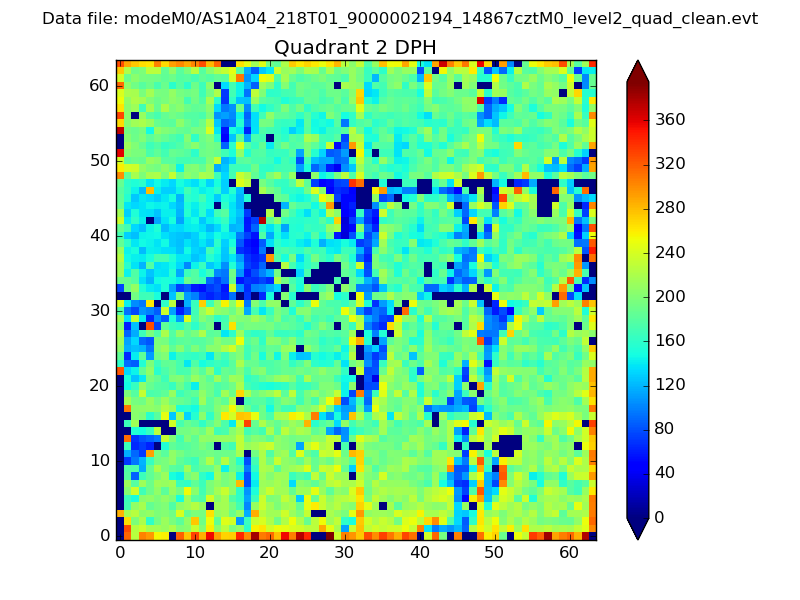 |
Quadrant C |
| Plot type | Count rate plots | Images |
|---|---|---|
| Comparison with Poisson distribution Blue bars denote a histogram of data divided into 1 sec bins. Red curve is a Poisson curve with rate = median count rate of data. |
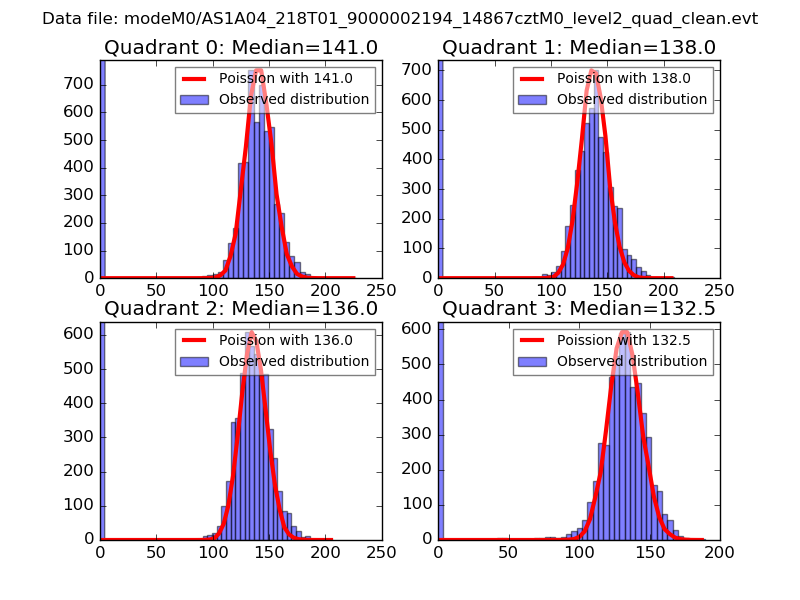 |
 |
| Quadrant-wise count rates Data is divided into 100 sec bins |
 |
|
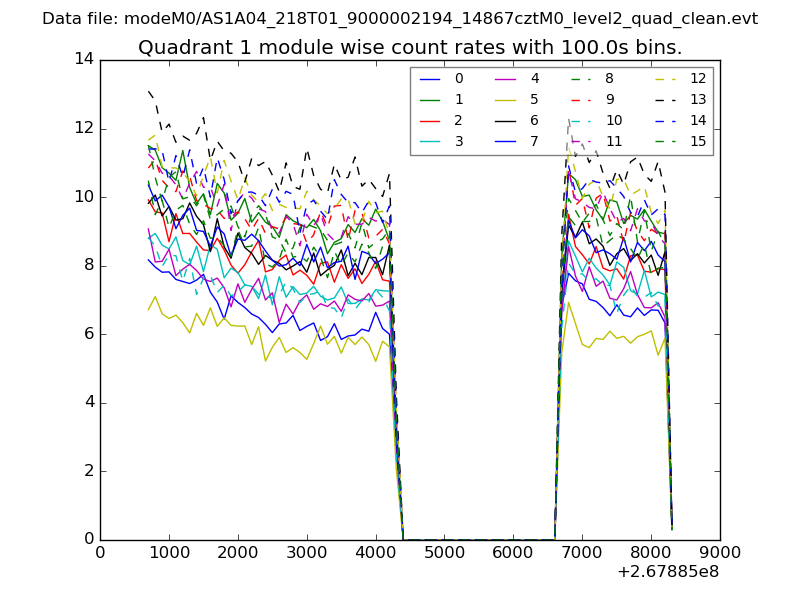
| Module-wise count rates for Quadrant A Data is divided into 100 sec bins |
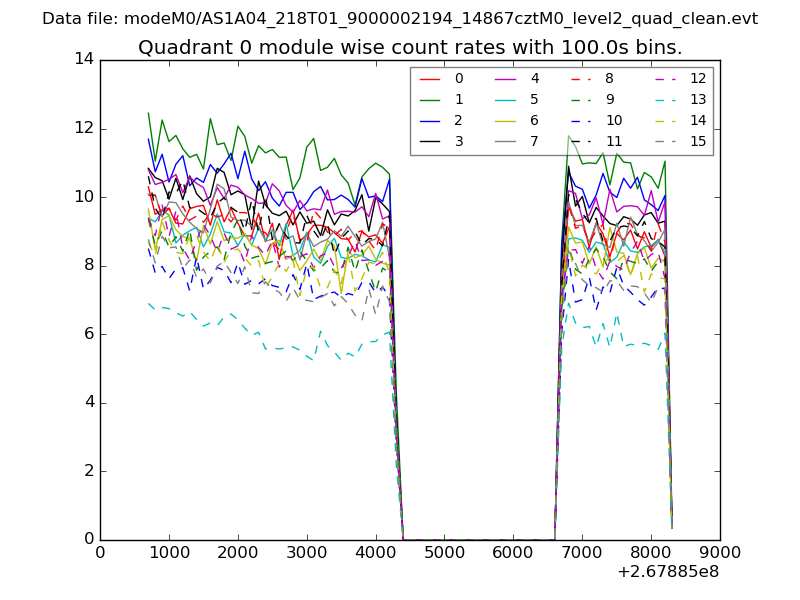 |
 |
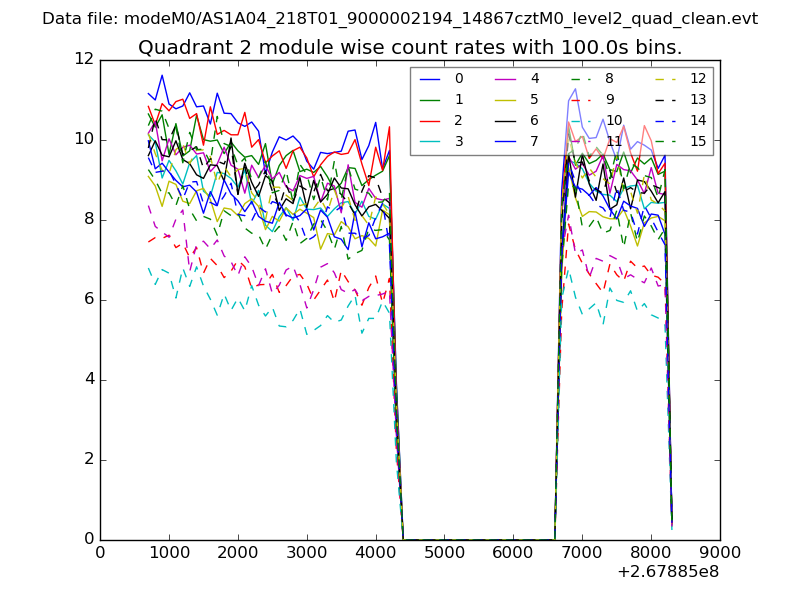
| Module-wise count rates for Quadrant B Data is divided into 100 sec bins |
 |
 |
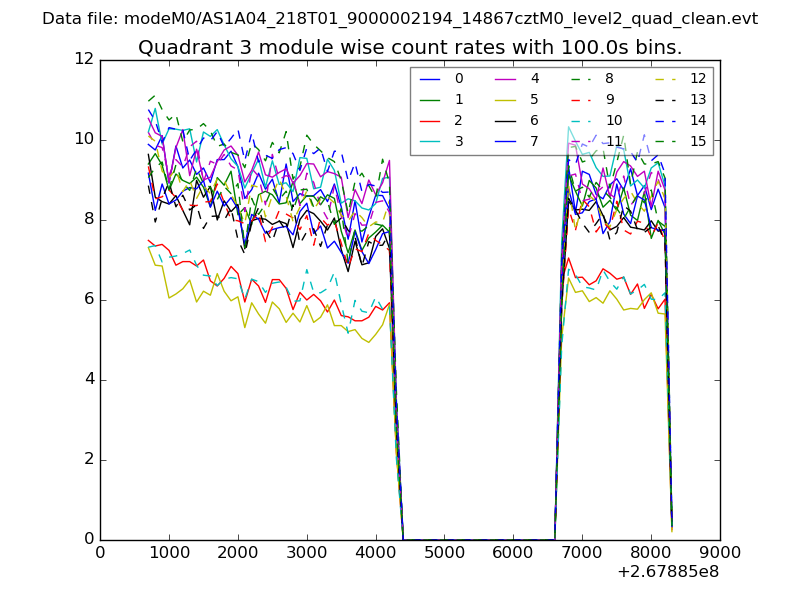
| Module-wise count rates for Quadrant C Data is divided into 100 sec bins |
 |
 |
| Module-wise count rates for Quadrant D Data is divided into 100 sec bins |
 |
 |
| Parameter | Plot |
|---|---|
| CZT HV Monitor |  |
| D_VDD | 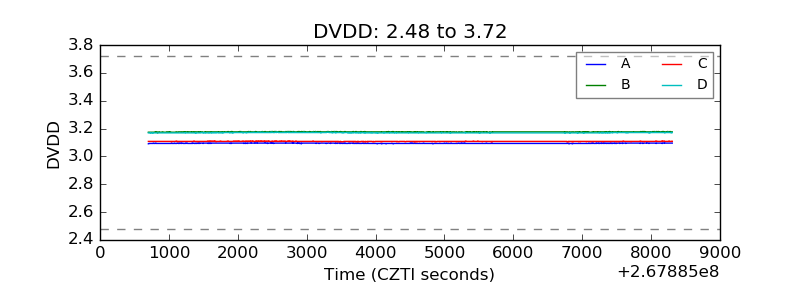 |
| Temperature 1 | 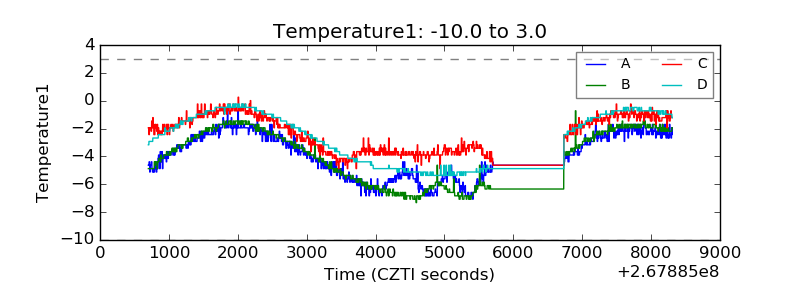 |
| Veto HV Monitor | 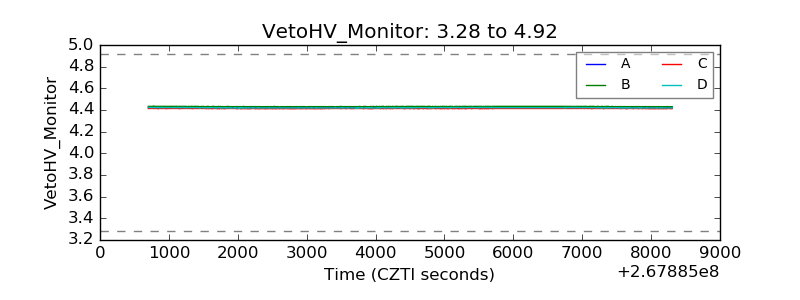 |
| Veto LLD | 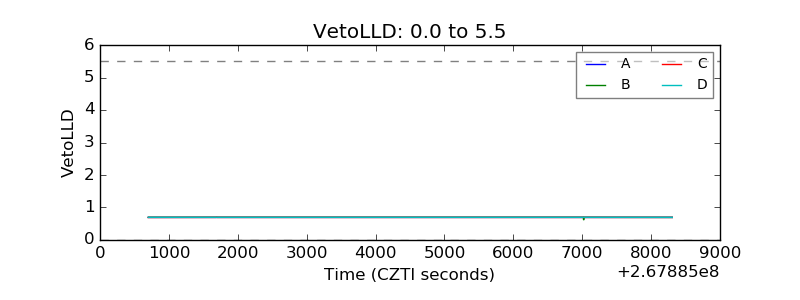 |
| Alpha Counter | 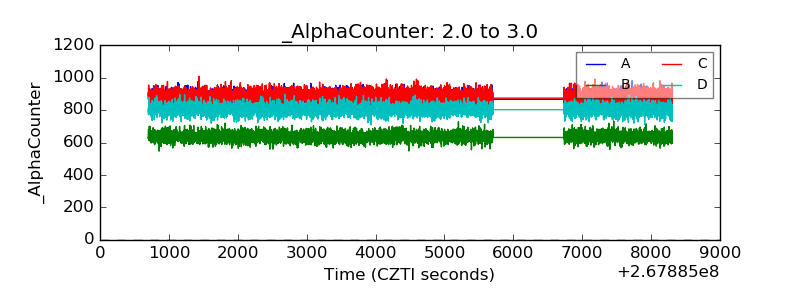 |
| _CPM_Rate | 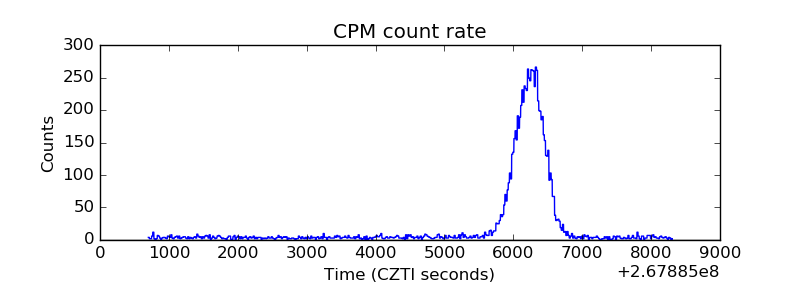 |
| CZT Counter | 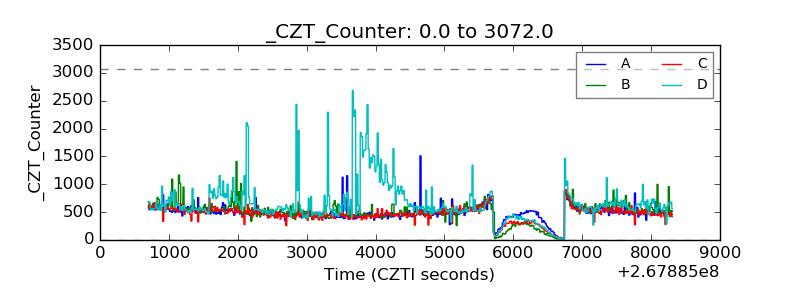 |
| +2.5 Volts monitor |  |
| +5 Volts monitor |  |
| _ROLL_ROT | 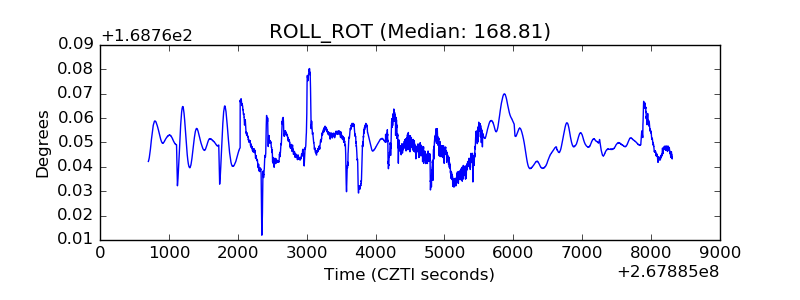 |
| _Roll_DEC | 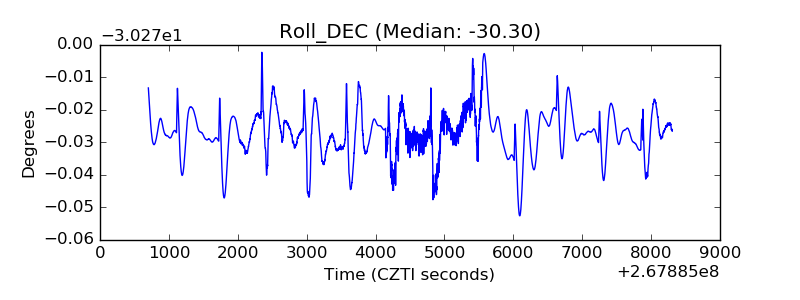 |
| _Roll_RA | 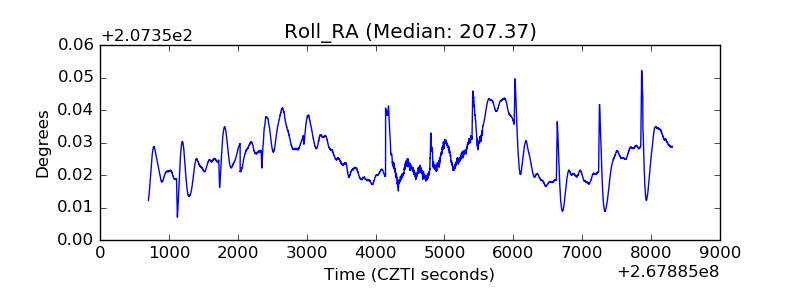 |
| Veto Counter | 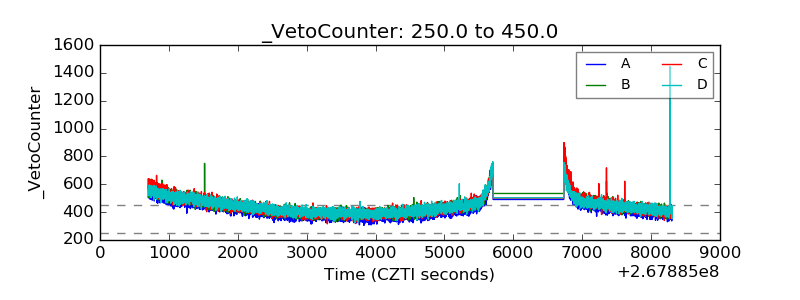 |