| Param | Original file | Final file |
|---|---|---|
| Filename | modeM0/AS1A04_218T01_9000002194_14868cztM0_level2.evt | modeM0/AS1A04_218T01_9000002194_14868cztM0_level2_quad_clean.evt |
| Size (bytes) | 194,644,800 | 51,693,120 |
| Size | 185.6 MB | 49.3 MB |
| Events in quadrant A | 1,337,421 | 353,411 |
| Events in quadrant B | 1,478,737 | 347,510 |
| Events in quadrant C | 1,294,641 | 343,293 |
| Events in quadrant D | 1,605,088 | 334,377 |
| Mode SS | |||
|---|---|---|---|
| Quadrant | BADHDUFLAG | Total packets | Discarded packets |
| A | 0 | 52 | 0 |
| B | 0 | 52 | 0 |
| C | 0 | 52 | 0 |
| D | 0 | 52 | 0 |
| Mode M0 | |||
|---|---|---|---|
| Quadrant | BADHDUFLAG | Total packets | Discarded packets |
| A | 0 | 5512 | 1 |
| B | 0 | 6039 | 1 |
| C | 0 | 5438 | 1 |
| D | 0 | 6512 | 1 |
| Quadrant | Total seconds | Saturated seconds | Saturation percentage |
|---|---|---|---|
| A | 2604 | 13 | 0.499232% |
| B | 2604 | 25 | 0.960061% |
| C | 2604 | 5 | 0.192012% |
| D | 2604 | 47 | 1.804916% |
Noise dominated data is calculated using 1-second bins in cleaned event files. If a bin has >2000 counts, and if more than 50% of those come from <1% of pixels, then it is considered to be noise-dominated and hence unusable.
| Quadrant | # 1 sec bins | Bins with >0 counts | Bins with >2000 counts | High rate bins dominated by noise | Noise dominated (total time) | Noise dominated (detector-on time) | Marked lightcurve |
|---|---|---|---|---|---|---|---|
| A | 2605 | 2605 | 0 | 0 | 0.00% | 0.00% | 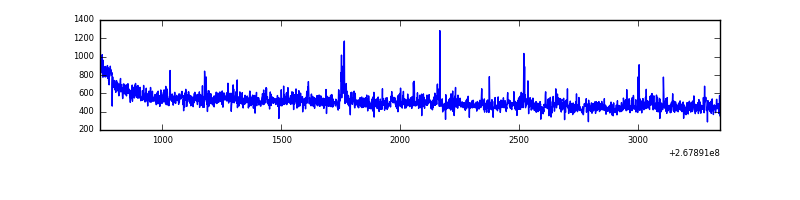 |
| B | 2605 | 2605 | 1 | 1 | 0.04% | 0.04% | 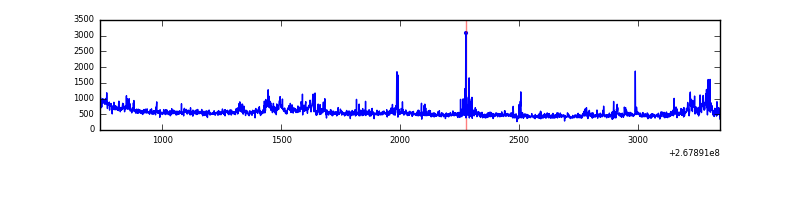 |
| C | 2605 | 2605 | 0 | 0 | 0.00% | 0.00% | 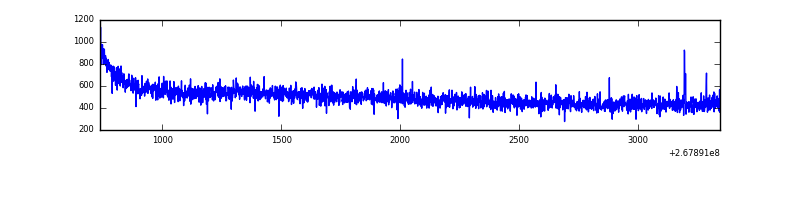 |
| D | 2605 | 2605 | 10 | 10 | 0.38% | 0.38% | 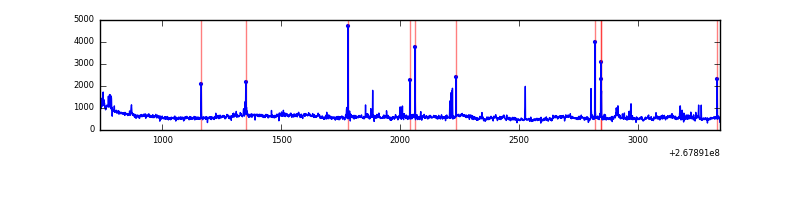 |
Top three noisy pixels from each quadrant. If the there are fewer than three noisy pixels in the level2.evt file, extra rows are filled as -1
| Pixel properties | Quadrant properties | ||||||
|---|---|---|---|---|---|---|---|
| Quadrant | DetID | PixID | Counts | Sigma | Mean | Median | Sigma |
| A | 15 | 239 | 41066 | 608.43 | 325 | 319 | 67.0 |
| A | 12 | 189 | 39287 | 581.87 | 325 | 319 | 67.0 |
| A | 0 | 226 | 2981 | 39.75 | 325 | 319 | 67.0 |
| B | 0 | 219 | 133299 | 2149.16 | 317 | 309 | 61.9 |
| B | 0 | 230 | 19592 | 311.62 | 317 | 309 | 61.9 |
| B | 5 | 236 | 19290 | 306.74 | 317 | 309 | 61.9 |
| C | 3 | 233 | 93511 | 1287.42 | 307 | 308 | 72.4 |
| C | 6 | 96 | 2387 | 28.72 | 307 | 308 | 72.4 |
| C | 13 | 61 | 2212 | 26.3 | 307 | 308 | 72.4 |
| D | 13 | 104 | 317810 | 3707.96 | 310 | 303 | 85.6 |
| D | 7 | 38 | 30917 | 357.52 | 310 | 303 | 85.6 |
| D | 2 | 120 | 28240 | 326.26 | 310 | 303 | 85.6 |
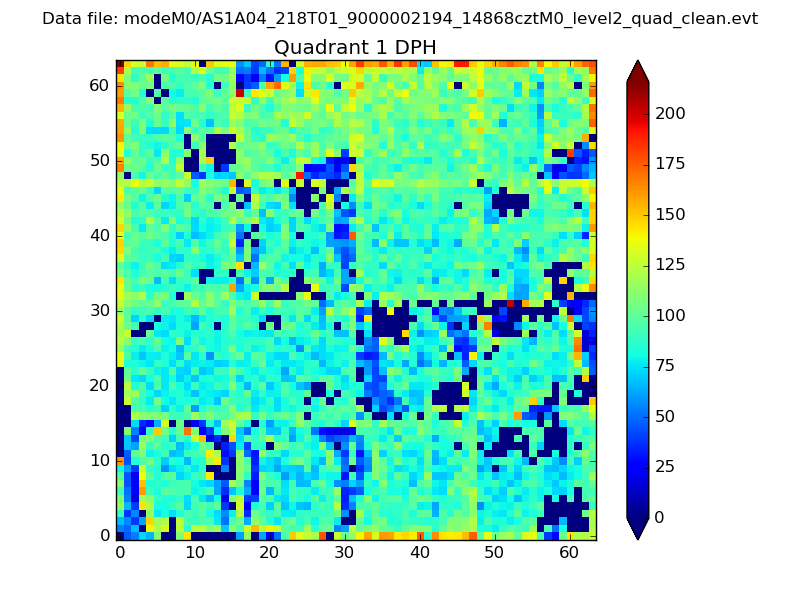
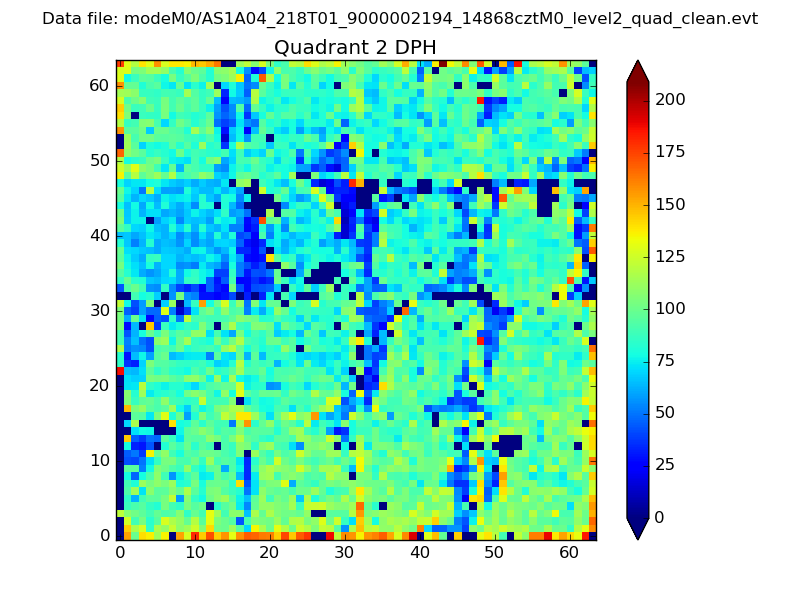
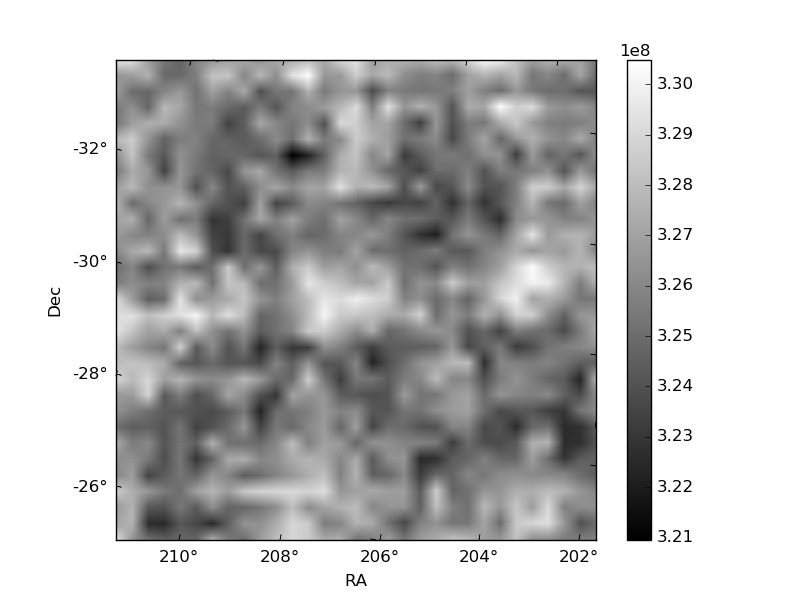
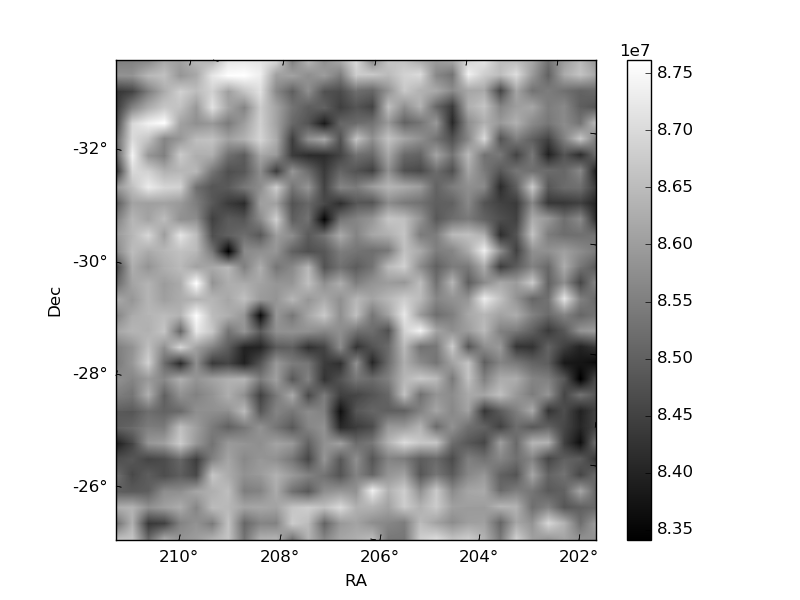
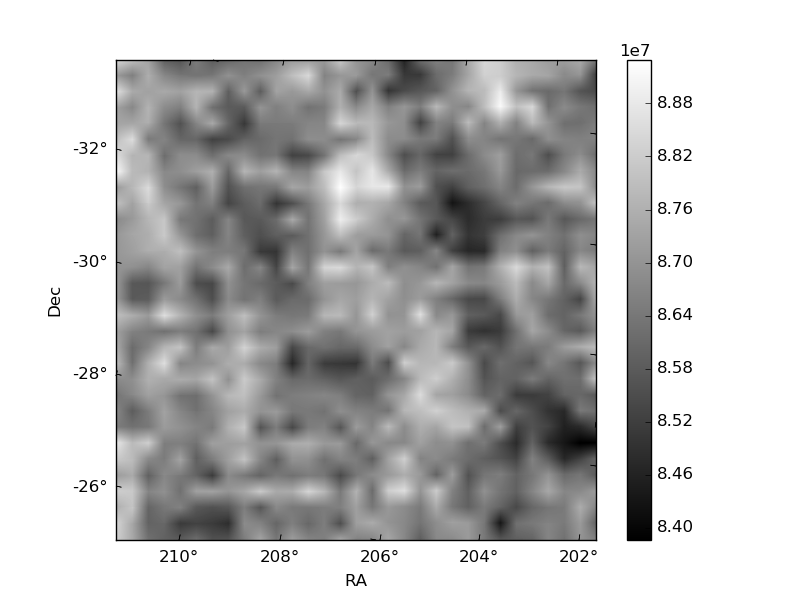
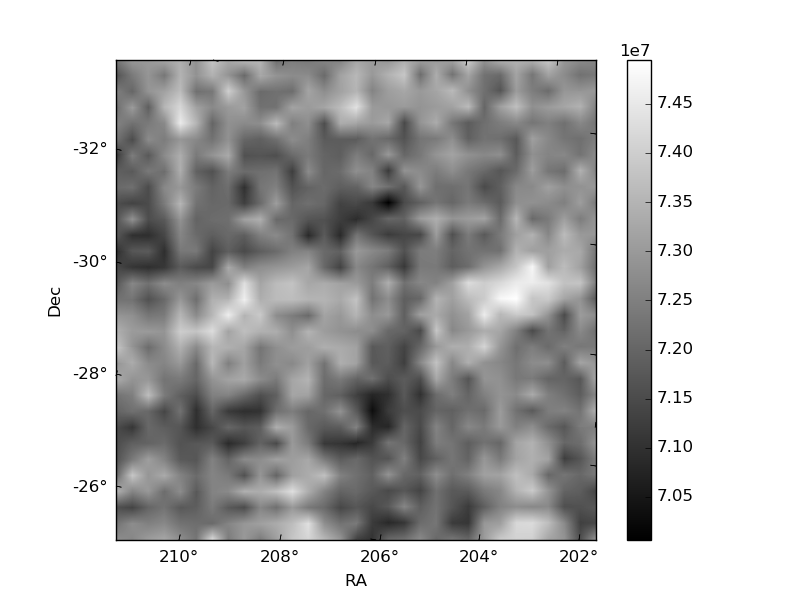
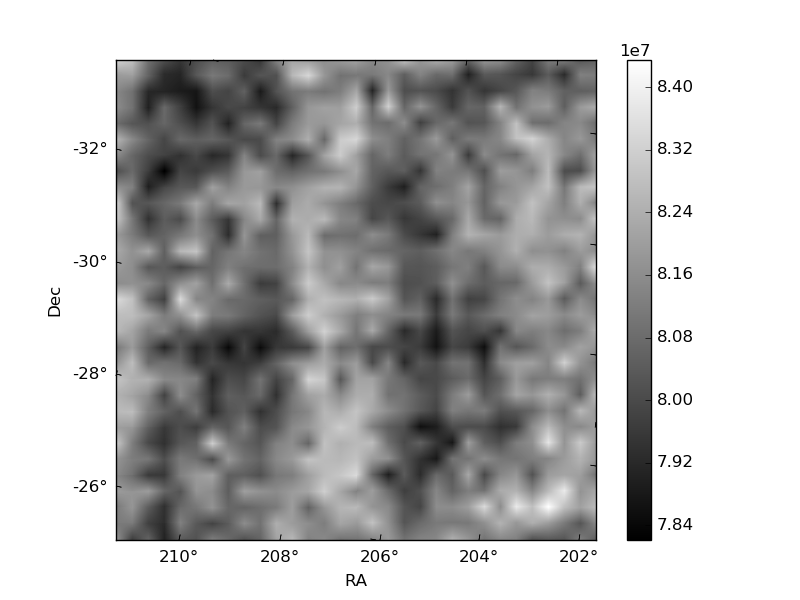
Histogram calculated using DETX and DETY for each event in the final _common_clean file
| Quadrant A |  |
 |
Quadrant B |
|---|---|---|---|
| Quadrant D | 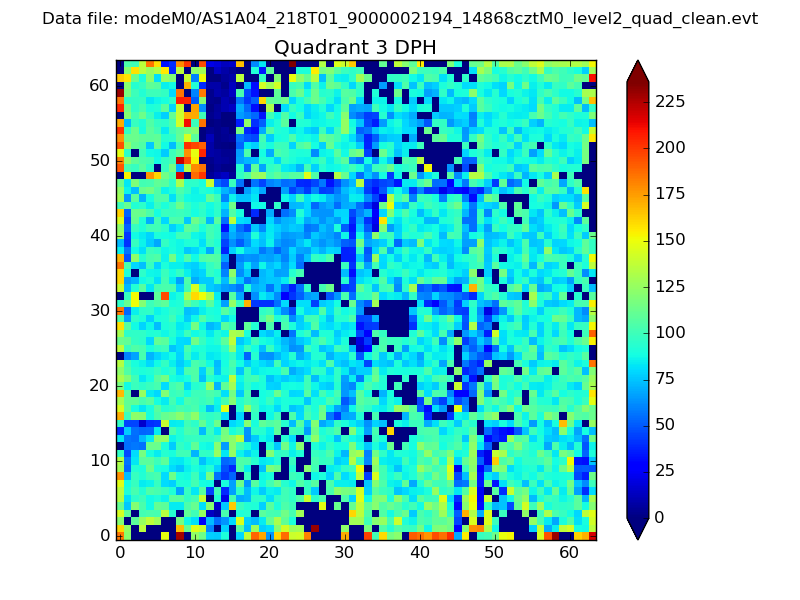 |
 |
Quadrant C |
| Plot type | Count rate plots | Images |
|---|---|---|
| Comparison with Poisson distribution Blue bars denote a histogram of data divided into 1 sec bins. Red curve is a Poisson curve with rate = median count rate of data. |
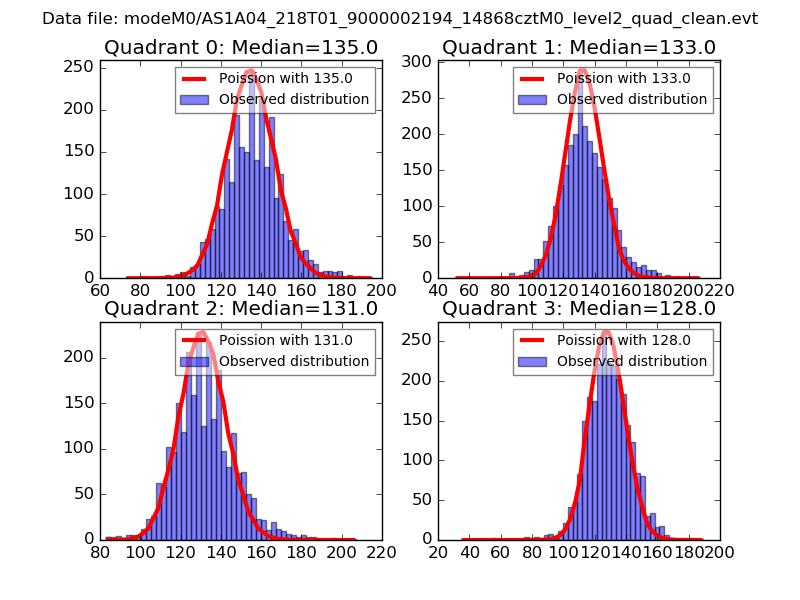 |
 |
| Quadrant-wise count rates Data is divided into 100 sec bins |
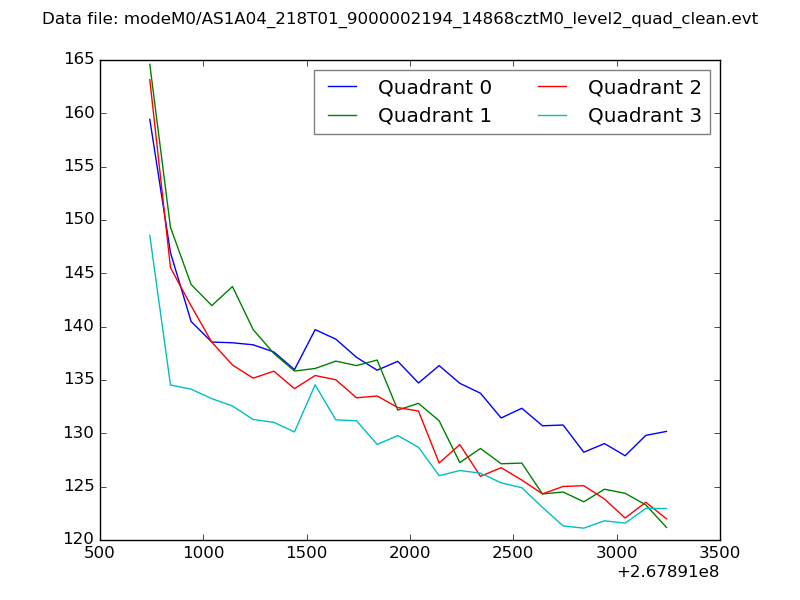 |
|
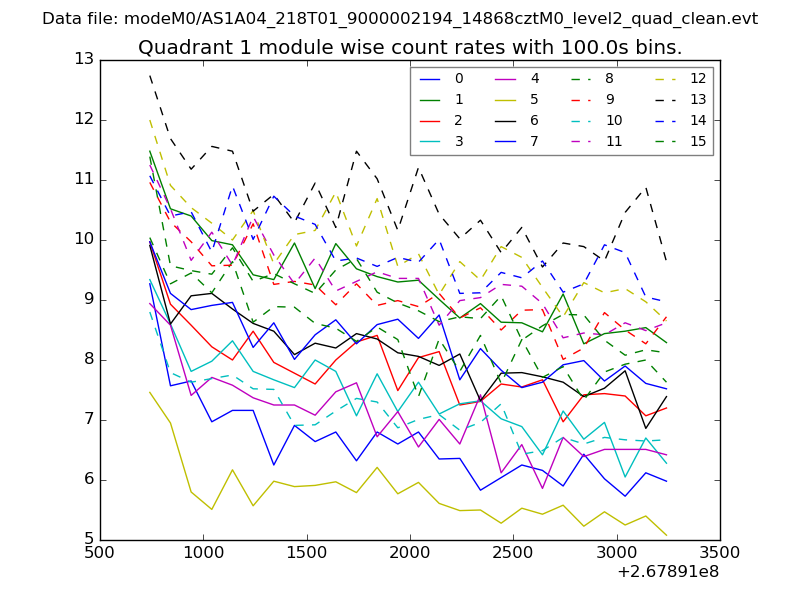
| Module-wise count rates for Quadrant A Data is divided into 100 sec bins |
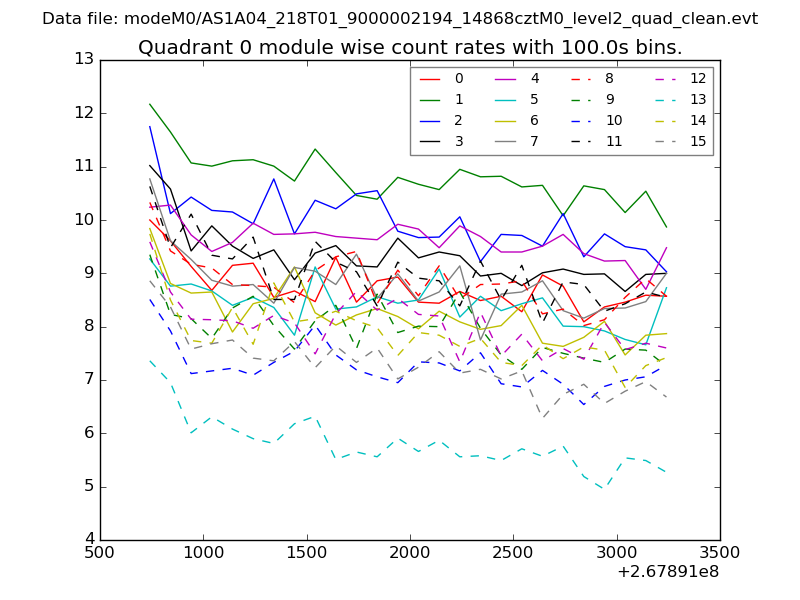 |
 |
| Module-wise count rates for Quadrant B Data is divided into 100 sec bins |
 |
 |
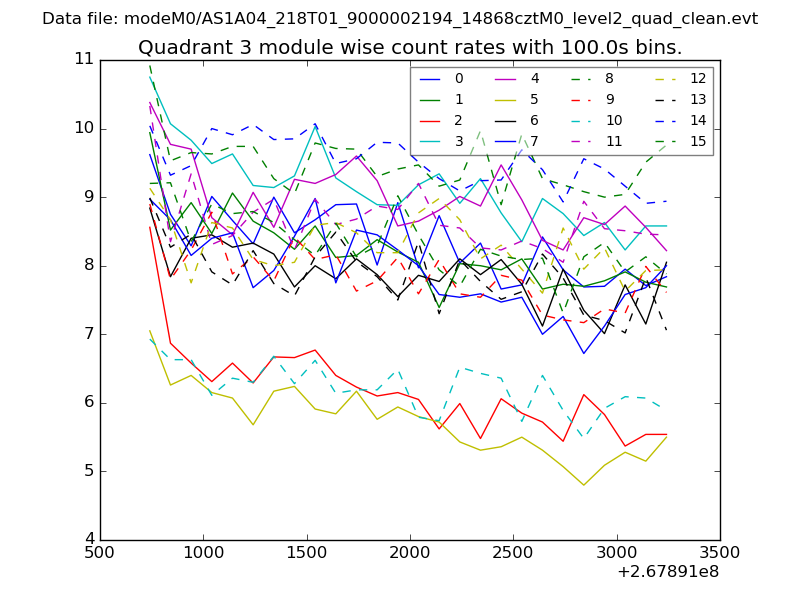
| Module-wise count rates for Quadrant C Data is divided into 100 sec bins |
 |
 |
| Module-wise count rates for Quadrant D Data is divided into 100 sec bins |
 |
 |
| Parameter | Plot |
|---|---|
| CZT HV Monitor | 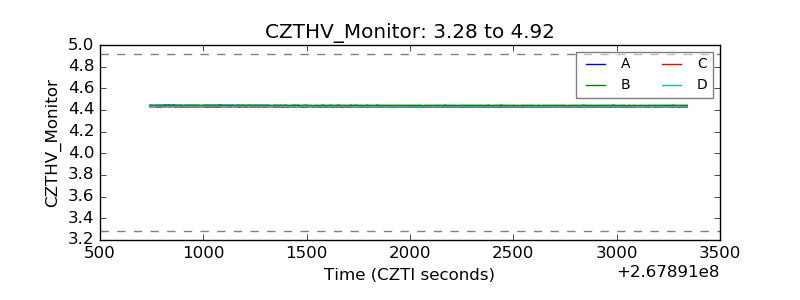 |
| D_VDD | 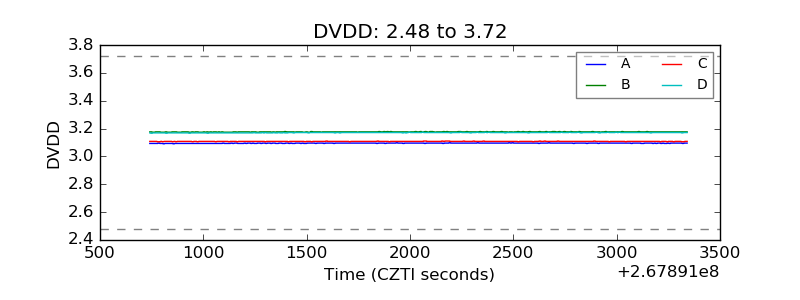 |
| Temperature 1 | 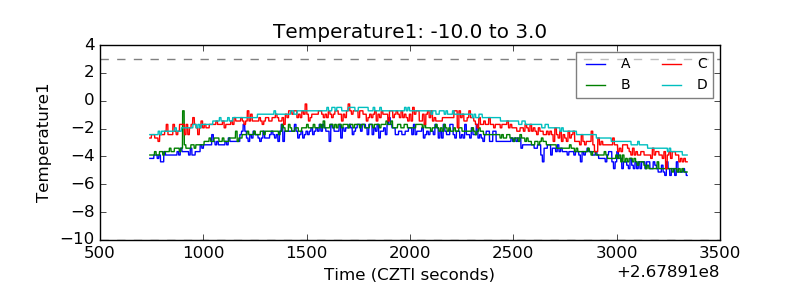 |
| Veto HV Monitor | 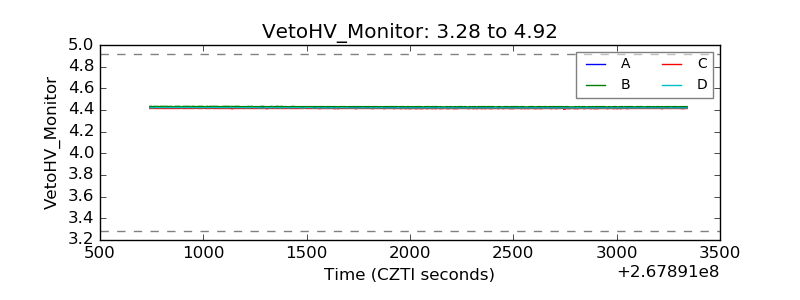 |
| Veto LLD | 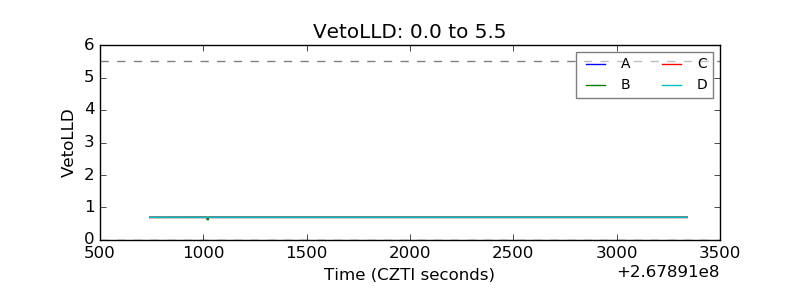 |
| Alpha Counter | 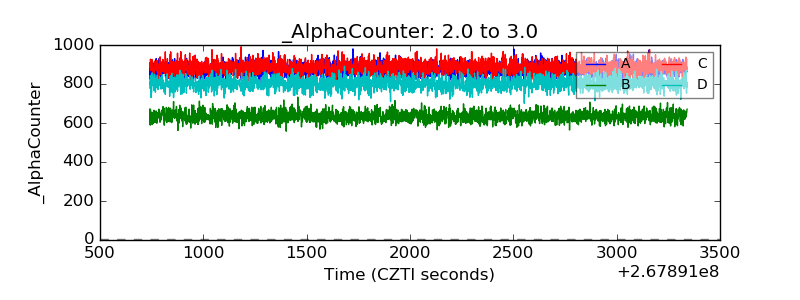 |
| _CPM_Rate | 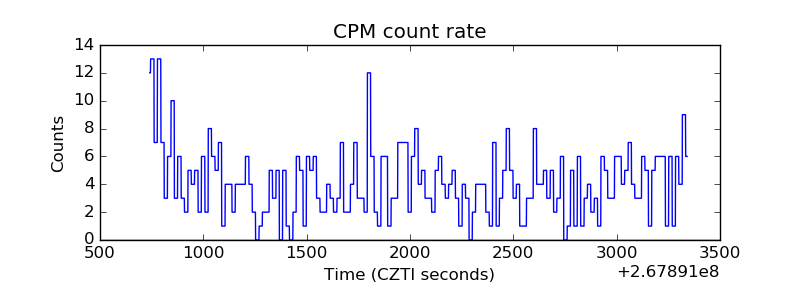 |
| CZT Counter | 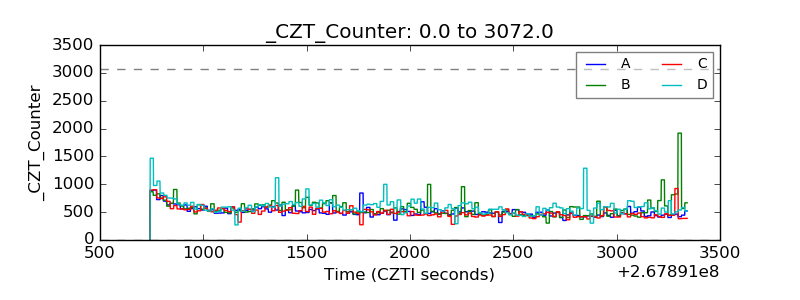 |
| +2.5 Volts monitor |  |
| +5 Volts monitor |  |
| _ROLL_ROT | 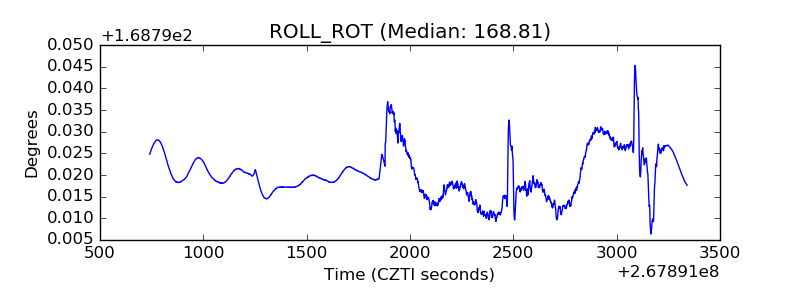 |
| _Roll_DEC | 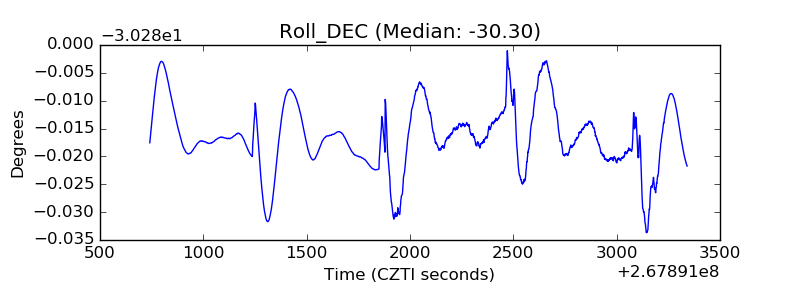 |
| _Roll_RA | 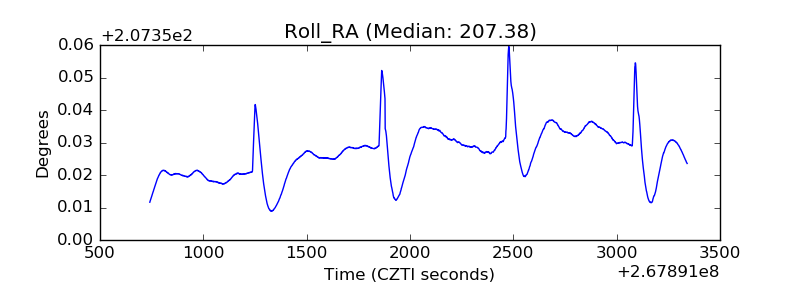 |
| Veto Counter |  |