| Param | Original file | Final file |
|---|---|---|
| Filename | modeM0/AS1A04_148T02_9000002198cztM0_level2.fits | modeM0/AS1A04_148T02_9000002198cztM0_level2_quad_clean.evt |
| Size (bytes) | 265,239,360 | 244,321,920 |
| Size | 253.0 MB | 233.0 MB |
| Events in quadrant A | 1,605,768 | 1,429,122 |
| Events in quadrant B | 1,530,288 | 1,407,025 |
| Events in quadrant C | 1,561,976 | 1,334,134 |
| Events in quadrant D | 1,367,408 | 1,260,795 |
| Mode SS | |||
|---|---|---|---|
| Quadrant | BADHDUFLAG | Total packets | Discarded packets |
| A | 0 | 582 | 0 |
| B | 0 | 582 | 0 |
| C | 0 | 582 | 0 |
| D | 0 | 582 | 0 |
| Mode M9 | |||
|---|---|---|---|
| Quadrant | BADHDUFLAG | Total packets | Discarded packets |
| A | 0 | 39 | 0 |
| B | 0 | 39 | 0 |
| C | 0 | 39 | 0 |
| D | 0 | 39 | 0 |
| Mode M0 | |||
|---|---|---|---|
| Quadrant | BADHDUFLAG | Total packets | Discarded packets |
| A | 0 | 59239 | 0 |
| B | 0 | 62358 | 0 |
| C | 0 | 58676 | 0 |
| D | 0 | 72178 | 0 |
| Quadrant | Total seconds | Saturated seconds | Saturation percentage |
|---|---|---|---|
| A | 28627 | 118 | 0.412198% |
| B | 28627 | 263 | 0.918713% |
| C | 28627 | 83 | 0.289936% |
| D | 28627 | 574 | 2.005100% |
Noise dominated data is calculated using 1-second bins in cleaned event files. If a bin has >2000 counts, and if more than 50% of those come from <1% of pixels, then it is considered to be noise-dominated and hence unusable.
| Quadrant | # 1 sec bins | Bins with >0 counts | Bins with >2000 counts | High rate bins dominated by noise | Noise dominated (total time) | Noise dominated (detector-on time) | Marked lightcurve |
|---|---|---|---|---|---|---|---|
| A | 32382 | 28626 | 0 | 0 | 0.00% | 0.00% | 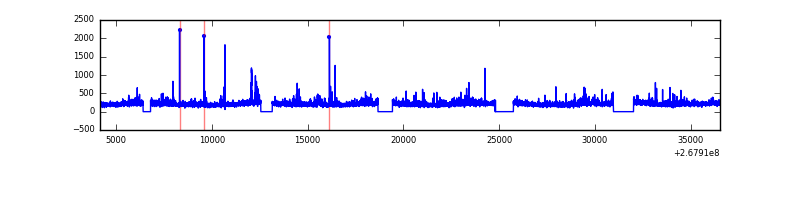 |
| B | 32382 | 28627 | 0 | 0 | 0.00% | 0.00% | 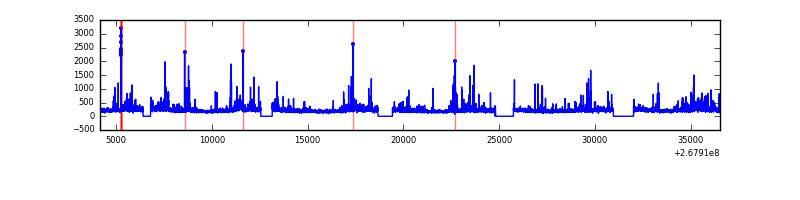 |
| C | 32382 | 28627 | 0 | 0 | 0.00% | 0.00% | 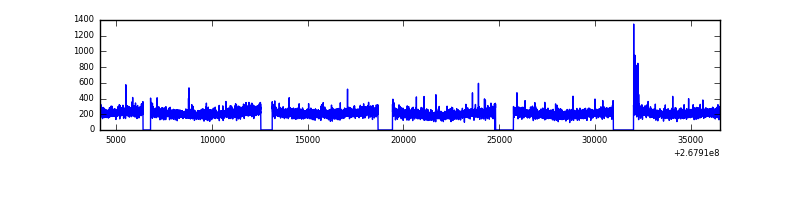 |
| D | 32382 | 28627 | 0 | 0 | 0.00% | 0.00% |  |
Top three noisy pixels from each quadrant. If the there are fewer than three noisy pixels in the level2.evt file, extra rows are filled as -1
| Pixel properties | Quadrant properties | ||||||
|---|---|---|---|---|---|---|---|
| Quadrant | DetID | PixID | Counts | Sigma | Mean | Median | Sigma |
| A | 0 | 29 | 1568 | 11.22 | 417 | 391 | 104.9 |
| A | 7 | 110 | 1335 | 9.0 | 417 | 391 | 104.9 |
| A | 0 | 30 | 1190 | 7.62 | 417 | 391 | 104.9 |
| B | 2 | 9 | 1356 | 12.02 | 404 | 386 | 80.7 |
| B | 14 | 254 | 1037 | 8.07 | 404 | 386 | 80.7 |
| B | 5 | 232 | 1032 | 8.01 | 404 | 386 | 80.7 |
| C | 1 | 81 | 1186 | 7.37 | 412 | 384 | 108.8 |
| C | 1 | 80 | 1163 | 7.16 | 412 | 384 | 108.8 |
| C | 12 | 241 | 1136 | 6.91 | 412 | 384 | 108.8 |
| D | 6 | 231 | 1033 | 6.33 | 389 | 354 | 107.2 |
| D | 3 | 14 | 990 | 5.93 | 389 | 354 | 107.2 |
| D | 3 | 159 | 989 | 5.92 | 389 | 354 | 107.2 |
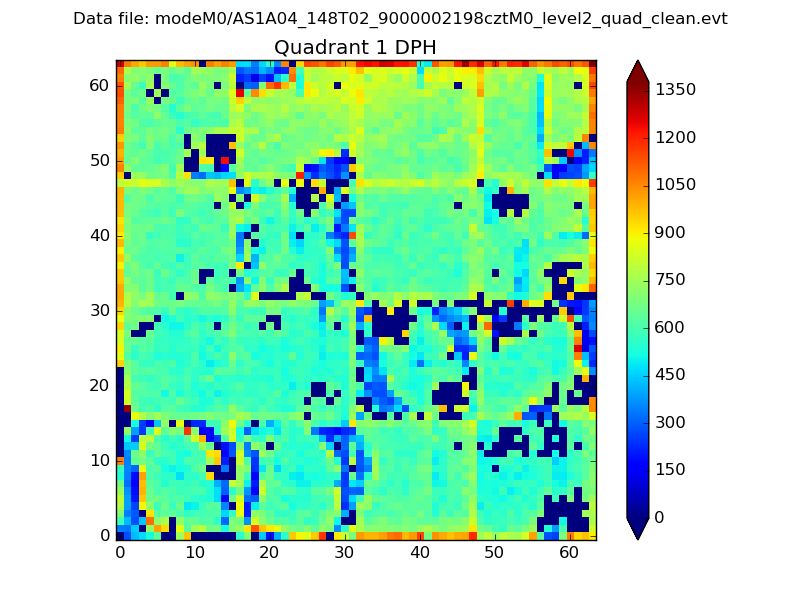
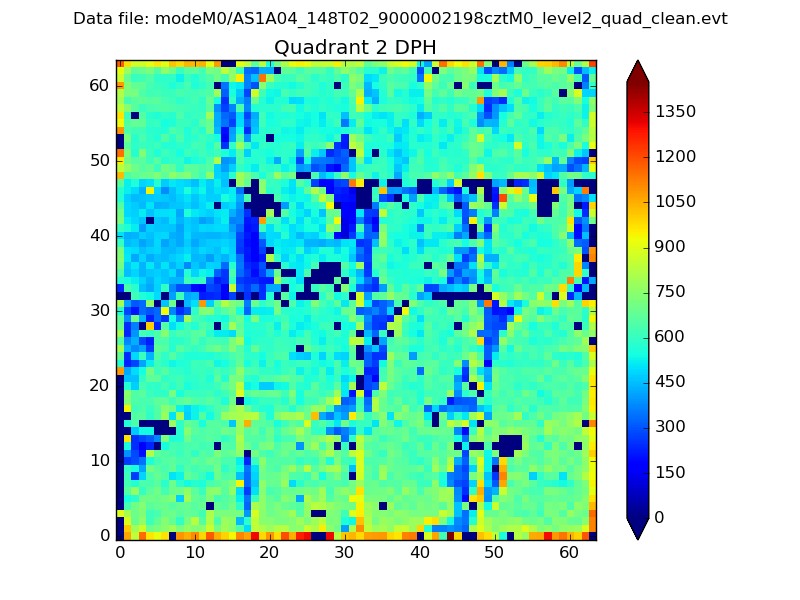
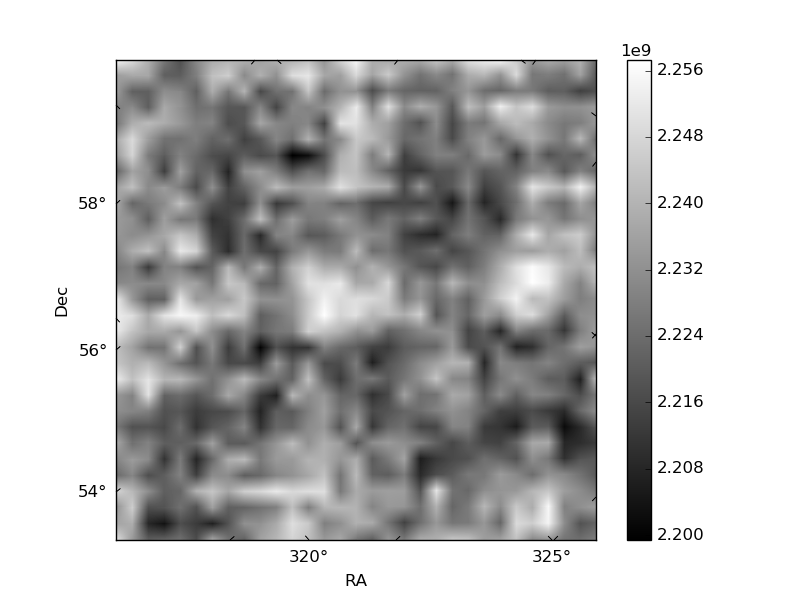
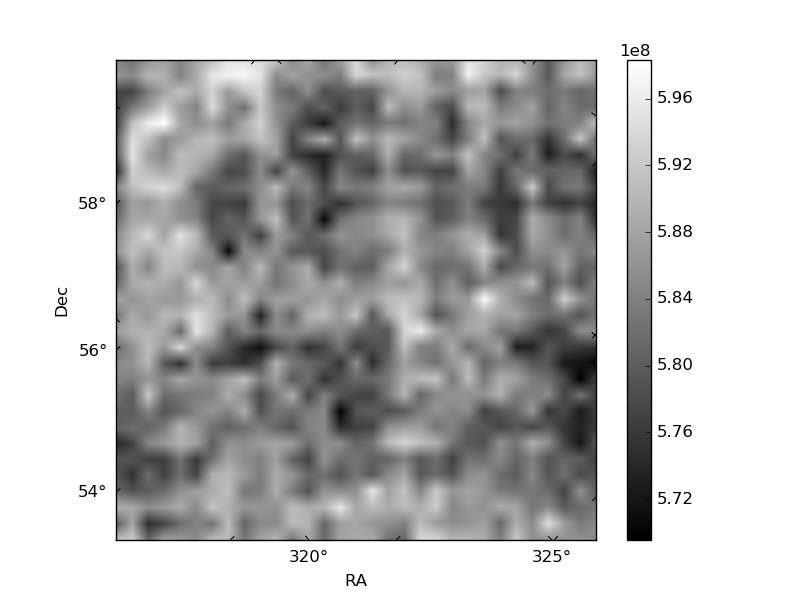
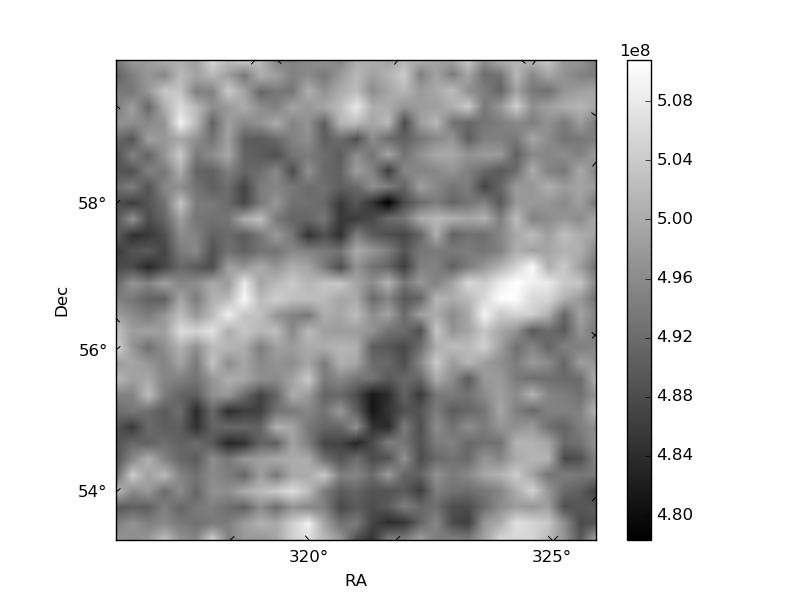
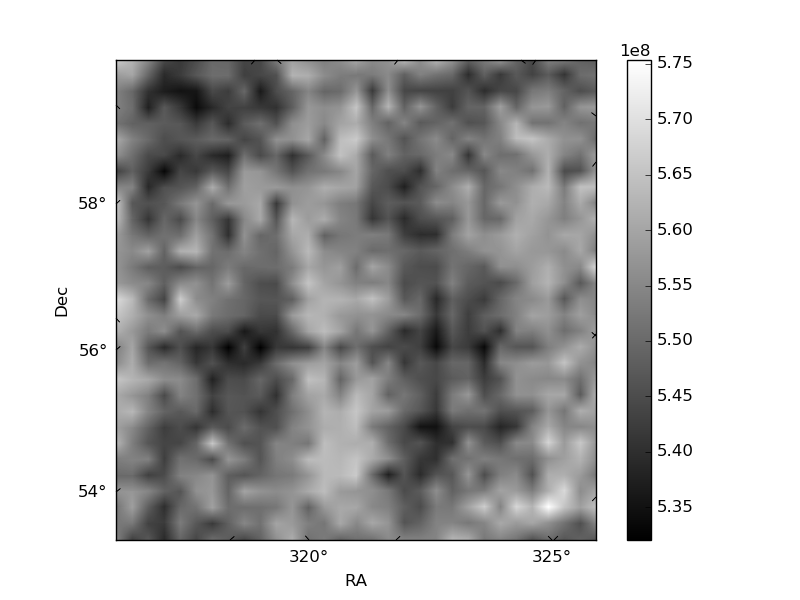
Histogram calculated using DETX and DETY for each event in the final _common_clean file
| Quadrant A | 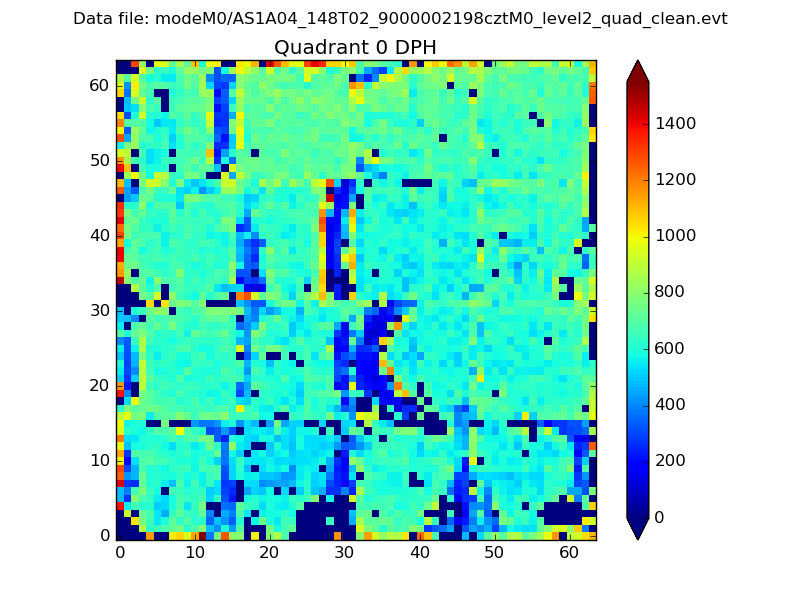 |
 |
Quadrant B |
|---|---|---|---|
| Quadrant D | 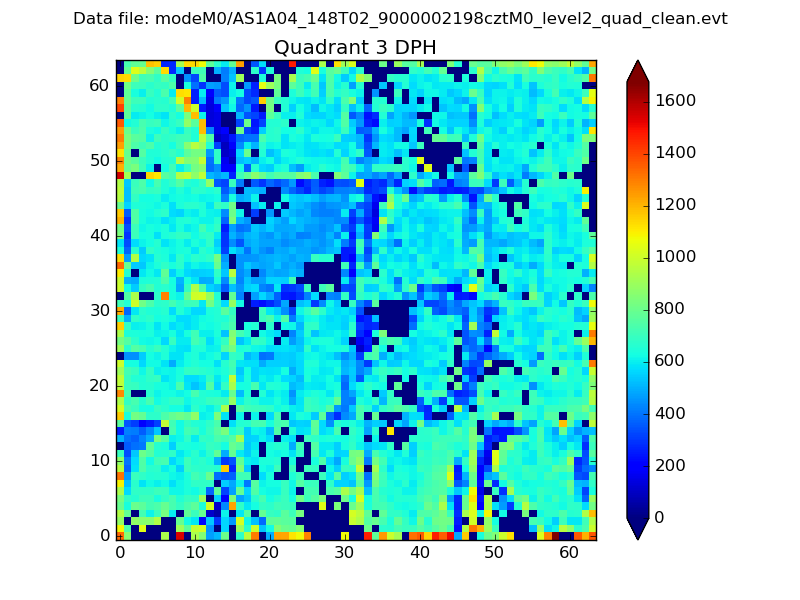 |
 |
Quadrant C |
| Plot type | Count rate plots | Images |
|---|---|---|
| Comparison with Poisson distribution Blue bars denote a histogram of data divided into 1 sec bins. Red curve is a Poisson curve with rate = median count rate of data. |
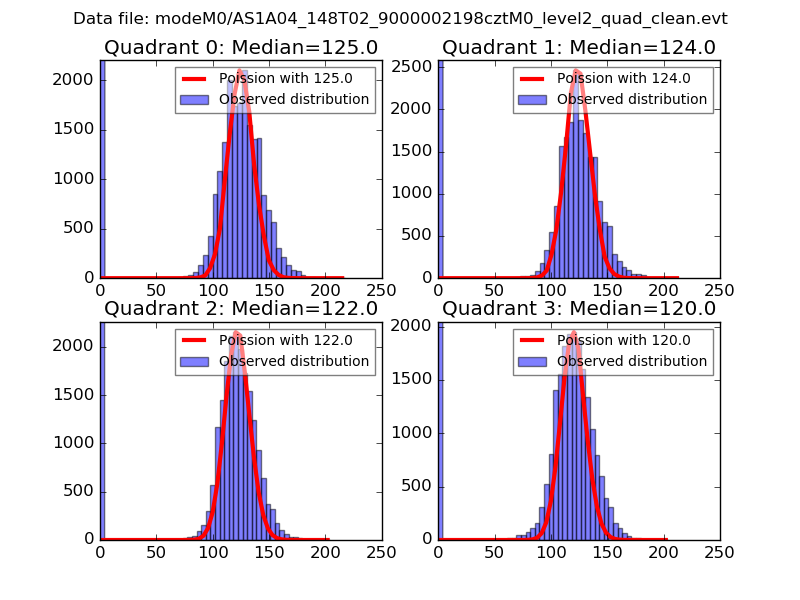 |
 |
| Quadrant-wise count rates Data is divided into 100 sec bins |
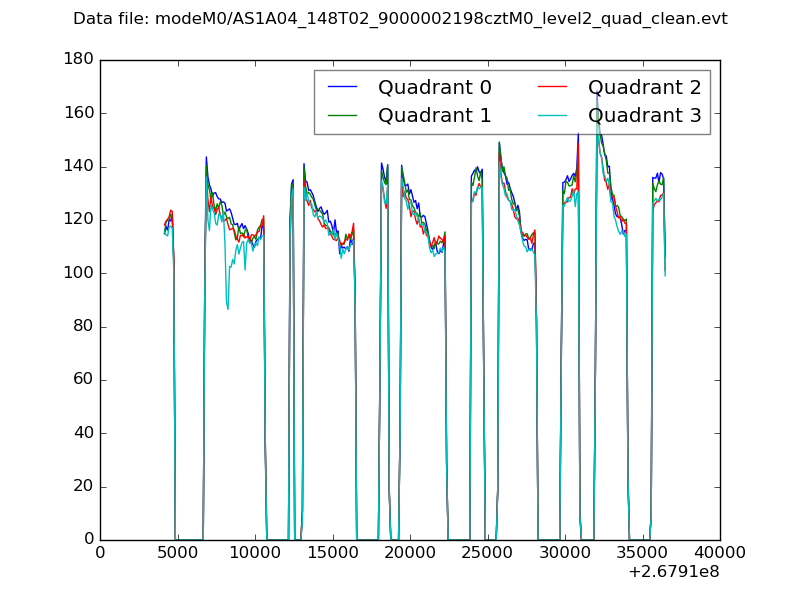 |
|
| Module-wise count rates for Quadrant A Data is divided into 100 sec bins |
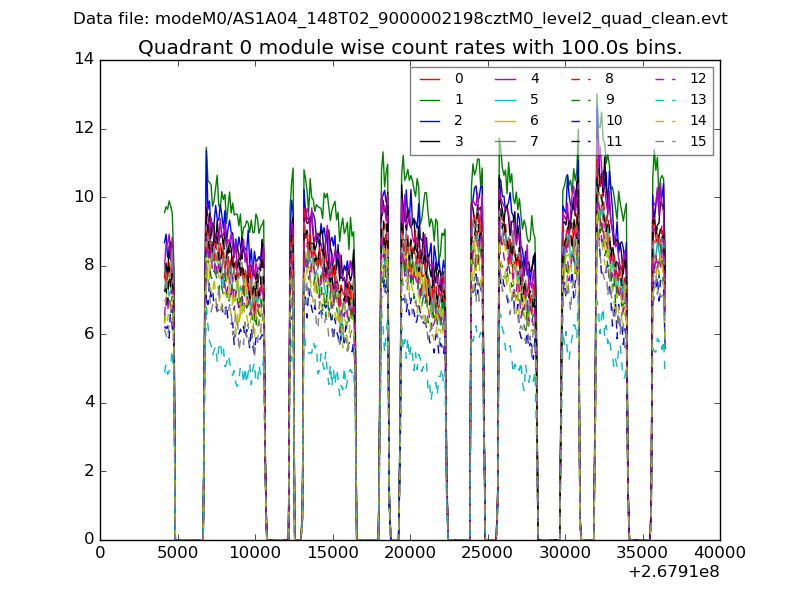 |
 |
| Module-wise count rates for Quadrant B Data is divided into 100 sec bins |
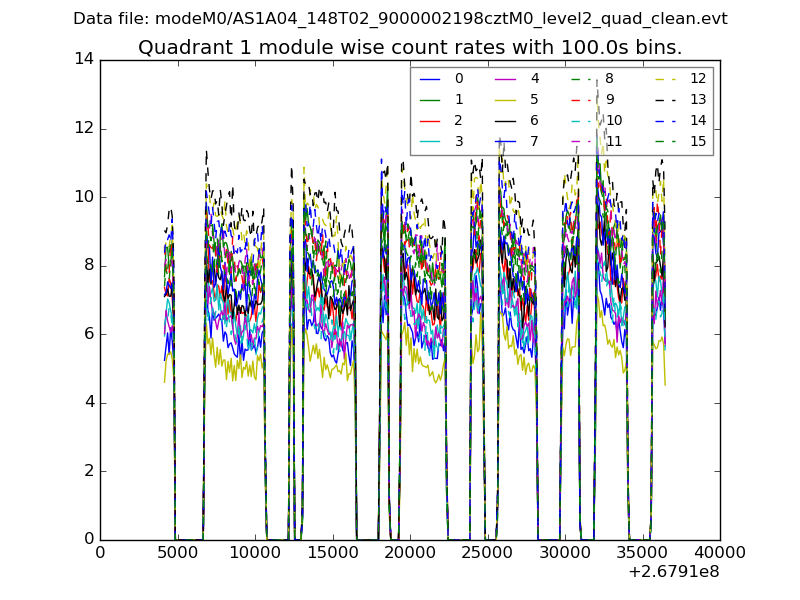 |
 |
| Module-wise count rates for Quadrant C Data is divided into 100 sec bins |
 |
 |
| Module-wise count rates for Quadrant D Data is divided into 100 sec bins |
 |
 |
| Parameter | Plot |
|---|---|
| CZT HV Monitor | 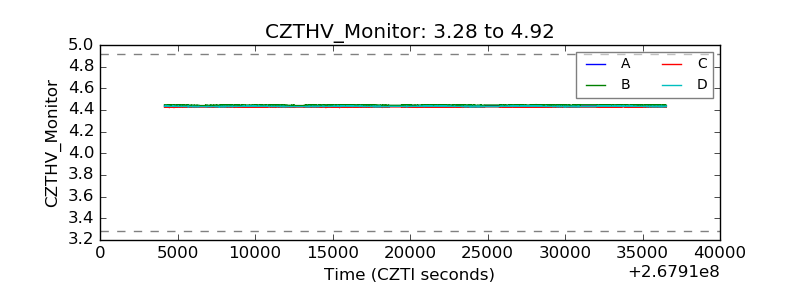 |
| D_VDD | 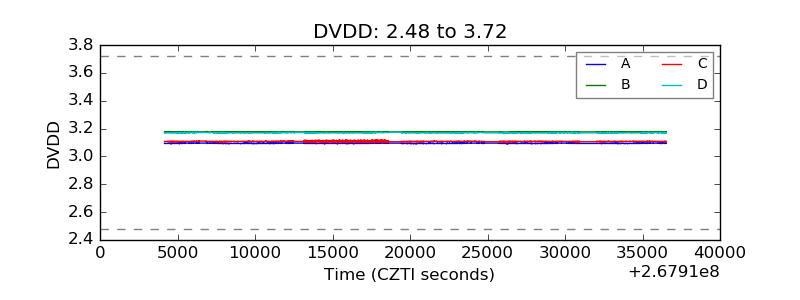 |
| Temperature 1 |  |
| Veto HV Monitor | 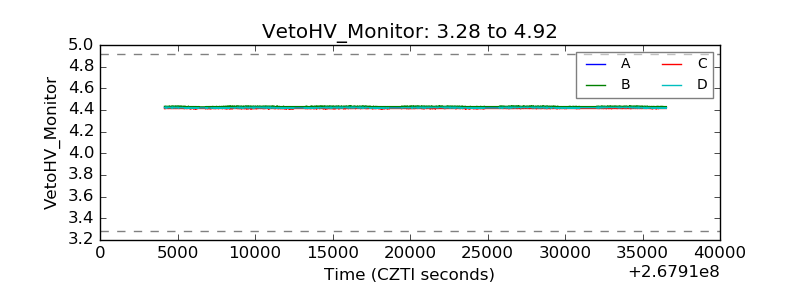 |
| Veto LLD | 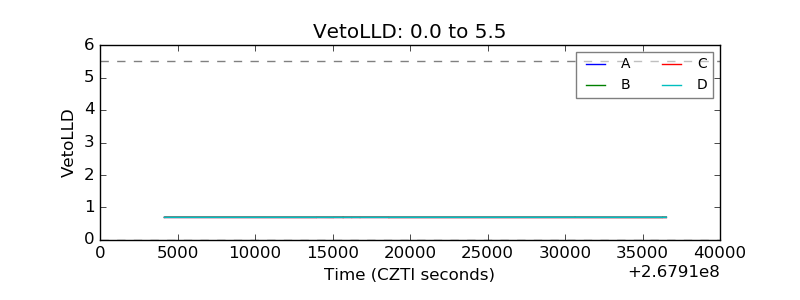 |
| Alpha Counter | 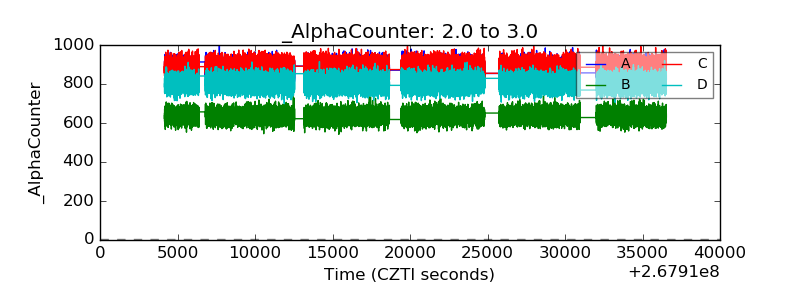 |
| _CPM_Rate | 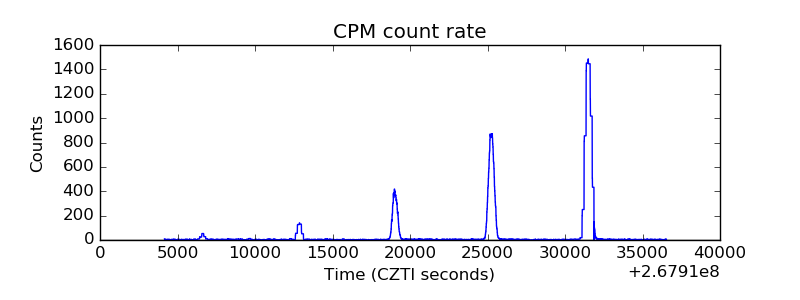 |
| CZT Counter |  |
| +2.5 Volts monitor |  |
| +5 Volts monitor |  |
| _ROLL_ROT | 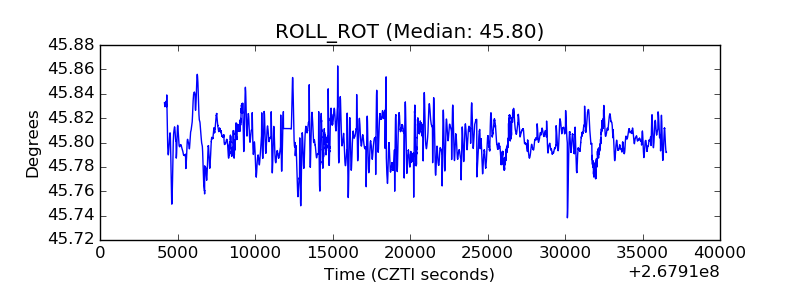 |
| _Roll_DEC | 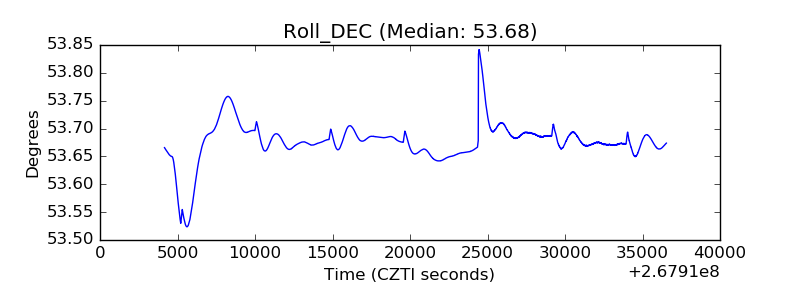 |
| _Roll_RA | 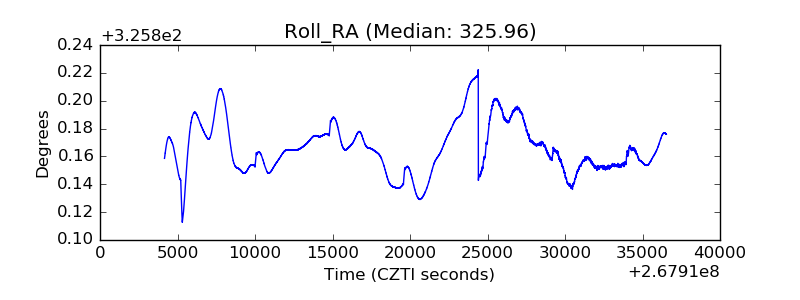 |
| Veto Counter | 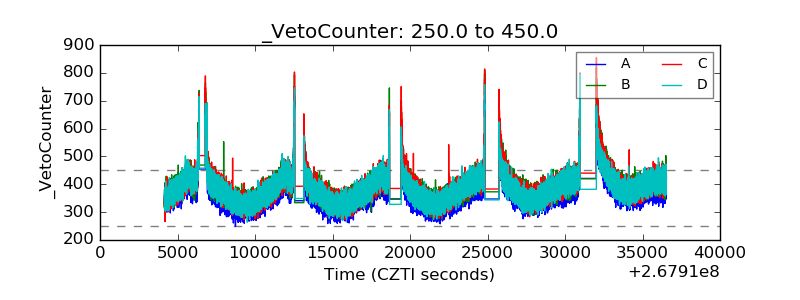 |