| Param | Original file | Final file |
|---|---|---|
| Filename | modeM0/AS1A04_148T02_9000002198_14873cztM0_level2.evt | modeM0/AS1A04_148T02_9000002198_14873cztM0_level2_quad_clean.evt |
| Size (bytes) | 1,087,583,040 | 199,912,320 |
| Size | 1.0 GB | 190.7 MB |
| Events in quadrant A | 7,158,811 | 1,279,733 |
| Events in quadrant B | 7,714,223 | 1,268,830 |
| Events in quadrant C | 7,183,695 | 1,247,480 |
| Events in quadrant D | 9,862,467 | 1,219,354 |
| Mode SS | |||
|---|---|---|---|
| Quadrant | BADHDUFLAG | Total packets | Discarded packets |
| A | 0 | 306 | 0 |
| B | 0 | 306 | 0 |
| C | 0 | 306 | 0 |
| D | 0 | 306 | 0 |
| Mode M9 | |||
|---|---|---|---|
| Quadrant | BADHDUFLAG | Total packets | Discarded packets |
| A | 0 | 18 | 0 |
| B | 0 | 18 | 0 |
| C | 0 | 18 | 0 |
| D | 0 | 18 | 0 |
| Mode M0 | |||
|---|---|---|---|
| Quadrant | BADHDUFLAG | Total packets | Discarded packets |
| A | 0 | 31495 | 4 |
| B | 0 | 33191 | 3 |
| C | 0 | 31127 | 3 |
| D | 0 | 40275 | 3 |
| Quadrant | Total seconds | Saturated seconds | Saturation percentage |
|---|---|---|---|
| A | 15066 | 78 | 0.517722% |
| B | 15066 | 162 | 1.075269% |
| C | 15066 | 59 | 0.391610% |
| D | 15066 | 486 | 3.225806% |
Noise dominated data is calculated using 1-second bins in cleaned event files. If a bin has >2000 counts, and if more than 50% of those come from <1% of pixels, then it is considered to be noise-dominated and hence unusable.
| Quadrant | # 1 sec bins | Bins with >0 counts | Bins with >2000 counts | High rate bins dominated by noise | Noise dominated (total time) | Noise dominated (detector-on time) | Marked lightcurve |
|---|---|---|---|---|---|---|---|
| A | 16822 | 15070 | 10 | 10 | 0.06% | 0.07% | 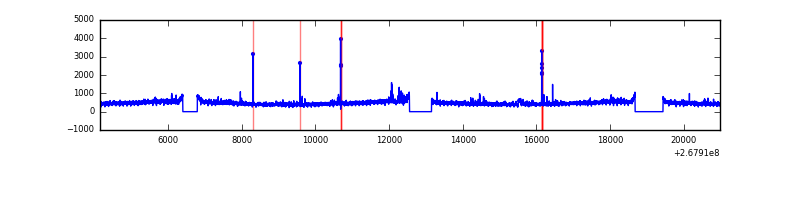 |
| B | 16822 | 15070 | 26 | 26 | 0.15% | 0.17% | 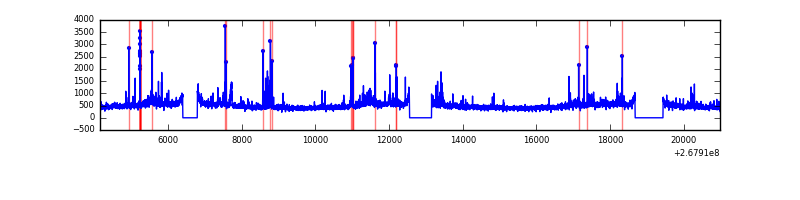 |
| C | 16822 | 15070 | 0 | 0 | 0.00% | 0.00% | 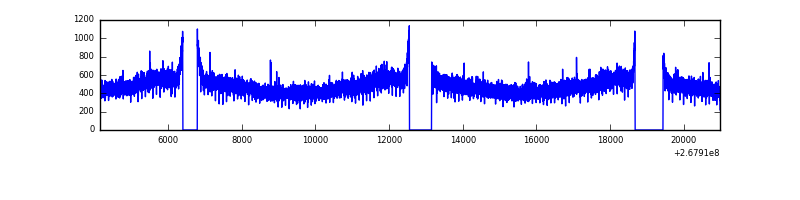 |
| D | 16822 | 15070 | 599 | 599 | 3.56% | 3.97% | 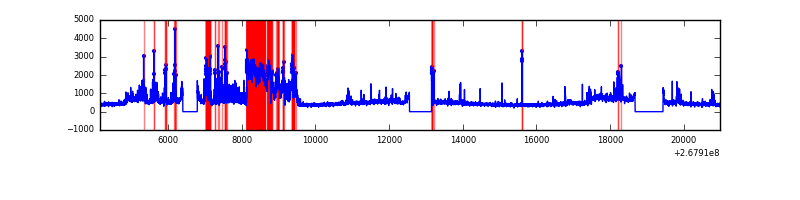 |
Top three noisy pixels from each quadrant. If the there are fewer than three noisy pixels in the level2.evt file, extra rows are filled as -1
| Pixel properties | Quadrant properties | ||||||
|---|---|---|---|---|---|---|---|
| Quadrant | DetID | PixID | Counts | Sigma | Mean | Median | Sigma |
| A | 12 | 189 | 235808 | 652.79 | 1780 | 1743 | 358.6 |
| A | 9 | 143 | 49583 | 133.42 | 1780 | 1743 | 358.6 |
| A | 0 | 226 | 15842 | 39.32 | 1780 | 1743 | 358.6 |
| B | 0 | 219 | 188379 | 552.94 | 1771 | 1726 | 337.6 |
| B | 0 | 189 | 170868 | 501.06 | 1771 | 1726 | 337.6 |
| B | 0 | 205 | 97642 | 284.14 | 1771 | 1726 | 337.6 |
| C | 3 | 233 | 446692 | 1108.7 | 1720 | 1721 | 401.3 |
| C | 3 | 232 | 13047 | 28.22 | 1720 | 1721 | 401.3 |
| C | 8 | 128 | 12765 | 27.52 | 1720 | 1721 | 401.3 |
| D | 13 | 104 | 2175273 | 5334.52 | 1712 | 1668 | 407.5 |
| D | 7 | 254 | 728186 | 1783.04 | 1712 | 1668 | 407.5 |
| D | 10 | 70 | 203216 | 494.64 | 1712 | 1668 | 407.5 |
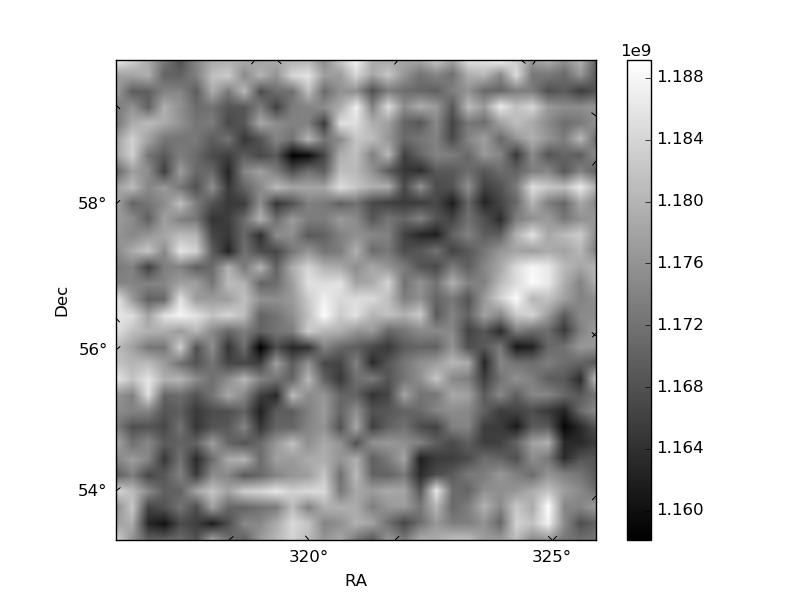
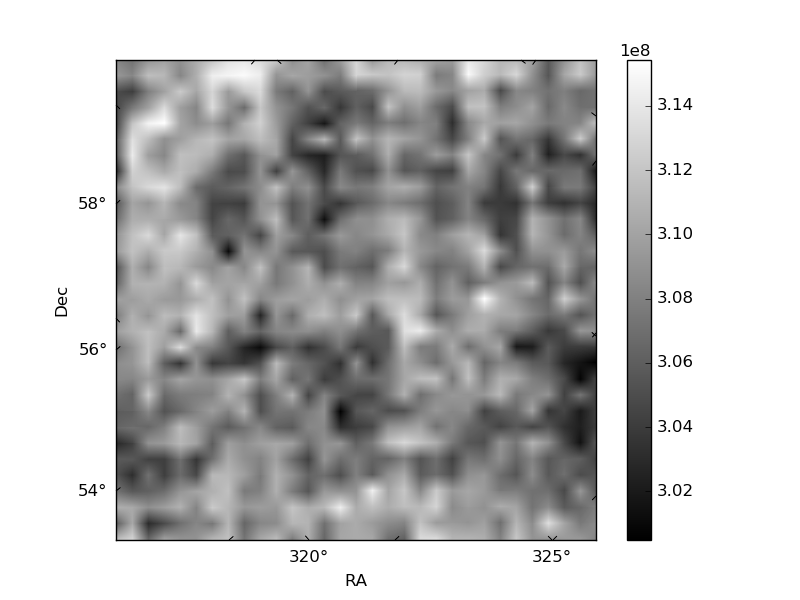
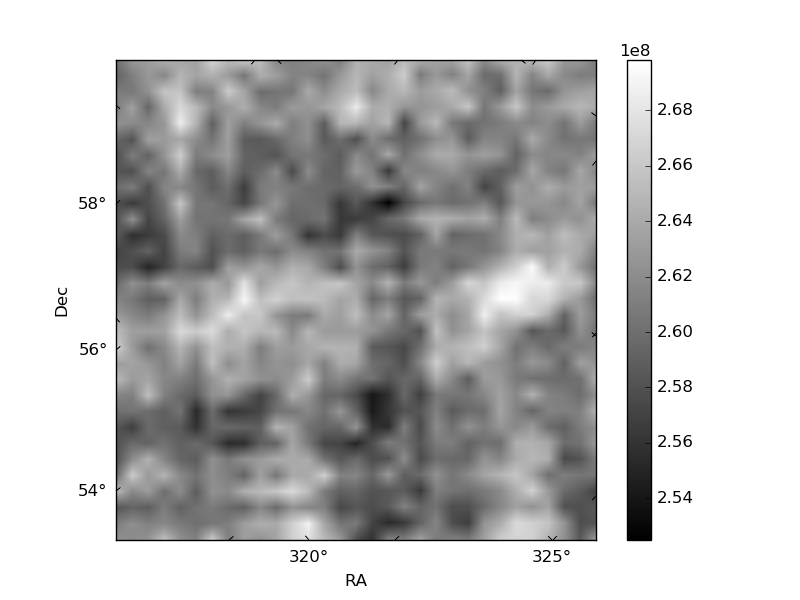
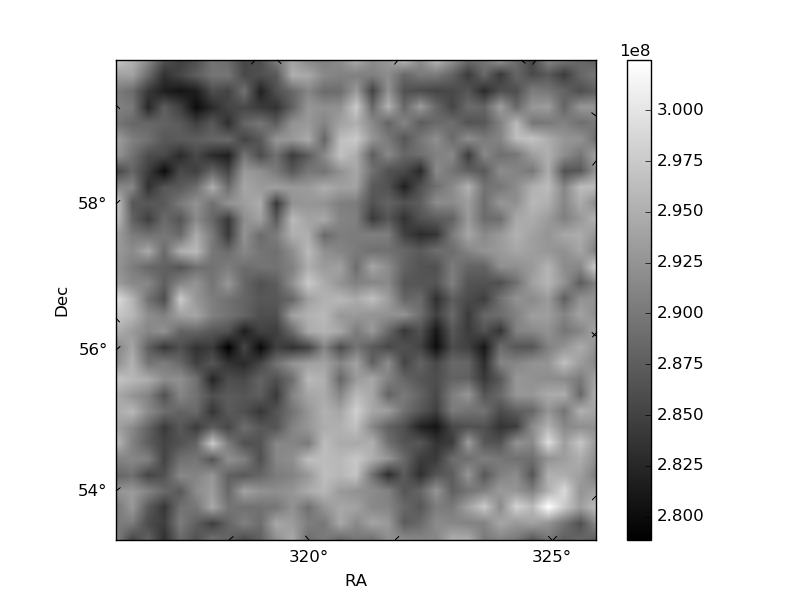
Histogram calculated using DETX and DETY for each event in the final _common_clean file
| Quadrant A | 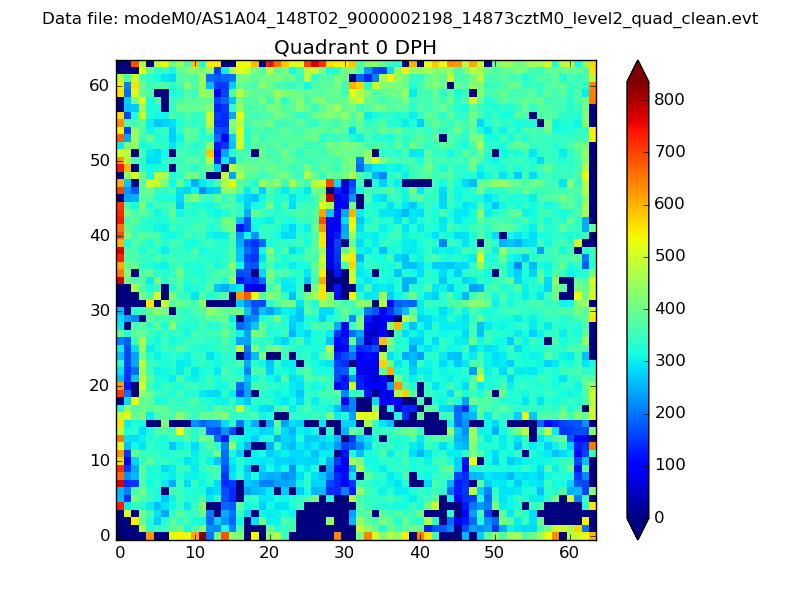 |
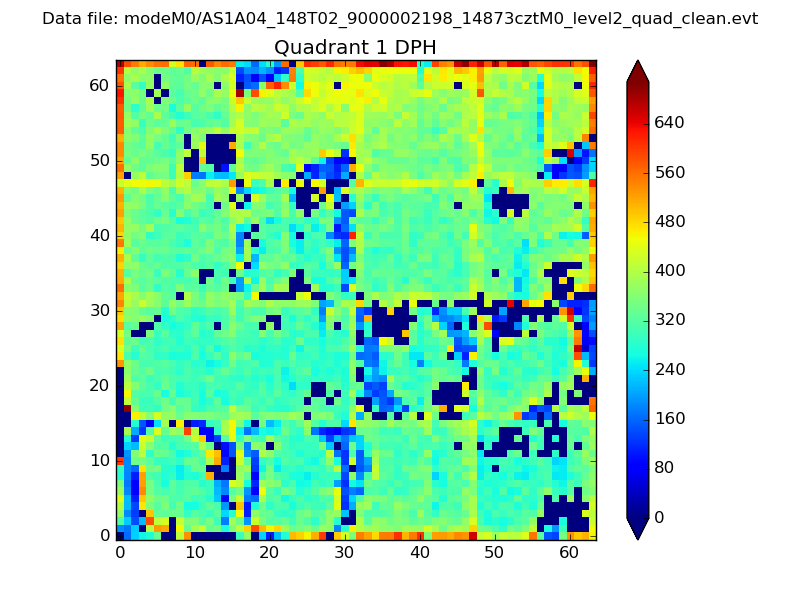 |
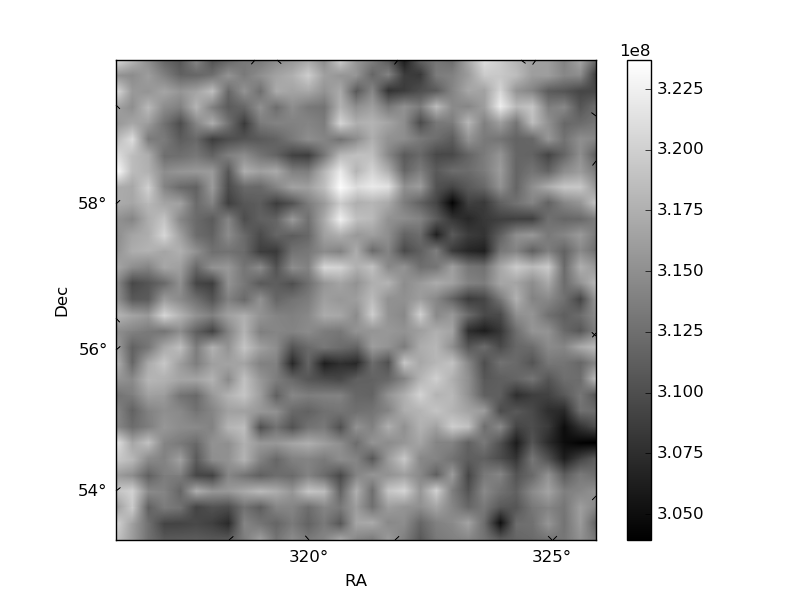
Quadrant B |
|---|---|---|---|
| Quadrant D | 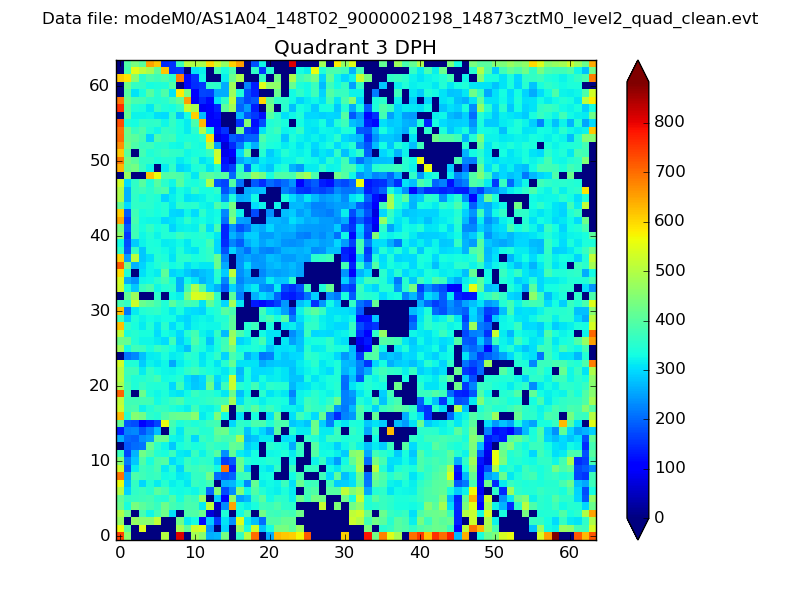 |
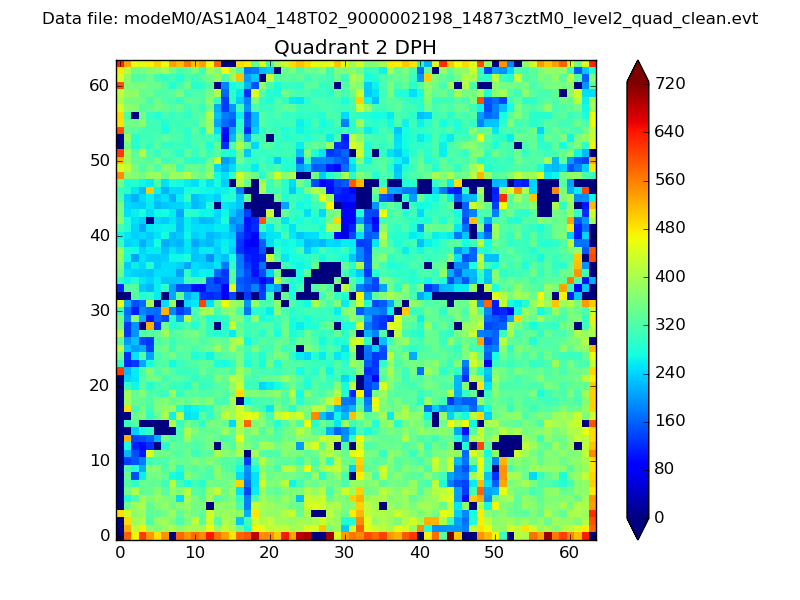 |
Quadrant C |
| Plot type | Count rate plots | Images |
|---|---|---|
| Comparison with Poisson distribution Blue bars denote a histogram of data divided into 1 sec bins. Red curve is a Poisson curve with rate = median count rate of data. |
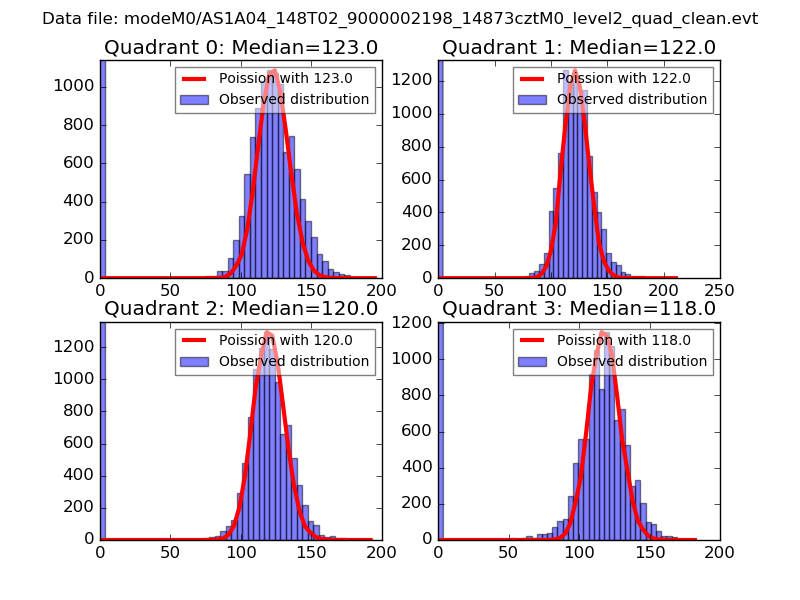 |
 |
| Quadrant-wise count rates Data is divided into 100 sec bins |
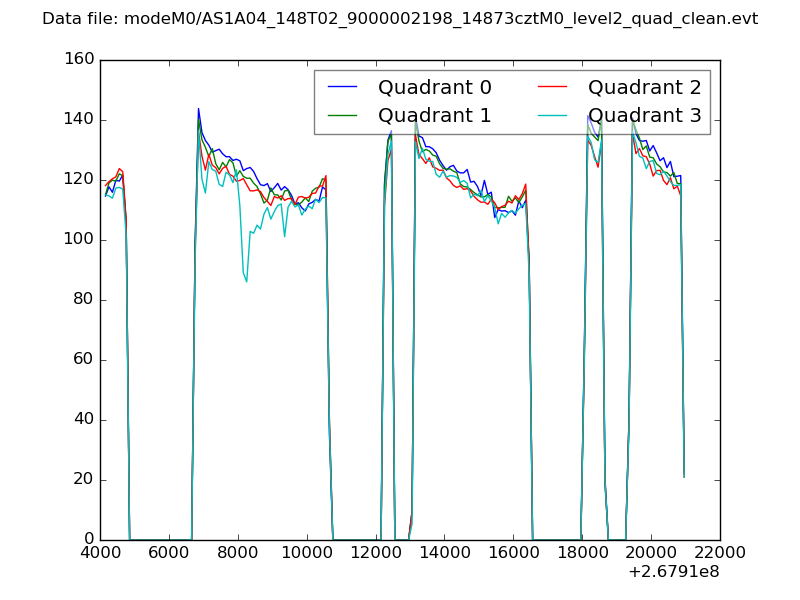 |
|
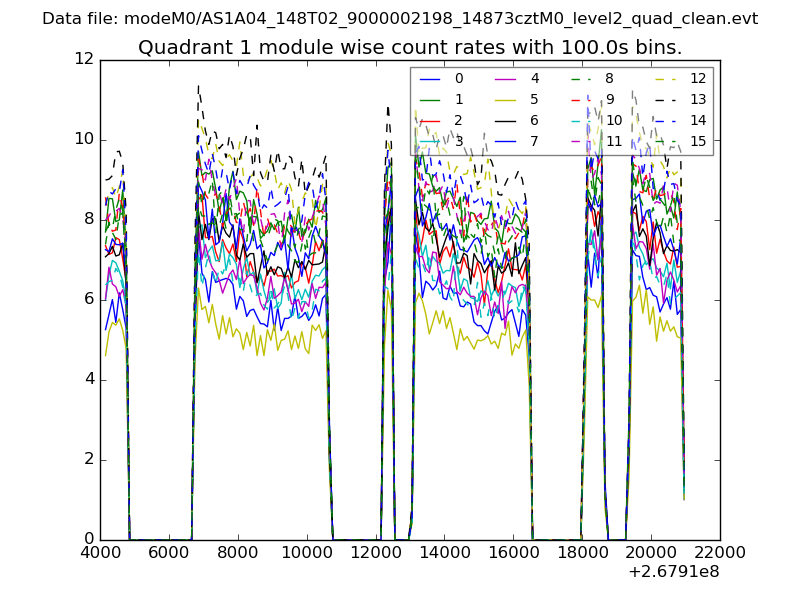
| Module-wise count rates for Quadrant A Data is divided into 100 sec bins |
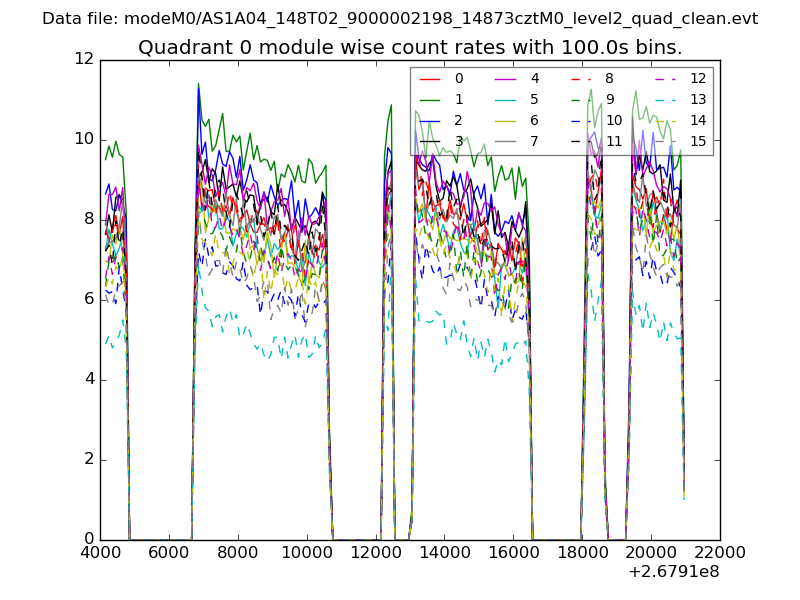 |
 |
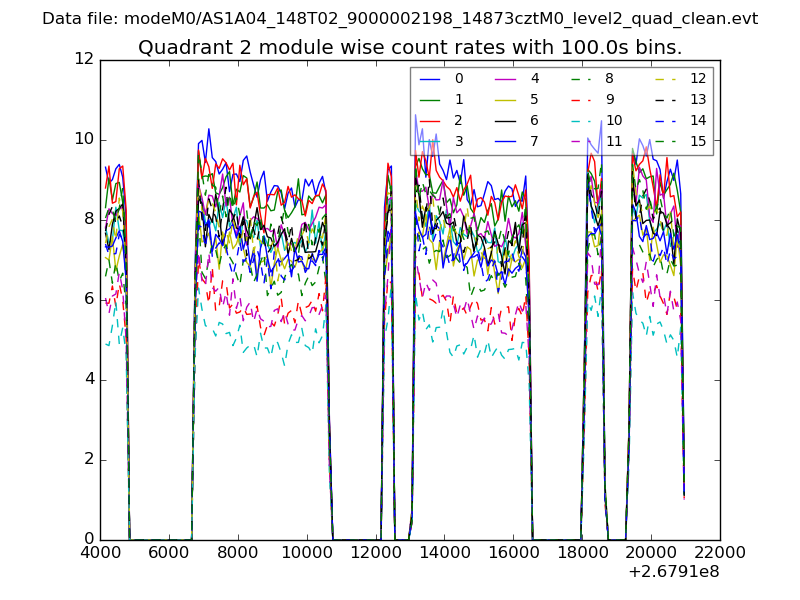
| Module-wise count rates for Quadrant B Data is divided into 100 sec bins |
 |
 |
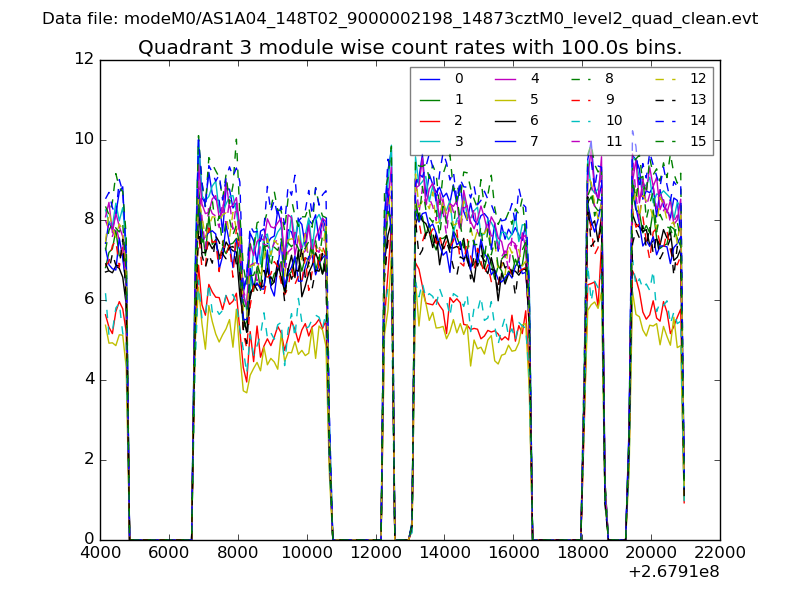
| Module-wise count rates for Quadrant C Data is divided into 100 sec bins |
 |
 |
| Module-wise count rates for Quadrant D Data is divided into 100 sec bins |
 |
 |
| Parameter | Plot |
|---|---|
| CZT HV Monitor | 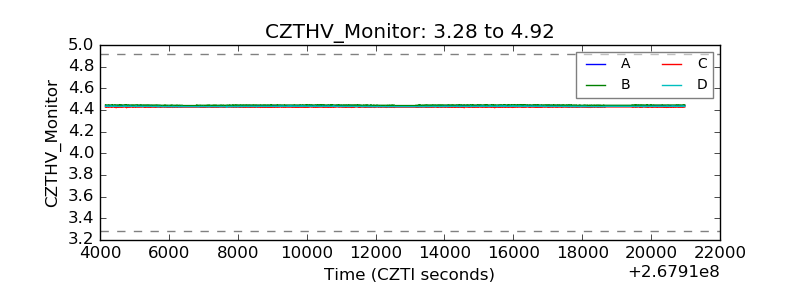 |
| D_VDD | 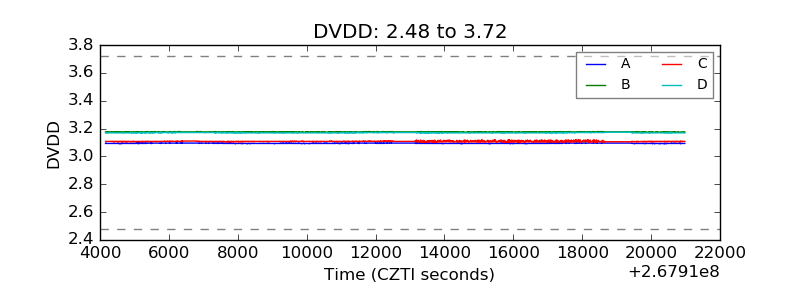 |
| Temperature 1 | 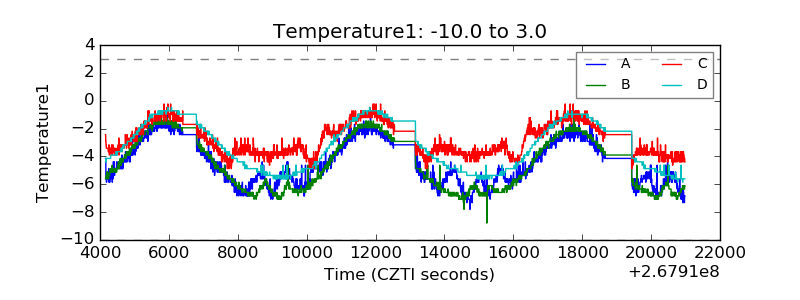 |
| Veto HV Monitor | 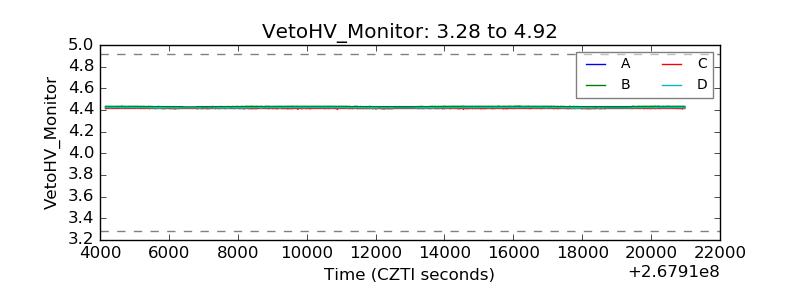 |
| Veto LLD | 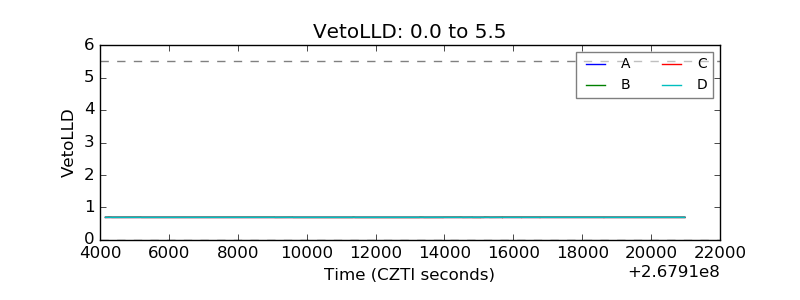 |
| Alpha Counter | 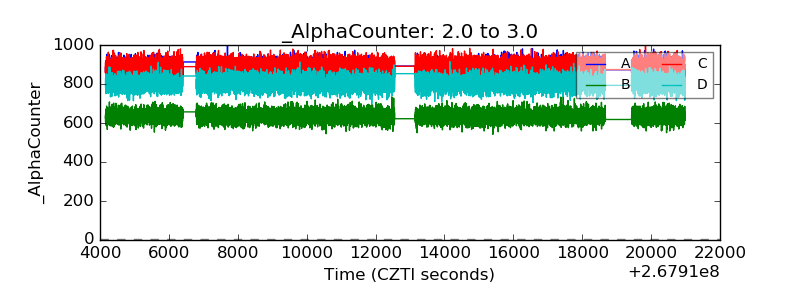 |
| _CPM_Rate | 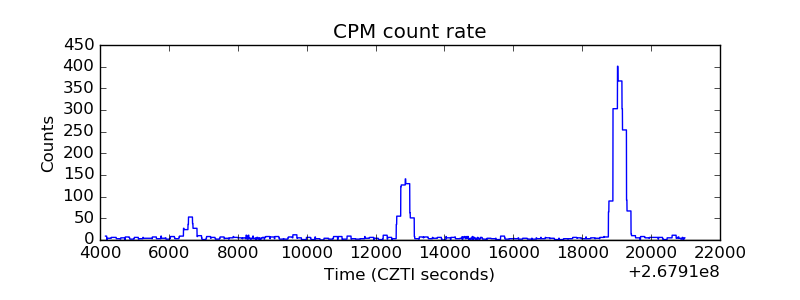 |
| CZT Counter | 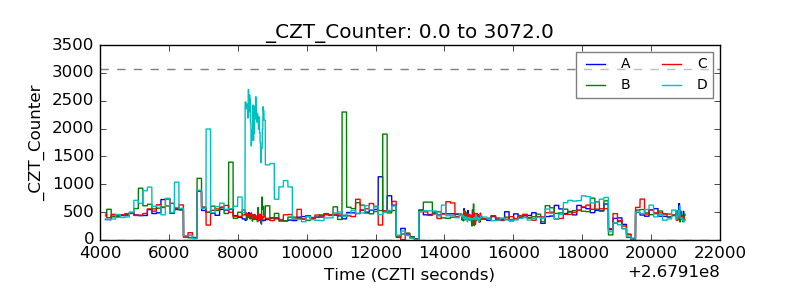 |
| +2.5 Volts monitor |  |
| +5 Volts monitor |  |
| _ROLL_ROT | 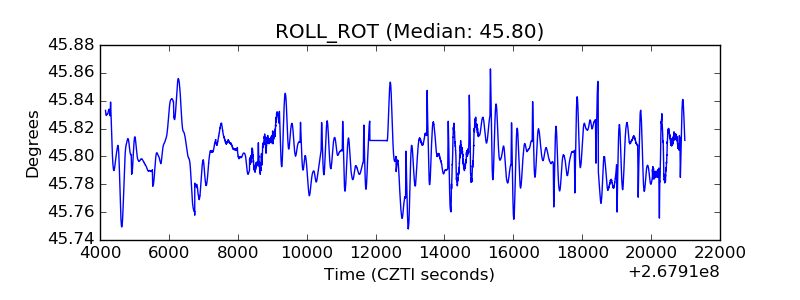 |
| _Roll_DEC | 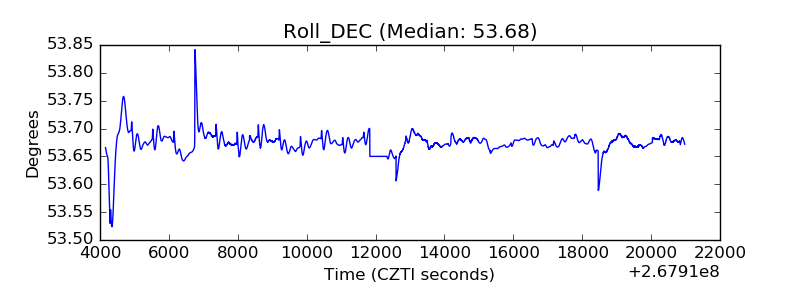 |
| _Roll_RA | 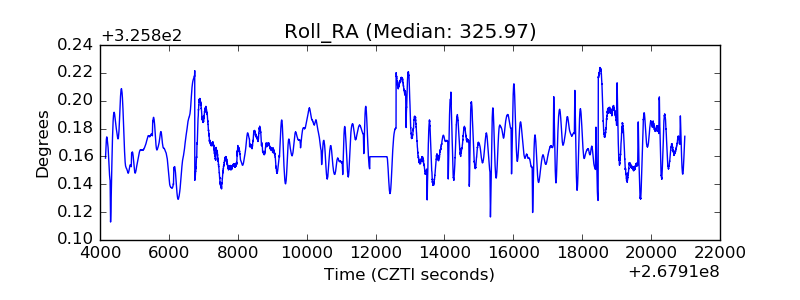 |
| Veto Counter | 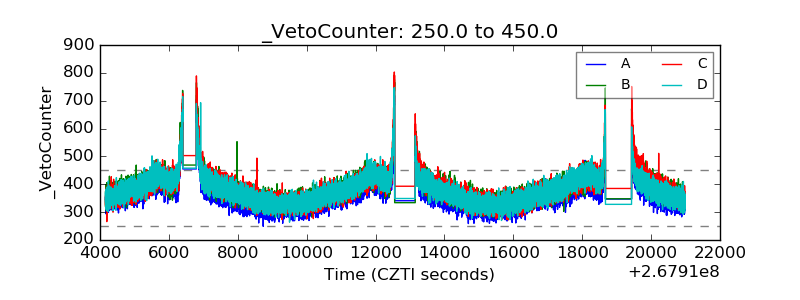 |