| Param | Original file | Final file |
|---|---|---|
| Filename | modeM0/AS1A04_148T02_9000002198_14874cztM0_level2.evt | modeM0/AS1A04_148T02_9000002198_14874cztM0_level2_quad_clean.evt |
| Size (bytes) | 444,744,000 | 101,422,080 |
| Size | 424.1 MB | 96.7 MB |
| Events in quadrant A | 3,146,047 | 662,169 |
| Events in quadrant B | 3,288,494 | 657,823 |
| Events in quadrant C | 3,113,095 | 642,271 |
| Events in quadrant D | 3,461,217 | 637,401 |
| Mode SS | |||
|---|---|---|---|
| Quadrant | BADHDUFLAG | Total packets | Discarded packets |
| A | 0 | 138 | 0 |
| B | 0 | 138 | 0 |
| C | 0 | 138 | 0 |
| D | 0 | 138 | 0 |
| Mode M9 | |||
|---|---|---|---|
| Quadrant | BADHDUFLAG | Total packets | Discarded packets |
| A | 0 | 13 | 0 |
| B | 0 | 13 | 0 |
| C | 0 | 13 | 0 |
| D | 0 | 14 | 0 |
| Mode M0 | |||
|---|---|---|---|
| Quadrant | BADHDUFLAG | Total packets | Discarded packets |
| A | 0 | 13863 | 3 |
| B | 0 | 14324 | 2 |
| C | 0 | 13798 | 2 |
| D | 0 | 15344 | 2 |
| Quadrant | Total seconds | Saturated seconds | Saturation percentage |
|---|---|---|---|
| A | 6776 | 17 | 0.250885% |
| B | 6776 | 52 | 0.767414% |
| C | 6776 | 12 | 0.177096% |
| D | 6776 | 19 | 0.280401% |
Noise dominated data is calculated using 1-second bins in cleaned event files. If a bin has >2000 counts, and if more than 50% of those come from <1% of pixels, then it is considered to be noise-dominated and hence unusable.
| Quadrant | # 1 sec bins | Bins with >0 counts | Bins with >2000 counts | High rate bins dominated by noise | Noise dominated (total time) | Noise dominated (detector-on time) | Marked lightcurve |
|---|---|---|---|---|---|---|---|
| A | 7722 | 6779 | 0 | 0 | 0.00% | 0.00% | 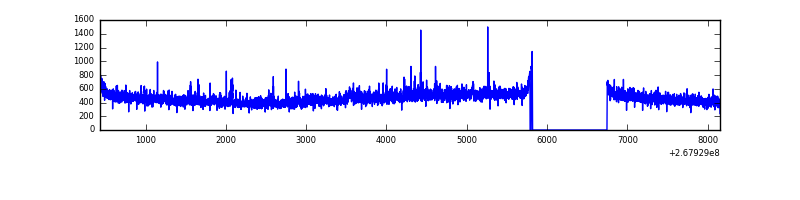 |
| B | 7722 | 6779 | 12 | 12 | 0.16% | 0.18% | 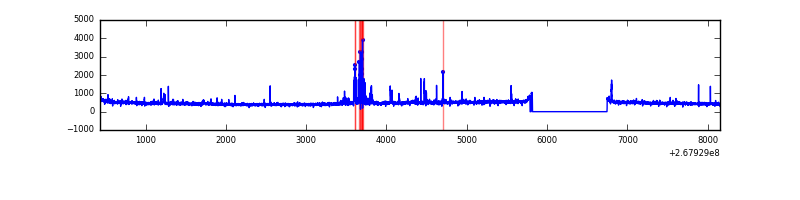 |
| C | 7722 | 6779 | 0 | 0 | 0.00% | 0.00% | 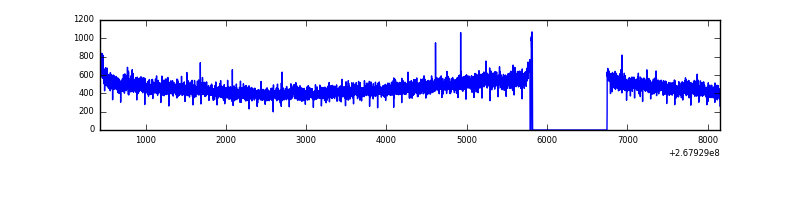 |
| D | 7722 | 6779 | 2 | 2 | 0.03% | 0.03% | 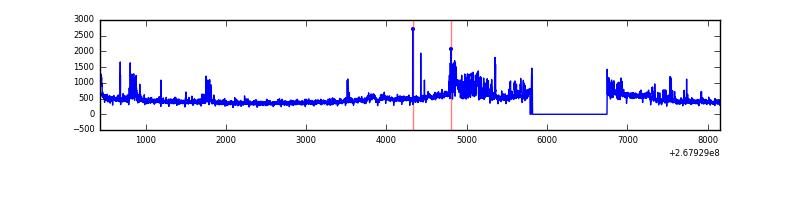 |
Top three noisy pixels from each quadrant. If the there are fewer than three noisy pixels in the level2.evt file, extra rows are filled as -1
| Pixel properties | Quadrant properties | ||||||
|---|---|---|---|---|---|---|---|
| Quadrant | DetID | PixID | Counts | Sigma | Mean | Median | Sigma |
| A | 12 | 189 | 107907 | 670.08 | 785 | 768 | 159.9 |
| A | 15 | 239 | 11219 | 65.36 | 785 | 768 | 159.9 |
| A | 0 | 226 | 6863 | 38.12 | 785 | 768 | 159.9 |
| B | 4 | 173 | 97329 | 638.88 | 784 | 764 | 151.1 |
| B | 3 | 64 | 43864 | 285.15 | 784 | 764 | 151.1 |
| B | 0 | 189 | 27559 | 177.28 | 784 | 764 | 151.1 |
| C | 3 | 233 | 150314 | 849.67 | 759 | 761 | 176.0 |
| C | 13 | 61 | 5490 | 26.87 | 759 | 761 | 176.0 |
| C | 8 | 222 | 2467 | 9.69 | 759 | 761 | 176.0 |
| D | 13 | 104 | 534053 | 2702.13 | 753 | 735 | 197.4 |
| D | 2 | 234 | 25403 | 124.98 | 753 | 735 | 197.4 |
| D | 2 | 120 | 21805 | 106.75 | 753 | 735 | 197.4 |
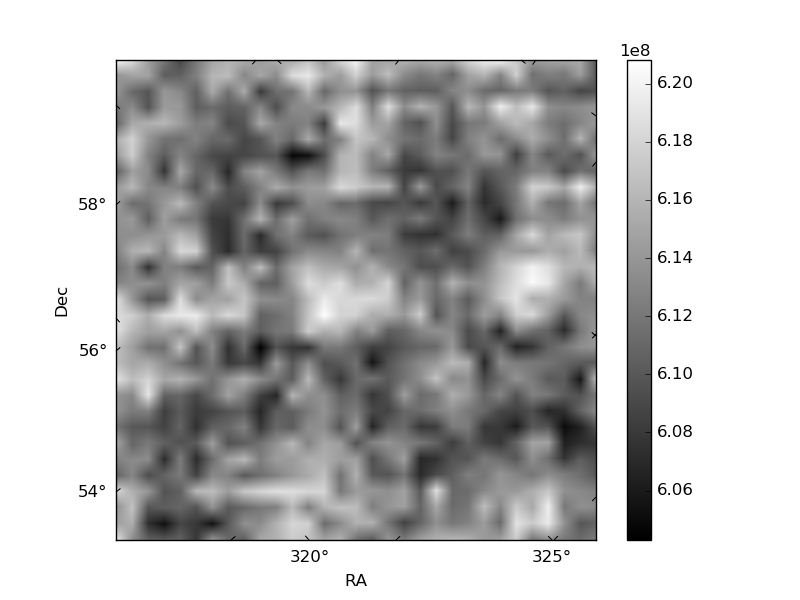
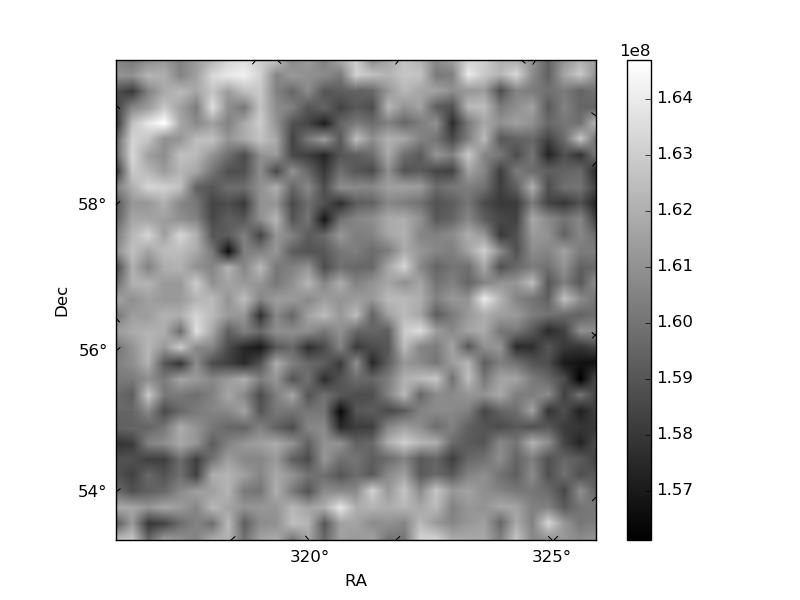
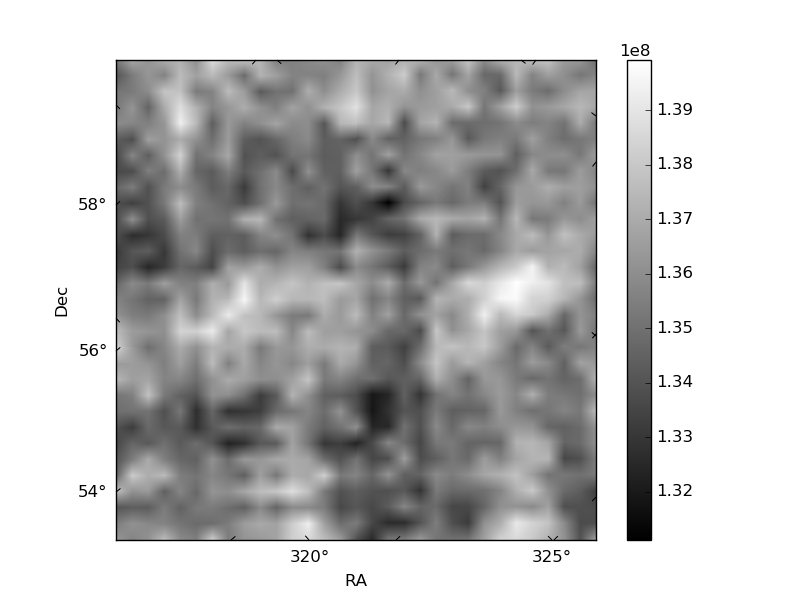
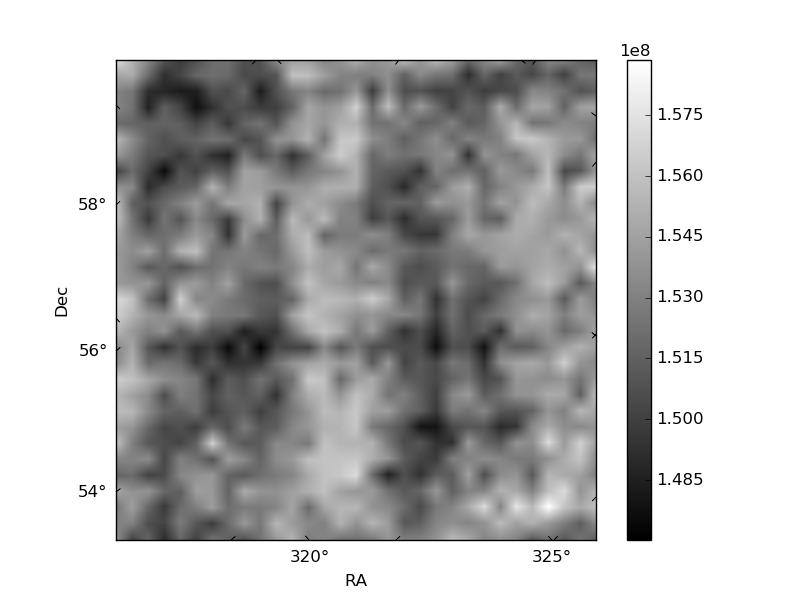
Histogram calculated using DETX and DETY for each event in the final _common_clean file
| Quadrant A | 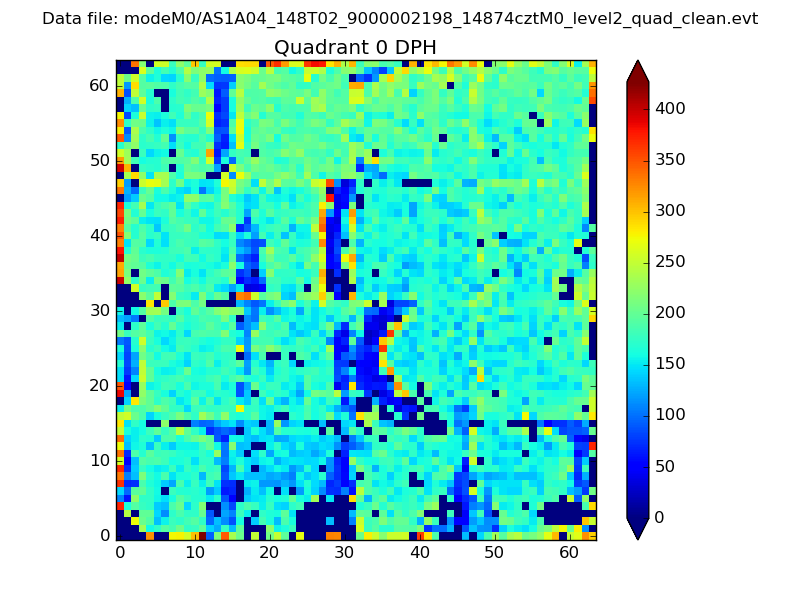 |
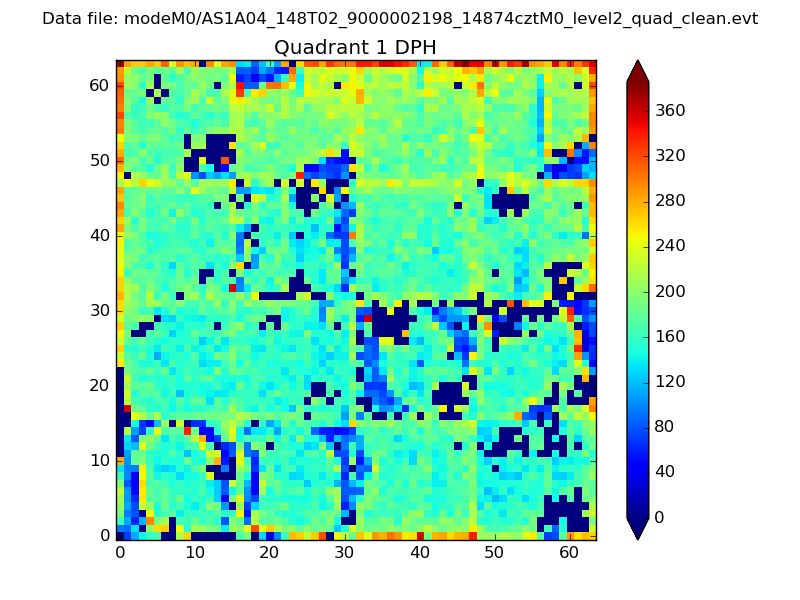 |
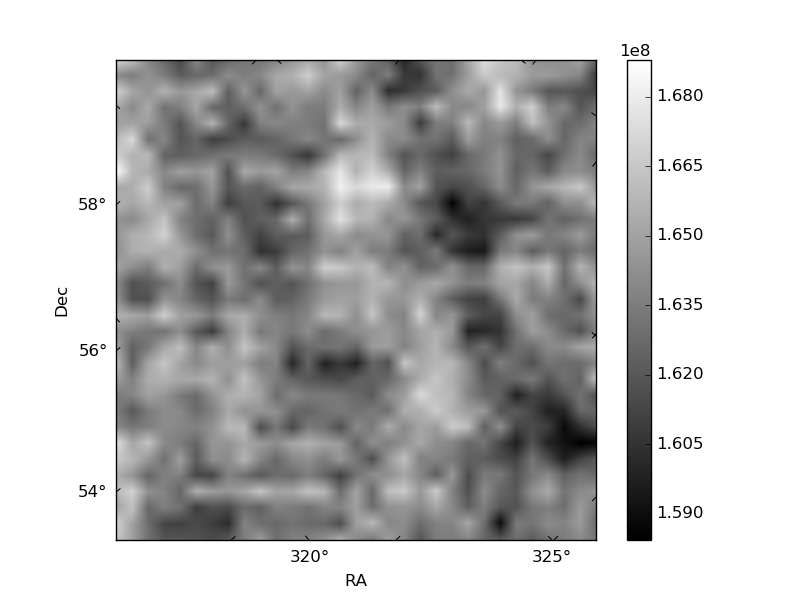
Quadrant B |
|---|---|---|---|
| Quadrant D | 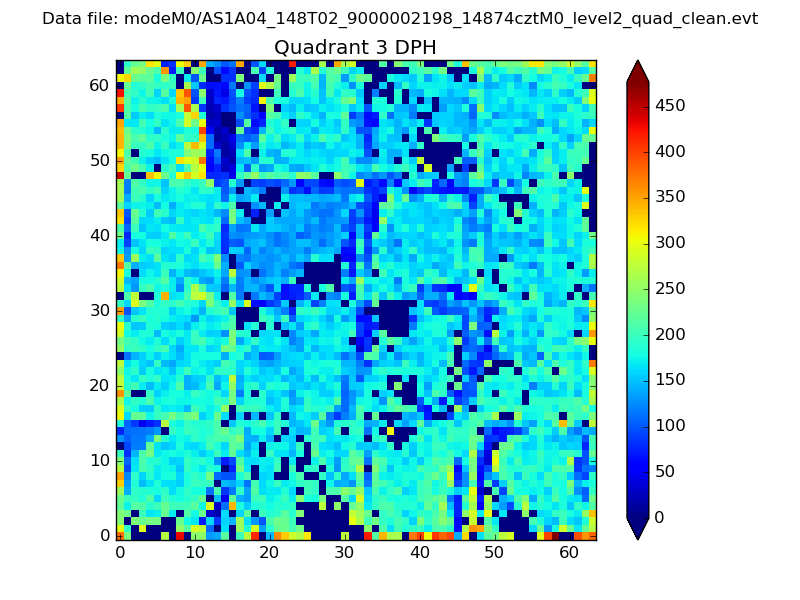 |
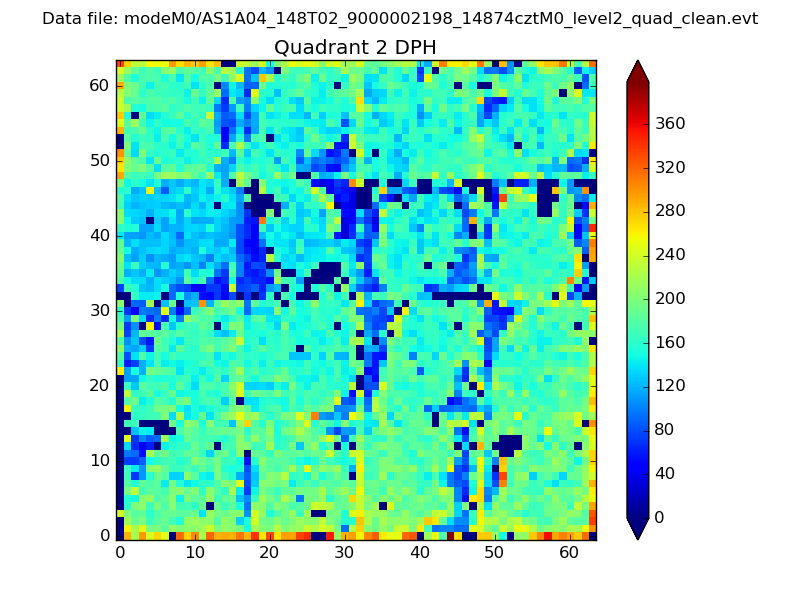 |
Quadrant C |
| Plot type | Count rate plots | Images |
|---|---|---|
| Comparison with Poisson distribution Blue bars denote a histogram of data divided into 1 sec bins. Red curve is a Poisson curve with rate = median count rate of data. |
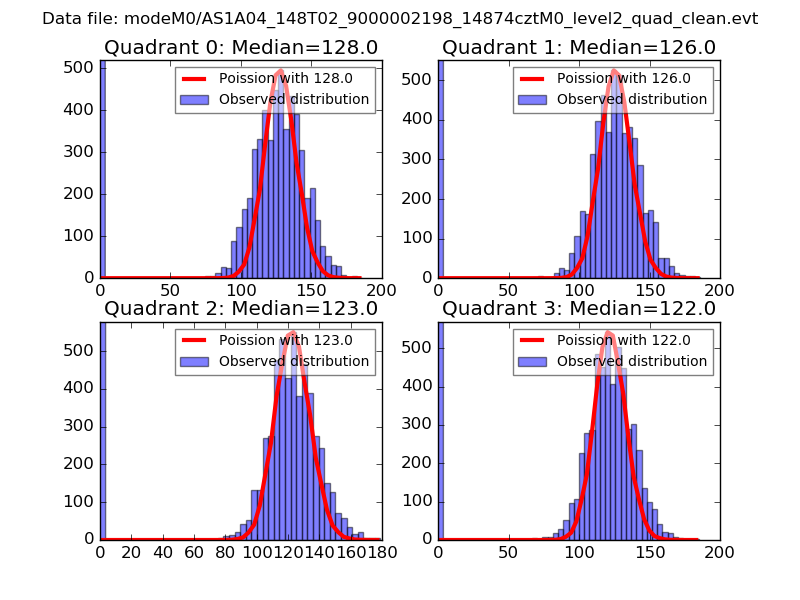 |
 |
| Quadrant-wise count rates Data is divided into 100 sec bins |
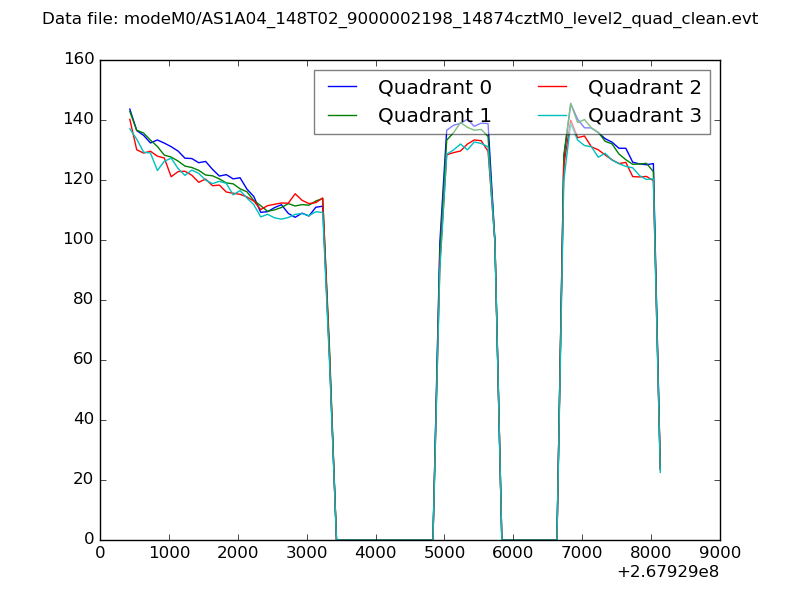 |
|
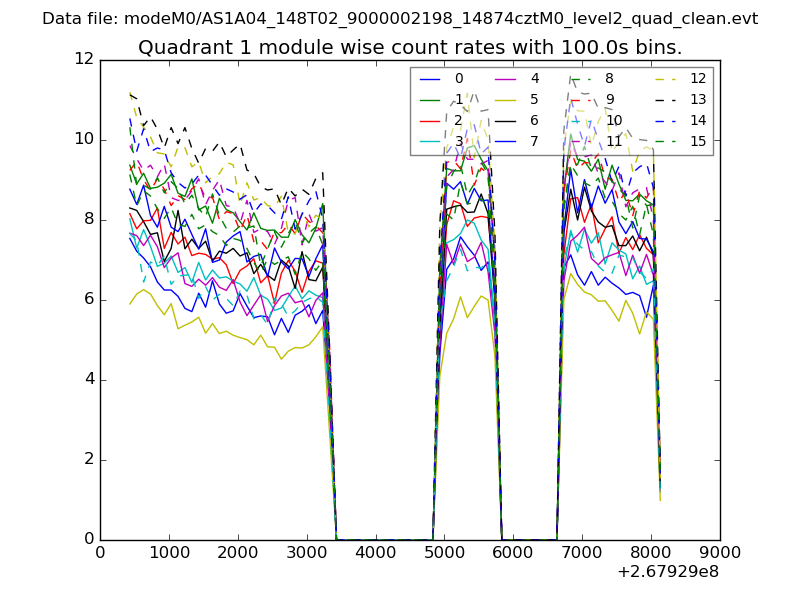
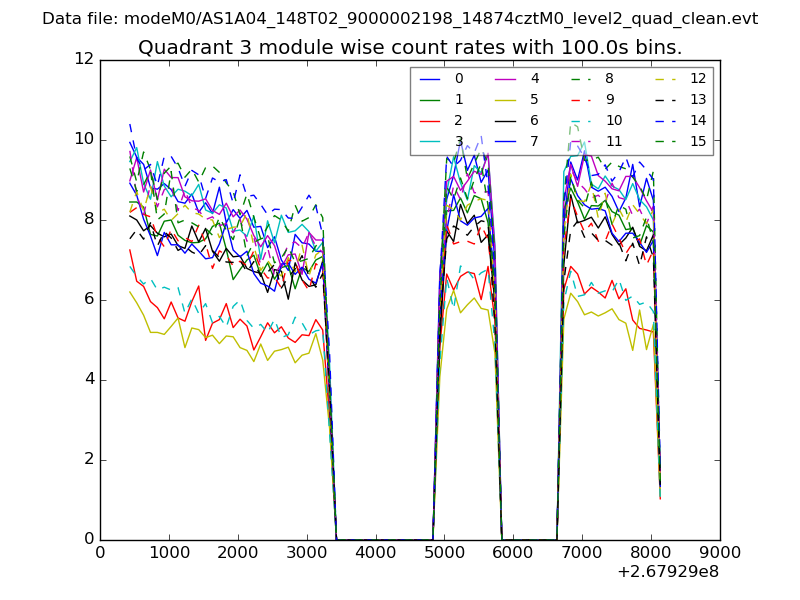
| Module-wise count rates for Quadrant A Data is divided into 100 sec bins |
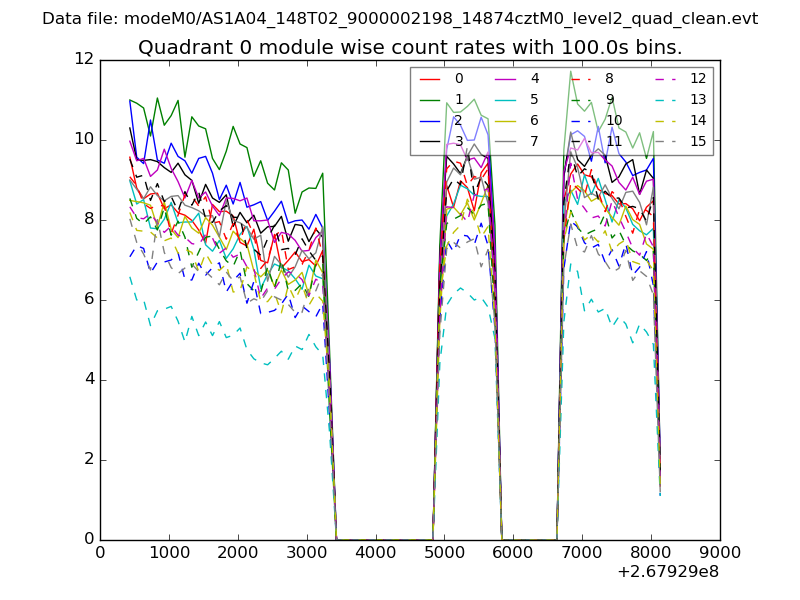 |
 |
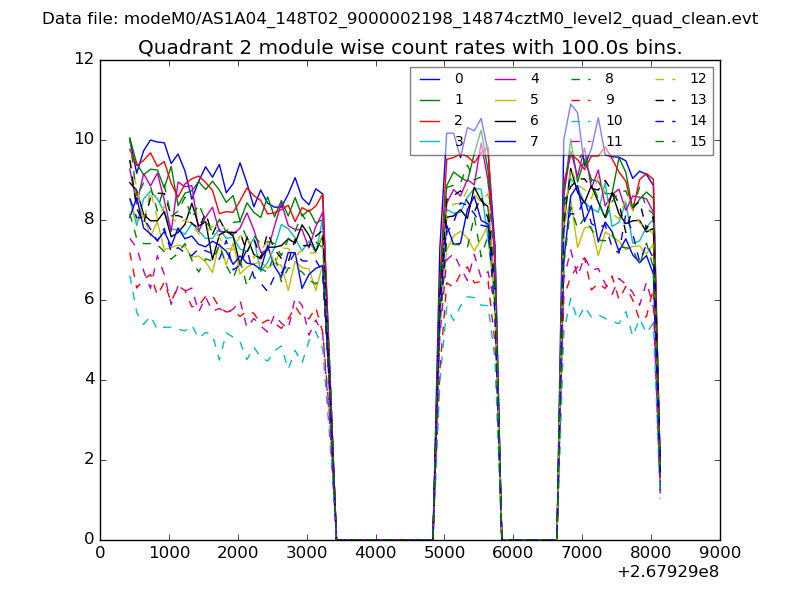
| Module-wise count rates for Quadrant B Data is divided into 100 sec bins |
 |
 |
| Module-wise count rates for Quadrant C Data is divided into 100 sec bins |
 |
 |
| Module-wise count rates for Quadrant D Data is divided into 100 sec bins |
 |
 |
| Parameter | Plot |
|---|---|
| CZT HV Monitor | 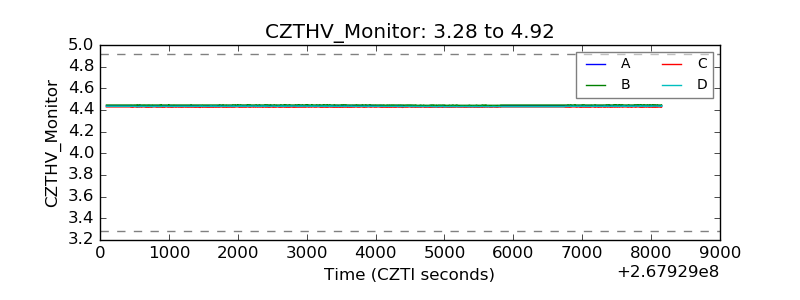 |
| D_VDD | 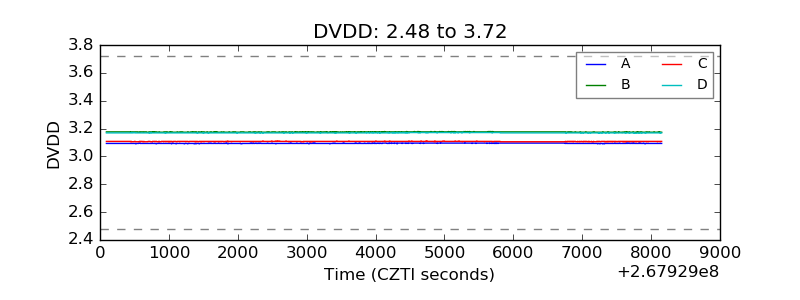 |
| Temperature 1 | 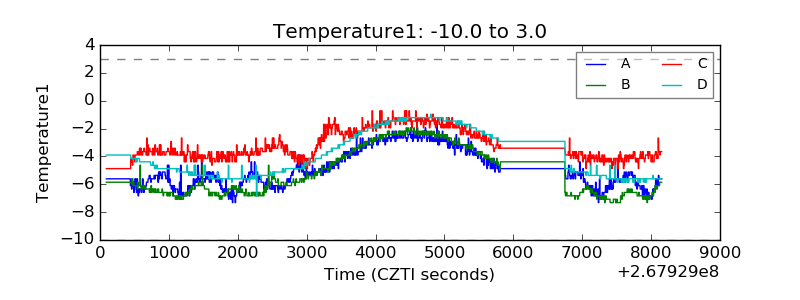 |
| Veto HV Monitor | 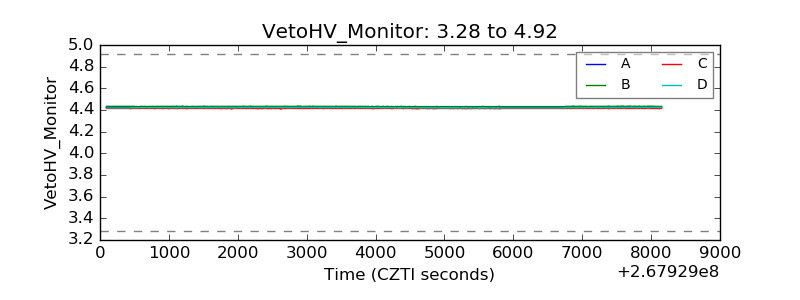 |
| Veto LLD | 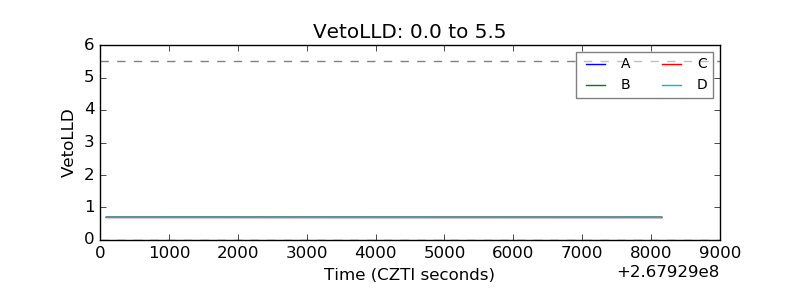 |
| Alpha Counter | 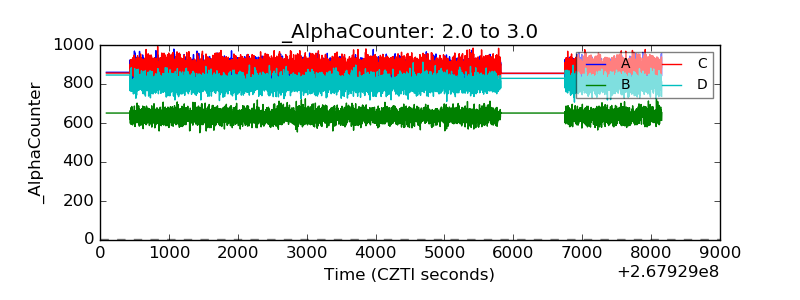 |
| _CPM_Rate | 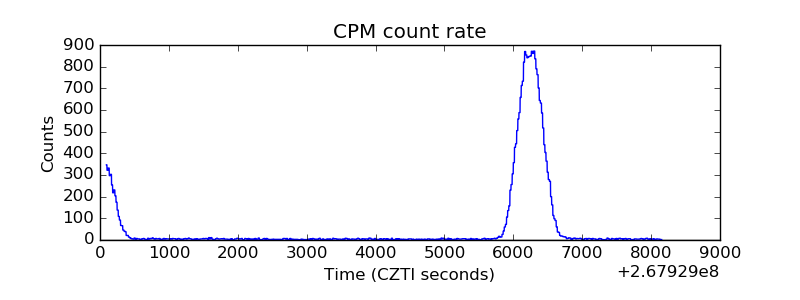 |
| CZT Counter | 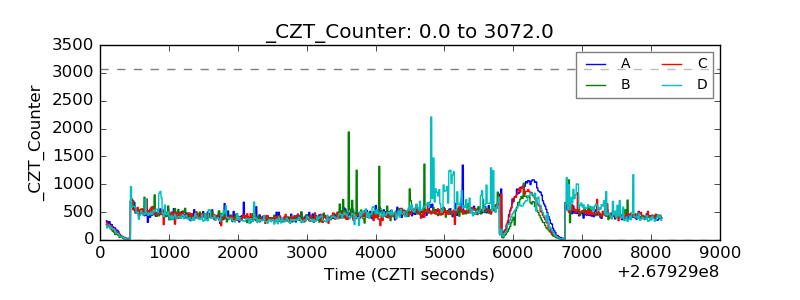 |
| +2.5 Volts monitor |  |
| +5 Volts monitor |  |
| _ROLL_ROT | 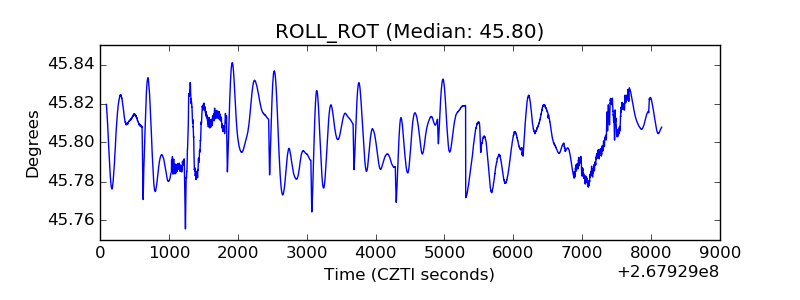 |
| _Roll_DEC | 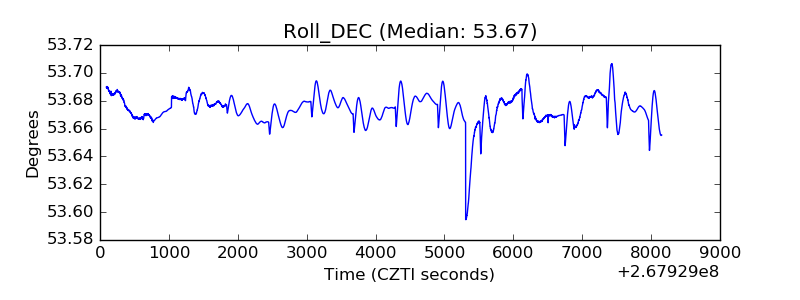 |
| _Roll_RA | 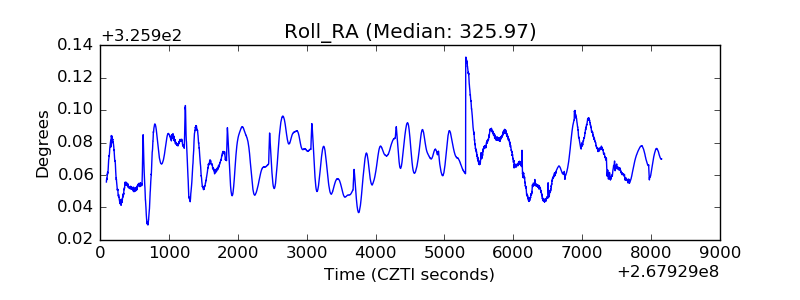 |
| Veto Counter | 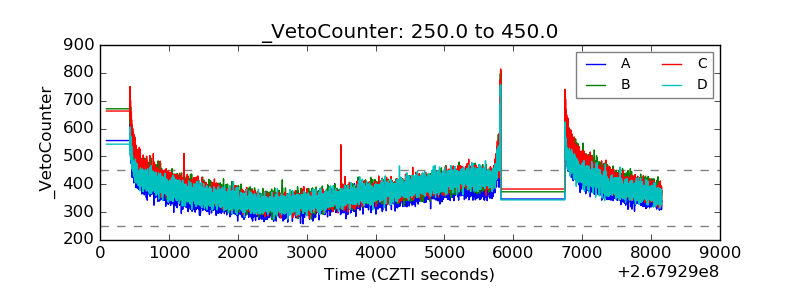 |