| Param | Original file | Final file |
|---|---|---|
| Filename | modeM0/AS1A04_148T02_9000002198_14877cztM0_level2.evt | modeM0/AS1A04_148T02_9000002198_14877cztM0_level2_quad_clean.evt |
| Size (bytes) | 273,960,000 | 52,056,000 |
| Size | 261.3 MB | 49.6 MB |
| Events in quadrant A | 1,880,891 | 328,090 |
| Events in quadrant B | 2,154,614 | 328,613 |
| Events in quadrant C | 1,846,679 | 317,372 |
| Events in quadrant D | 2,136,052 | 314,298 |
| Mode SS | |||
|---|---|---|---|
| Quadrant | BADHDUFLAG | Total packets | Discarded packets |
| A | 0 | 82 | 0 |
| B | 0 | 82 | 0 |
| C | 0 | 82 | 0 |
| D | 0 | 82 | 0 |
| Mode M0 | |||
|---|---|---|---|
| Quadrant | BADHDUFLAG | Total packets | Discarded packets |
| A | 0 | 8239 | 0 |
| B | 0 | 9089 | 0 |
| C | 0 | 8175 | 0 |
| D | 0 | 9390 | 0 |
| Quadrant | Total seconds | Saturated seconds | Saturation percentage |
|---|---|---|---|
| A | 4076 | 2 | 0.049068% |
| B | 4076 | 8 | 0.196271% |
| C | 4077 | 1 | 0.024528% |
| D | 4077 | 7 | 0.171695% |
Noise dominated data is calculated using 1-second bins in cleaned event files. If a bin has >2000 counts, and if more than 50% of those come from <1% of pixels, then it is considered to be noise-dominated and hence unusable.
| Quadrant | # 1 sec bins | Bins with >0 counts | Bins with >2000 counts | High rate bins dominated by noise | Noise dominated (total time) | Noise dominated (detector-on time) | Marked lightcurve |
|---|---|---|---|---|---|---|---|
| A | 4076 | 4076 | 0 | 0 | 0.00% | 0.00% | 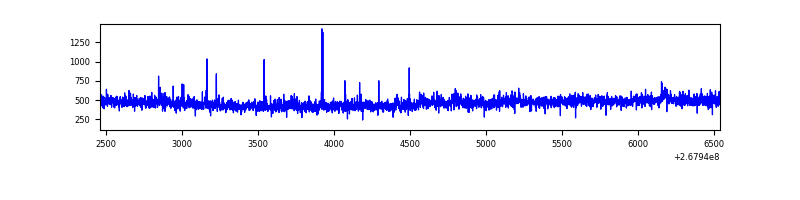 |
| B | 4076 | 4076 | 1 | 1 | 0.02% | 0.02% | 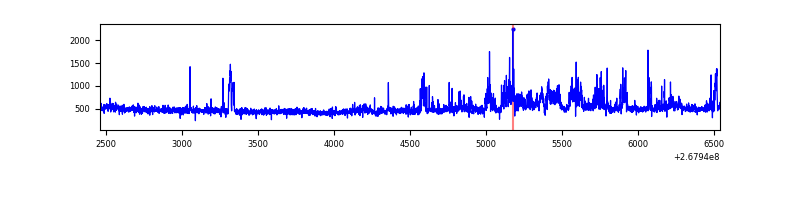 |
| C | 4077 | 4077 | 0 | 0 | 0.00% | 0.00% | 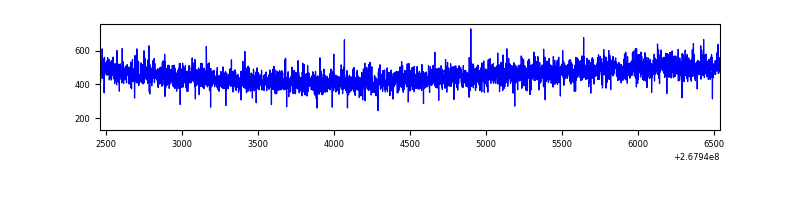 |
| D | 4077 | 4077 | 1 | 1 | 0.02% | 0.02% | 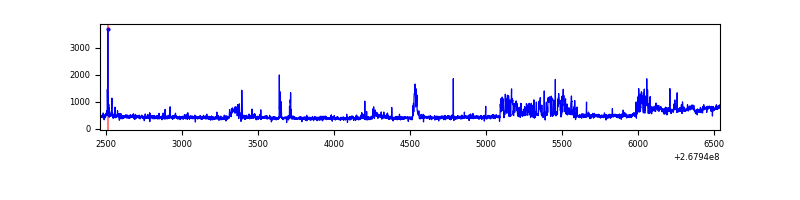 |
Top three noisy pixels from each quadrant. If the there are fewer than three noisy pixels in the level2.evt file, extra rows are filled as -1
| Pixel properties | Quadrant properties | ||||||
|---|---|---|---|---|---|---|---|
| Quadrant | DetID | PixID | Counts | Sigma | Mean | Median | Sigma |
| A | 12 | 189 | 46643 | 483.24 | 472 | 463 | 95.6 |
| A | 9 | 143 | 11419 | 114.65 | 472 | 463 | 95.6 |
| A | 15 | 239 | 4794 | 45.32 | 472 | 463 | 95.6 |
| B | 0 | 219 | 214742 | 2400.21 | 467 | 456 | 89.3 |
| B | 0 | 189 | 55587 | 617.52 | 467 | 456 | 89.3 |
| B | 10 | 16 | 25875 | 284.72 | 467 | 456 | 89.3 |
| C | 3 | 233 | 99081 | 952.16 | 447 | 448 | 103.6 |
| C | 13 | 61 | 3327 | 27.79 | 447 | 448 | 103.6 |
| C | 0 | 207 | 2532 | 20.11 | 447 | 448 | 103.6 |
| D | 13 | 104 | 408162 | 3502.28 | 449 | 437 | 116.4 |
| D | 2 | 234 | 17688 | 148.18 | 449 | 437 | 116.4 |
| D | 2 | 120 | 12190 | 100.96 | 449 | 437 | 116.4 |
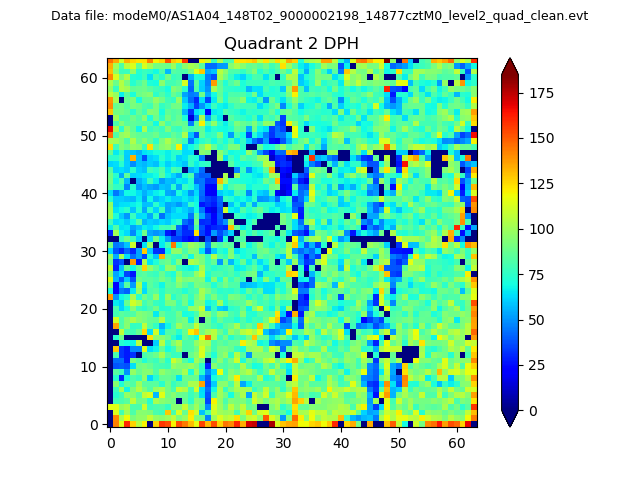
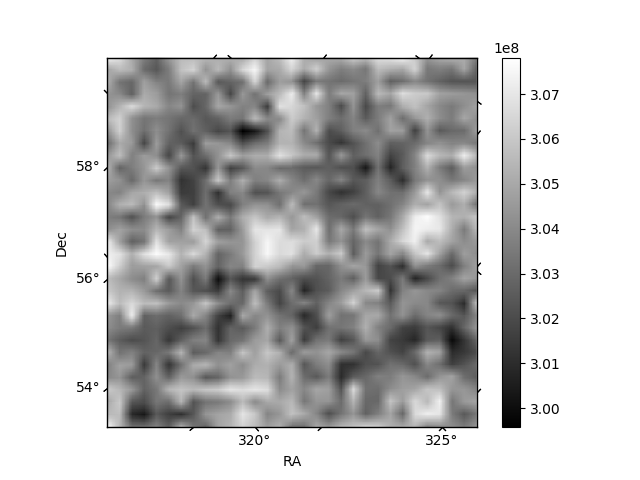
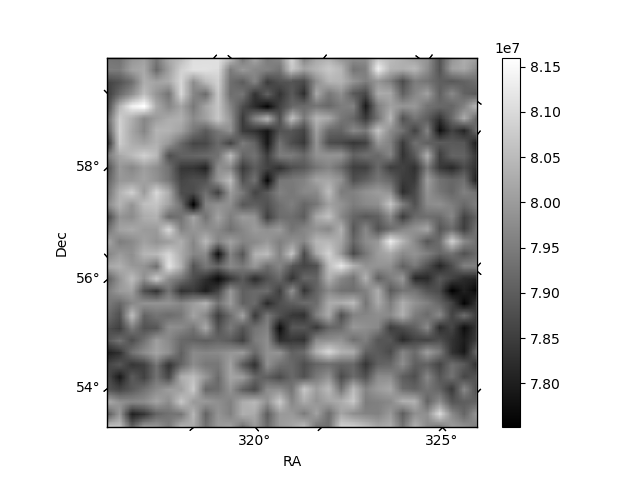
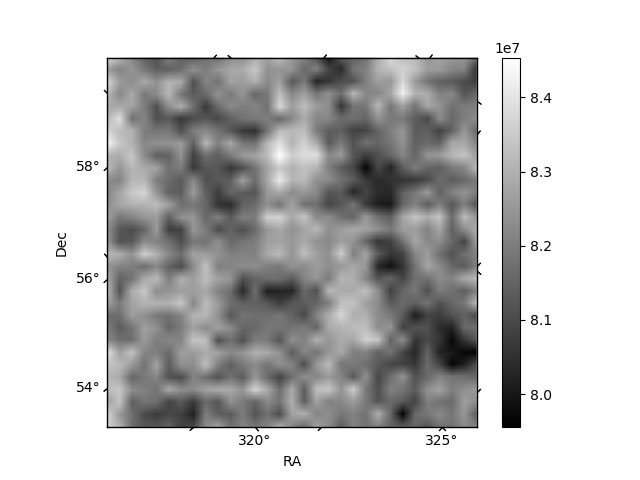
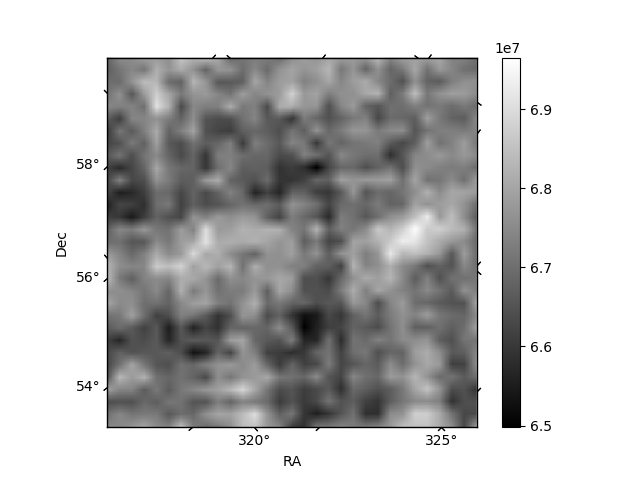
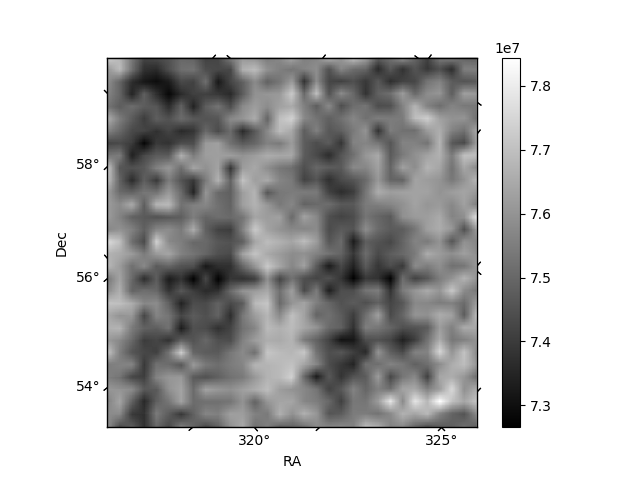
Histogram calculated using DETX and DETY for each event in the final _common_clean file
| Quadrant A | 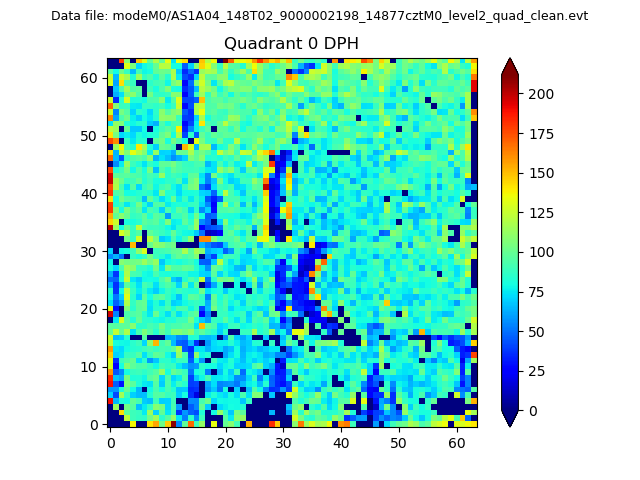 |
 |
Quadrant B |
|---|---|---|---|
| Quadrant D | 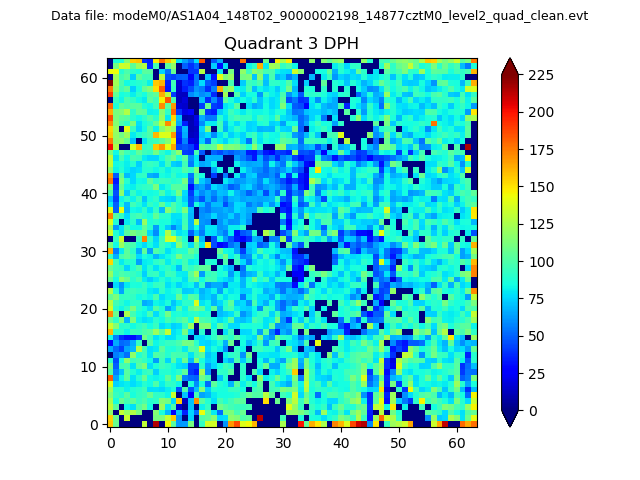 |
 |
Quadrant C |
| Plot type | Count rate plots | Images |
|---|---|---|
| Comparison with Poisson distribution Blue bars denote a histogram of data divided into 1 sec bins. Red curve is a Poisson curve with rate = median count rate of data. |
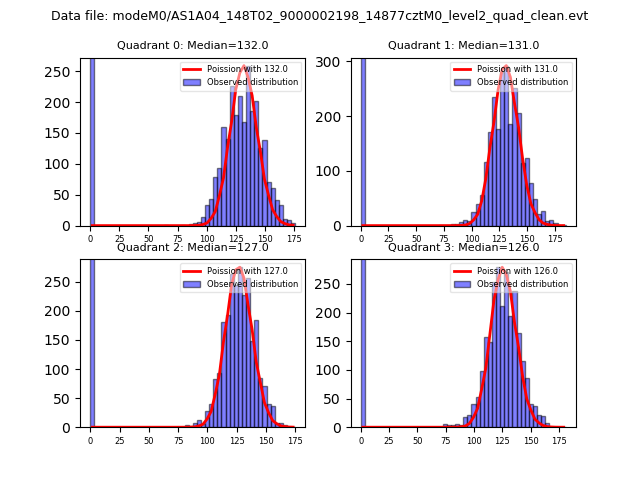 |
 |
| Quadrant-wise count rates Data is divided into 100 sec bins |
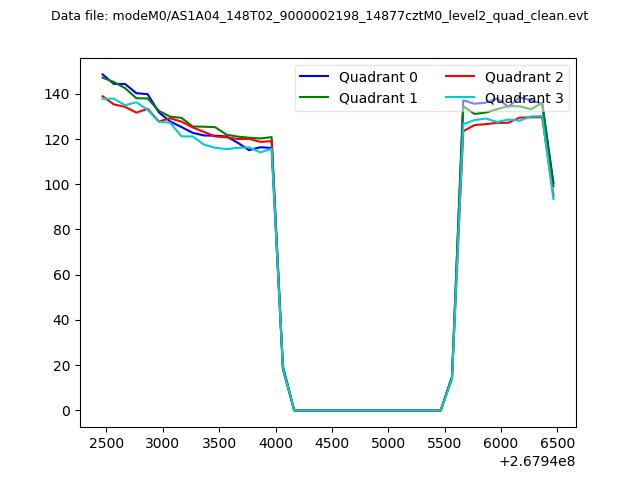 |
|
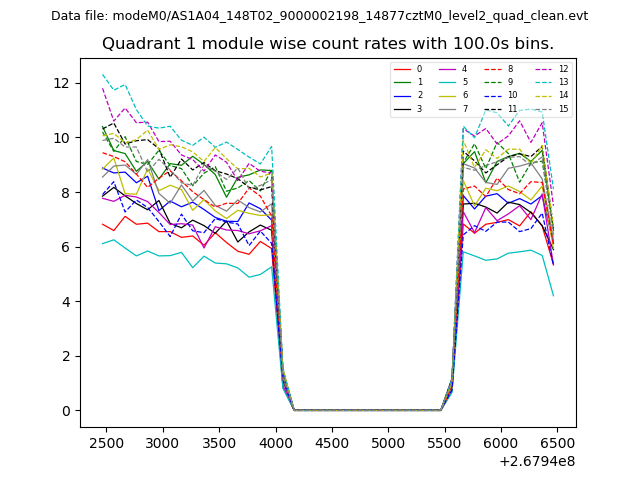
| Module-wise count rates for Quadrant A Data is divided into 100 sec bins |
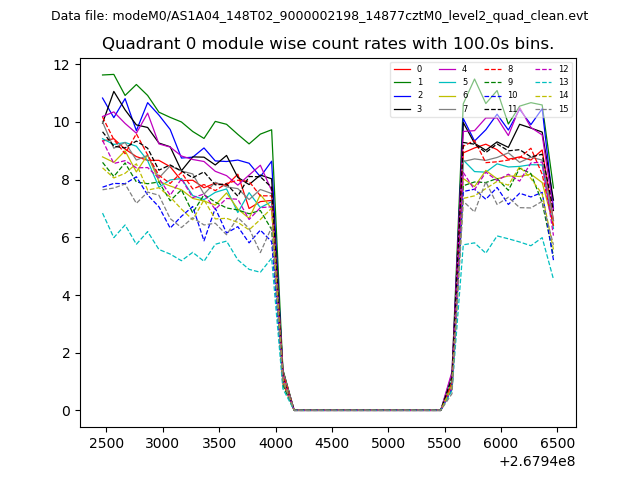 |
 |
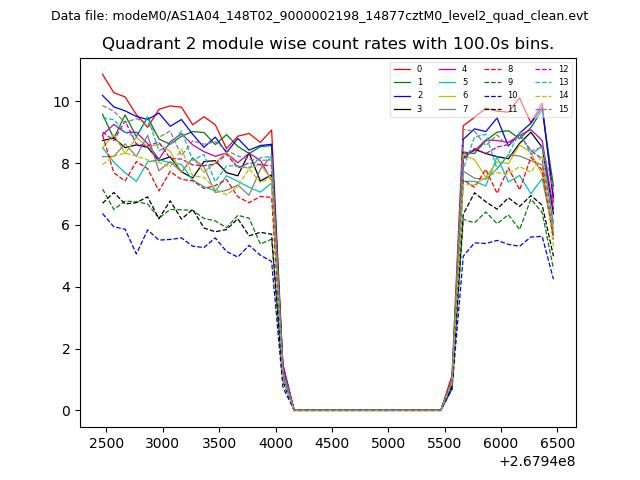
| Module-wise count rates for Quadrant B Data is divided into 100 sec bins |
 |
 |
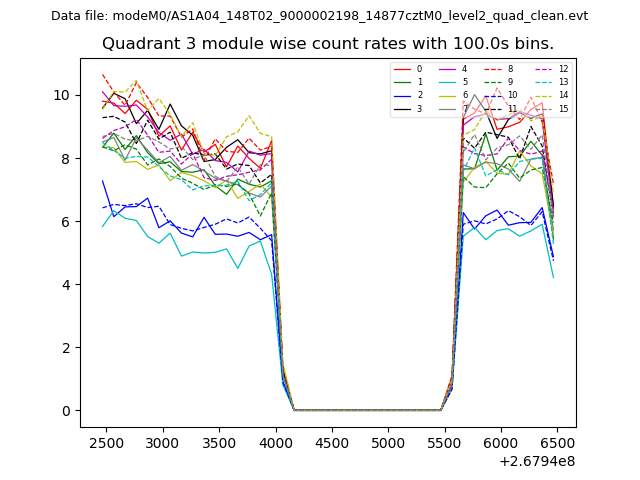
| Module-wise count rates for Quadrant C Data is divided into 100 sec bins |
 |
 |
| Module-wise count rates for Quadrant D Data is divided into 100 sec bins |
 |
 |
| Parameter | Plot |
|---|---|
| CZT HV Monitor | 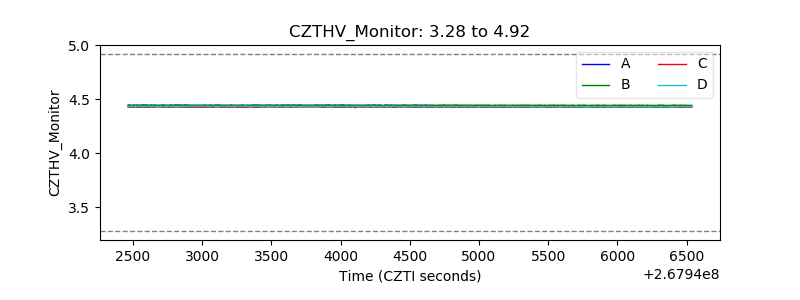 |
| D_VDD | 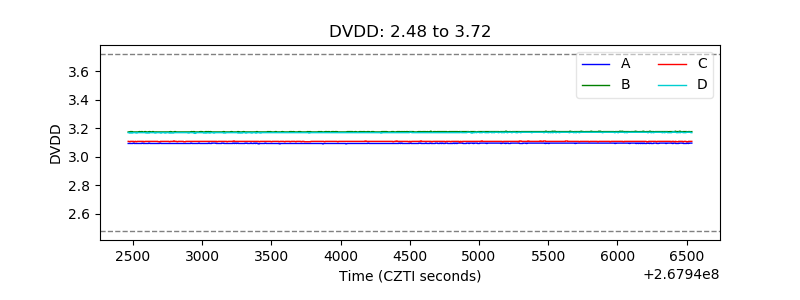 |
| Temperature 1 | 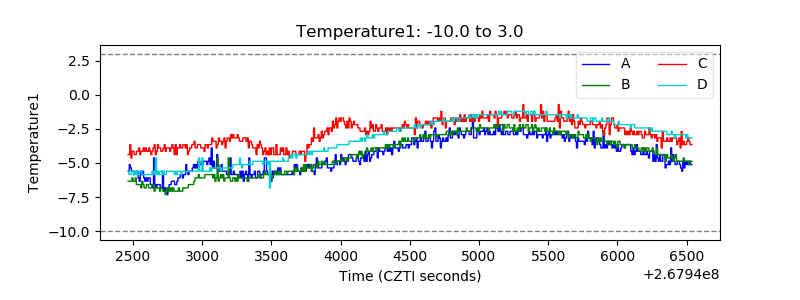 |
| Veto HV Monitor | 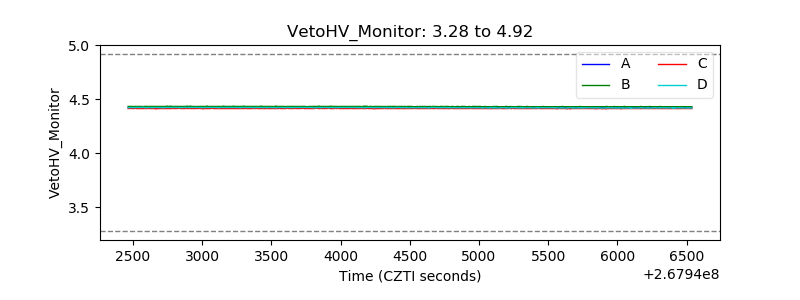 |
| Veto LLD | 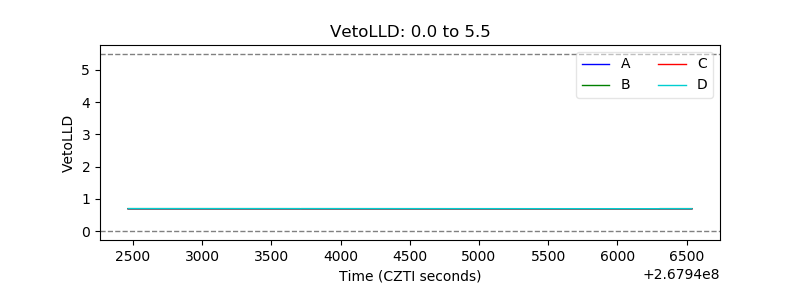 |
| Alpha Counter | 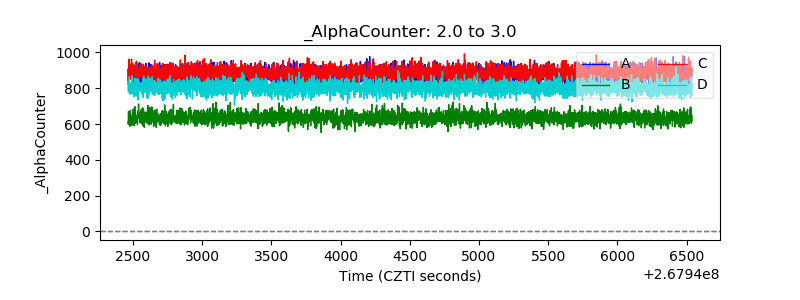 |
| _CPM_Rate | 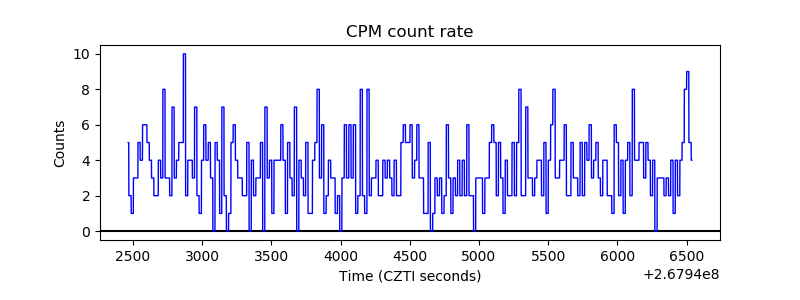 |
| CZT Counter | 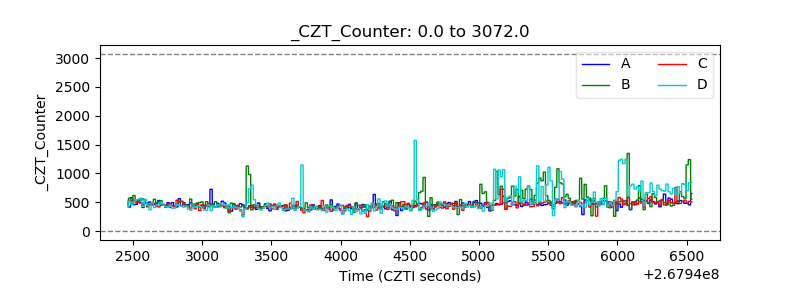 |
| +2.5 Volts monitor |  |
| +5 Volts monitor | 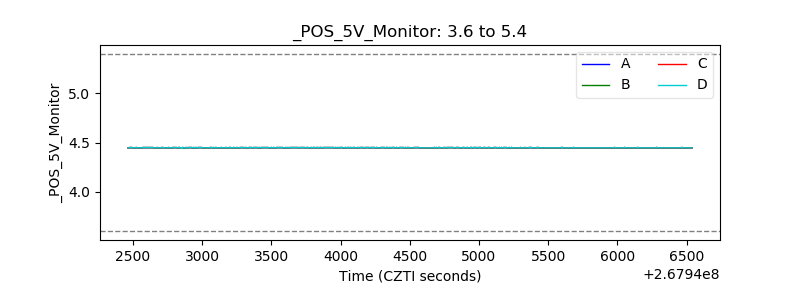 |
| _ROLL_ROT | 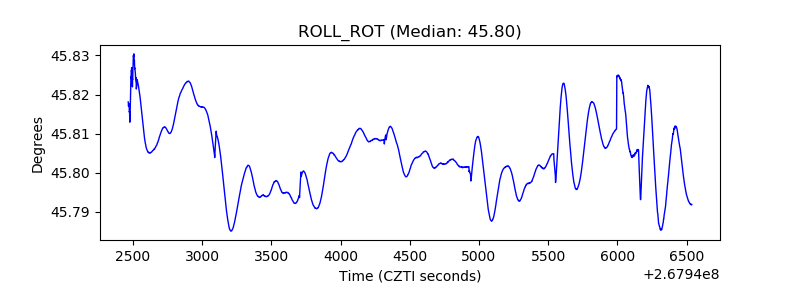 |
| _Roll_DEC | 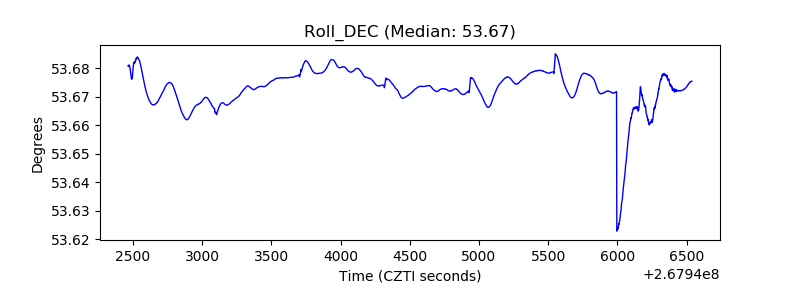 |
| _Roll_RA | 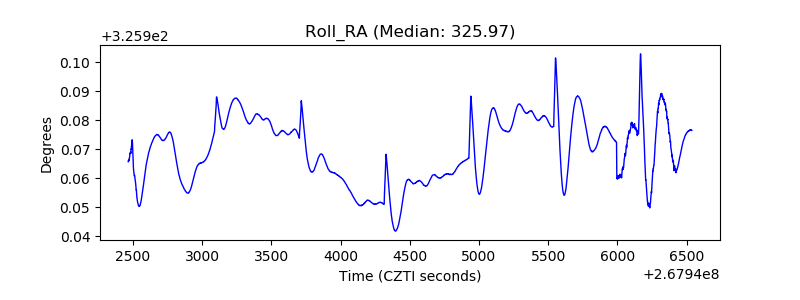 |
| Veto Counter | 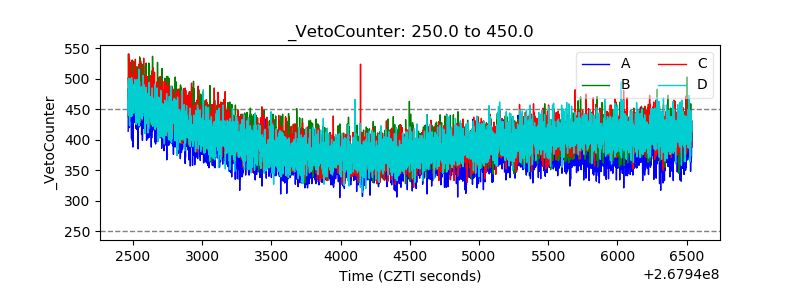 |