| Param | Original file | Final file |
|---|---|---|
| Filename | modeM0/AS1G08_044T01_9000002196cztM0_level2.fits | modeM0/AS1G08_044T01_9000002196cztM0_level2_quad_clean.evt |
| Size (bytes) | 156,553,920 | 155,200,320 |
| Size | 149.3 MB | 148.0 MB |
| Events in quadrant A | 959,480 | 947,764 |
| Events in quadrant B | 912,152 | 936,996 |
| Events in quadrant C | 931,696 | 865,085 |
| Events in quadrant D | 796,682 | 808,957 |
| Mode SS | |||
|---|---|---|---|
| Quadrant | BADHDUFLAG | Total packets | Discarded packets |
| A | 0 | 338 | 0 |
| B | 0 | 338 | 0 |
| C | 0 | 338 | 0 |
| D | 0 | 338 | 0 |
| Mode M0 | |||
|---|---|---|---|
| Quadrant | BADHDUFLAG | Total packets | Discarded packets |
| A | 0 | 34998 | 0 |
| B | 0 | 35336 | 0 |
| C | 0 | 34448 | 0 |
| D | 0 | 44785 | 0 |
| Mode M9 | |||
|---|---|---|---|
| Quadrant | BADHDUFLAG | Total packets | Discarded packets |
| A | 0 | 11 | 0 |
| B | 0 | 11 | 0 |
| C | 0 | 11 | 0 |
| D | 0 | 11 | 0 |
| Quadrant | Total seconds | Saturated seconds | Saturation percentage |
|---|---|---|---|
| A | 16535 | 212 | 1.282129% |
| B | 16535 | 281 | 1.699425% |
| C | 16535 | 167 | 1.009979% |
| D | 16535 | 931 | 5.630481% |
Noise dominated data is calculated using 1-second bins in cleaned event files. If a bin has >2000 counts, and if more than 50% of those come from <1% of pixels, then it is considered to be noise-dominated and hence unusable.
| Quadrant | # 1 sec bins | Bins with >0 counts | Bins with >2000 counts | High rate bins dominated by noise | Noise dominated (total time) | Noise dominated (detector-on time) | Marked lightcurve |
|---|---|---|---|---|---|---|---|
| A | 17770 | 16534 | 0 | 0 | 0.00% | 0.00% |  |
| B | 17770 | 16535 | 0 | 0 | 0.00% | 0.00% |  |
| C | 17770 | 16535 | 0 | 0 | 0.00% | 0.00% |  |
| D | 17770 | 16533 | 0 | 0 | 0.00% | 0.00% | 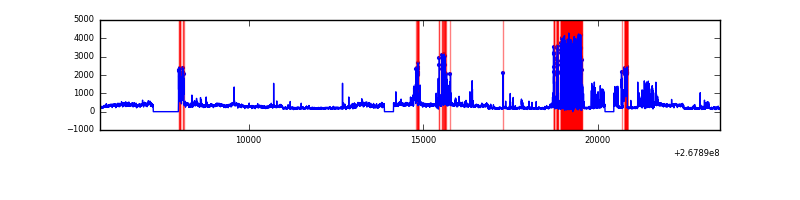 |
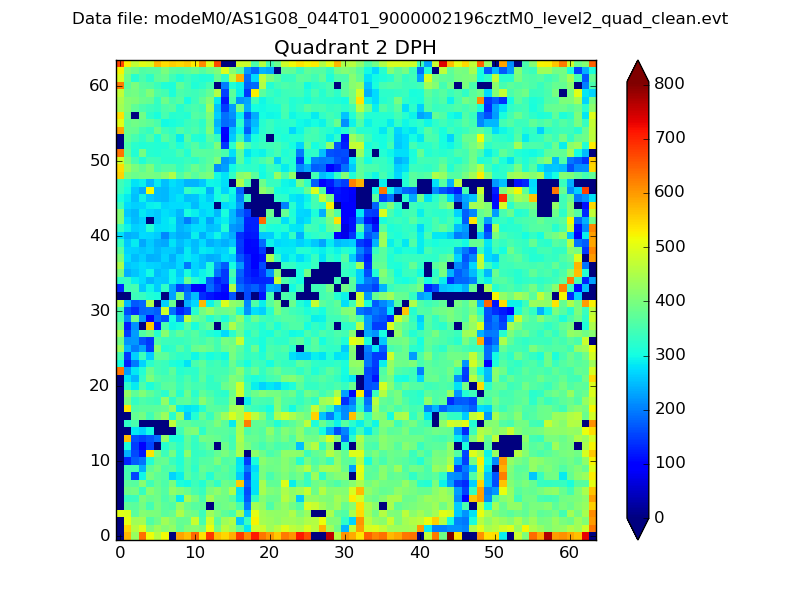
Top three noisy pixels from each quadrant. If the there are fewer than three noisy pixels in the level2.evt file, extra rows are filled as -1
| Pixel properties | Quadrant properties | ||||||
|---|---|---|---|---|---|---|---|
| Quadrant | DetID | PixID | Counts | Sigma | Mean | Median | Sigma |
| A | 0 | 29 | 959 | 11.44 | 248 | 233 | 63.4 |
| A | 14 | 188 | 952 | 11.33 | 248 | 233 | 63.4 |
| A | 14 | 204 | 815 | 9.17 | 248 | 233 | 63.4 |
| B | 2 | 9 | 757 | 10.48 | 240 | 228 | 50.5 |
| B | 3 | 17 | 632 | 8.0 | 240 | 228 | 50.5 |
| B | 12 | 226 | 622 | 7.8 | 240 | 228 | 50.5 |
| C | 1 | 81 | 687 | 7.06 | 245 | 229 | 64.9 |
| C | 12 | 241 | 681 | 6.97 | 245 | 229 | 64.9 |
| C | 1 | 80 | 673 | 6.85 | 245 | 229 | 64.9 |
| D | 6 | 231 | 584 | 6.03 | 226 | 205 | 62.8 |
| D | 6 | 67 | 577 | 5.92 | 226 | 205 | 62.8 |
| D | 3 | 14 | 563 | 5.7 | 226 | 205 | 62.8 |
Histogram calculated using DETX and DETY for each event in the final _common_clean file
| Quadrant A |  |
 |
Quadrant B |
|---|---|---|---|
| Quadrant D | 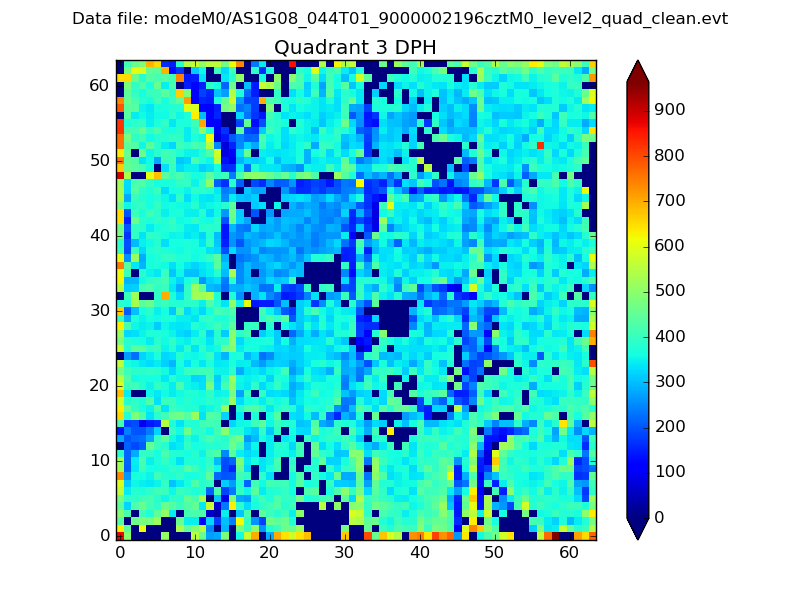 |
 |
Quadrant C |
| Plot type | Count rate plots | Images |
|---|---|---|
| Comparison with Poisson distribution Blue bars denote a histogram of data divided into 1 sec bins. Red curve is a Poisson curve with rate = median count rate of data. |
 |
 |
| Quadrant-wise count rates Data is divided into 100 sec bins |
 |
|
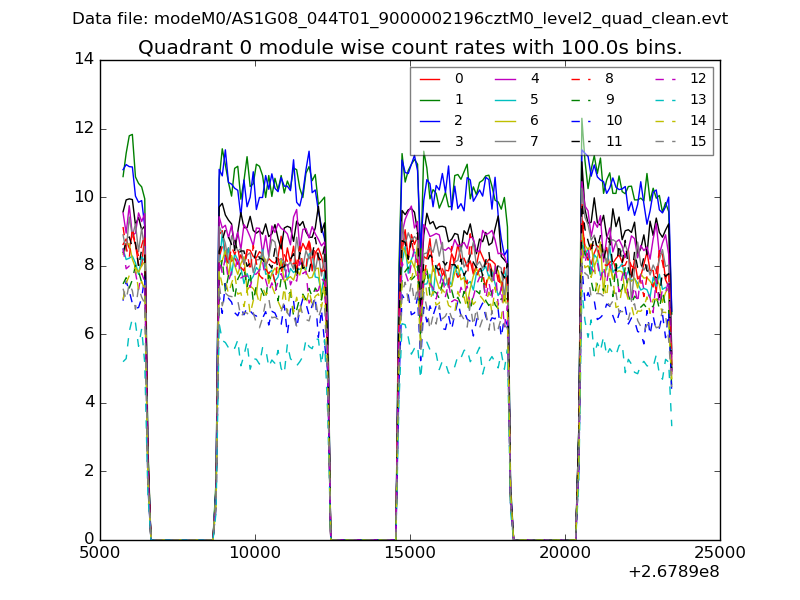
| Module-wise count rates for Quadrant A Data is divided into 100 sec bins |
 |
 |
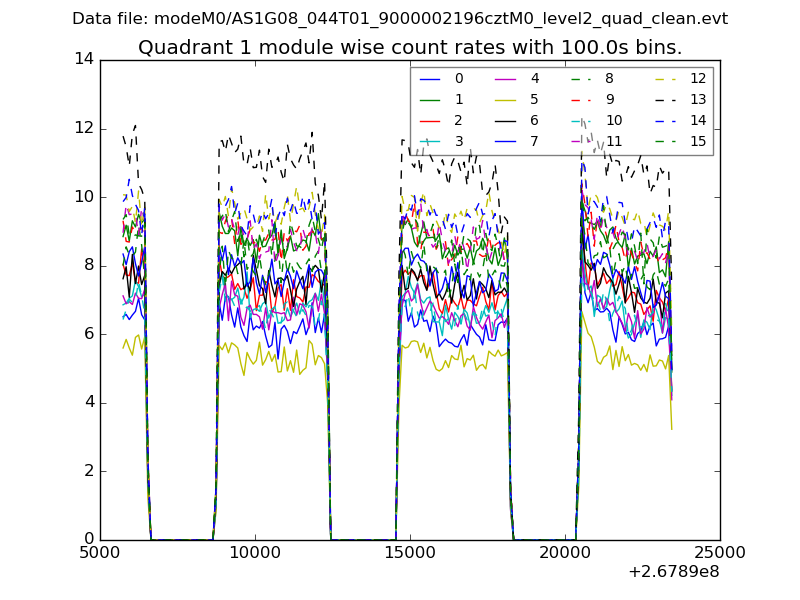
| Module-wise count rates for Quadrant B Data is divided into 100 sec bins |
 |
 |
| Module-wise count rates for Quadrant C Data is divided into 100 sec bins |
 |
 |
| Module-wise count rates for Quadrant D Data is divided into 100 sec bins |
 |
 |
| Parameter | Plot |
|---|---|
| CZT HV Monitor |  |
| D_VDD |  |
| Temperature 1 |  |
| Veto HV Monitor |  |
| Veto LLD |  |
| Alpha Counter |  |
| _CPM_Rate |  |
| CZT Counter |  |
| +2.5 Volts monitor |  |
| +5 Volts monitor |  |
| _ROLL_ROT |  |
| _Roll_DEC |  |
| _Roll_RA | 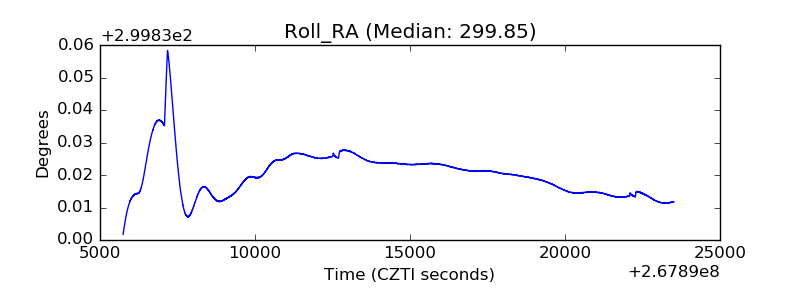 |
| Veto Counter |  |