| Param | Original file | Final file |
|---|---|---|
| Filename | modeM0/AS1G08_044T01_9000002196_14868cztM0_level2.evt | modeM0/AS1G08_044T01_9000002196_14868cztM0_level2_quad_clean.evt |
| Size (bytes) | 224,412,480 | 28,543,680 |
| Size | 214.0 MB | 27.2 MB |
| Events in quadrant A | 1,515,344 | 169,855 |
| Events in quadrant B | 1,549,100 | 169,239 |
| Events in quadrant C | 1,491,950 | 162,907 |
| Events in quadrant D | 2,047,166 | 160,934 |
| Mode SS | |||
|---|---|---|---|
| Quadrant | BADHDUFLAG | Total packets | Discarded packets |
| A | 0 | 58 | 0 |
| B | 0 | 58 | 0 |
| C | 0 | 58 | 0 |
| D | 0 | 58 | 0 |
| Mode M0 | |||
|---|---|---|---|
| Quadrant | BADHDUFLAG | Total packets | Discarded packets |
| A | 0 | 6121 | 2 |
| B | 0 | 6215 | 1 |
| C | 0 | 5973 | 1 |
| D | 0 | 8254 | 1 |
| Mode M9 | |||
|---|---|---|---|
| Quadrant | BADHDUFLAG | Total packets | Discarded packets |
| A | 0 | 7 | 0 |
| B | 0 | 7 | 0 |
| C | 0 | 7 | 0 |
| D | 0 | 7 | 0 |
| Quadrant | Total seconds | Saturated seconds | Saturation percentage |
|---|---|---|---|
| A | 2809 | 57 | 2.029192% |
| B | 2809 | 94 | 3.346387% |
| C | 2809 | 50 | 1.779993% |
| D | 2809 | 198 | 7.048772% |
Noise dominated data is calculated using 1-second bins in cleaned event files. If a bin has >2000 counts, and if more than 50% of those come from <1% of pixels, then it is considered to be noise-dominated and hence unusable.
| Quadrant | # 1 sec bins | Bins with >0 counts | Bins with >2000 counts | High rate bins dominated by noise | Noise dominated (total time) | Noise dominated (detector-on time) | Marked lightcurve |
|---|---|---|---|---|---|---|---|
| A | 3530 | 2811 | 0 | 0 | 0.00% | 0.00% | 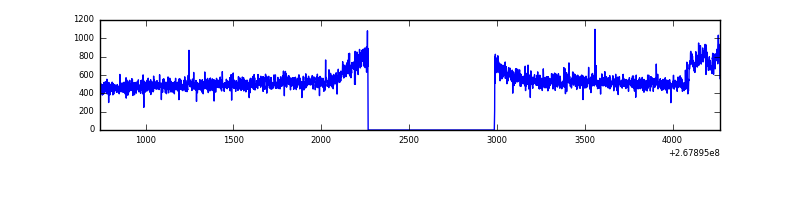 |
| B | 3530 | 2811 | 5 | 5 | 0.14% | 0.18% | 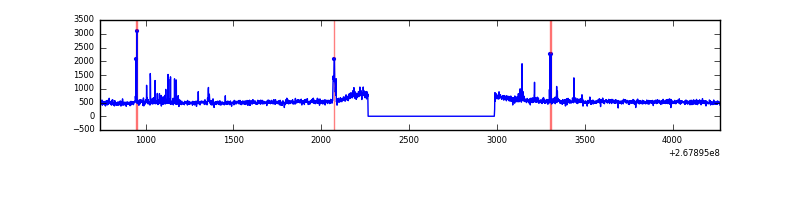 |
| C | 3530 | 2811 | 0 | 0 | 0.00% | 0.00% | 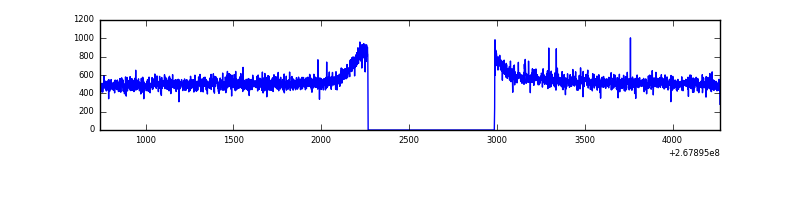 |
| D | 3530 | 2811 | 117 | 117 | 3.31% | 4.16% | 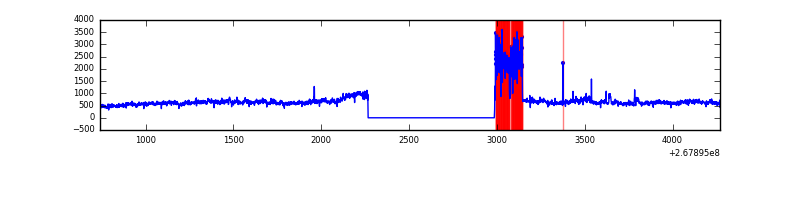 |
Top three noisy pixels from each quadrant. If the there are fewer than three noisy pixels in the level2.evt file, extra rows are filled as -1
| Pixel properties | Quadrant properties | ||||||
|---|---|---|---|---|---|---|---|
| Quadrant | DetID | PixID | Counts | Sigma | Mean | Median | Sigma |
| A | 12 | 189 | 56273 | 722.36 | 373 | 366 | 77.4 |
| A | 15 | 239 | 22454 | 285.4 | 373 | 366 | 77.4 |
| A | 0 | 226 | 3319 | 38.16 | 373 | 366 | 77.4 |
| B | 0 | 219 | 49326 | 667.57 | 366 | 357 | 73.4 |
| B | 3 | 64 | 28200 | 379.57 | 366 | 357 | 73.4 |
| B | 5 | 236 | 14712 | 195.69 | 366 | 357 | 73.4 |
| C | 3 | 233 | 108653 | 1301.36 | 353 | 354 | 83.2 |
| C | 6 | 96 | 2852 | 30.02 | 353 | 354 | 83.2 |
| C | 13 | 61 | 2542 | 26.29 | 353 | 354 | 83.2 |
| D | 13 | 104 | 426352 | 5054.56 | 344 | 335 | 84.3 |
| D | 7 | 254 | 315751 | 3742.32 | 344 | 335 | 84.3 |
| D | 2 | 234 | 10052 | 115.29 | 344 | 335 | 84.3 |
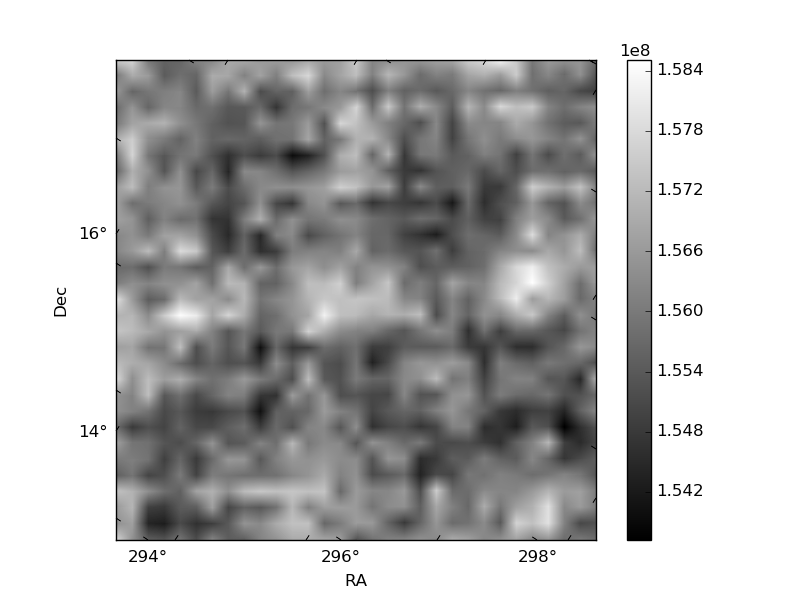
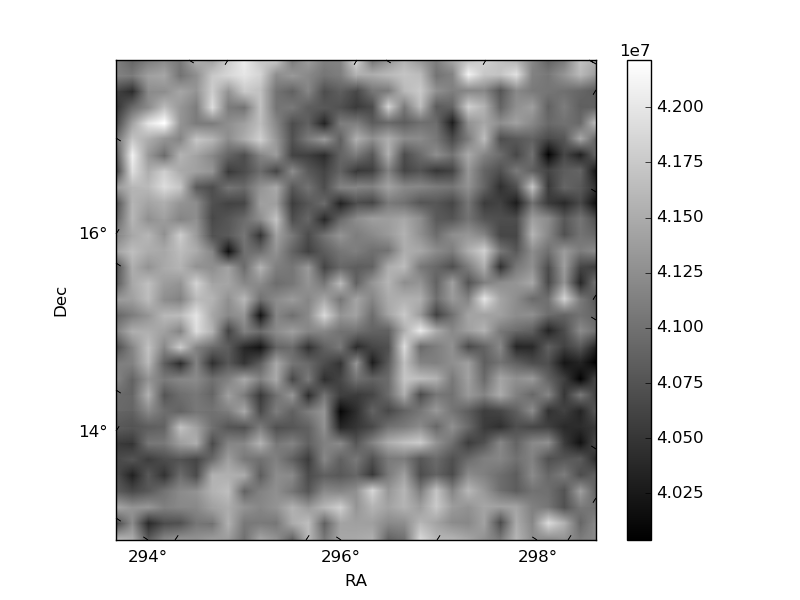
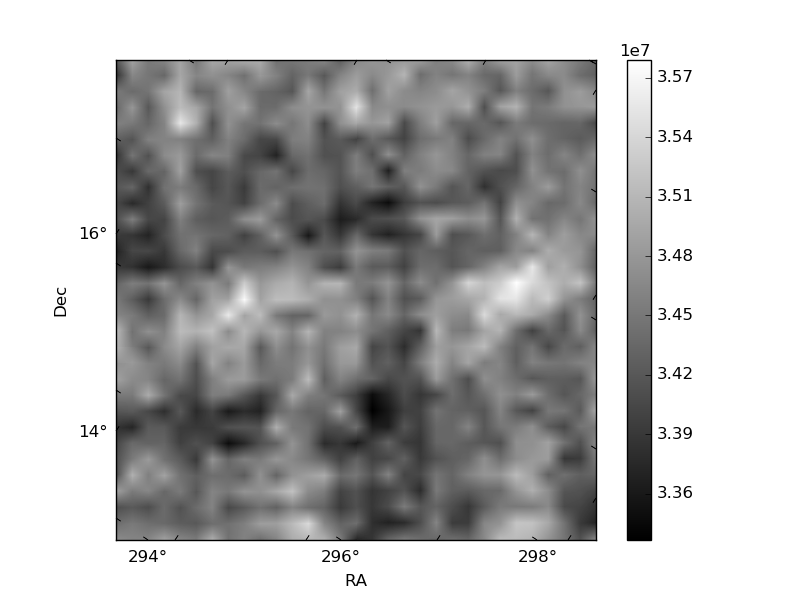
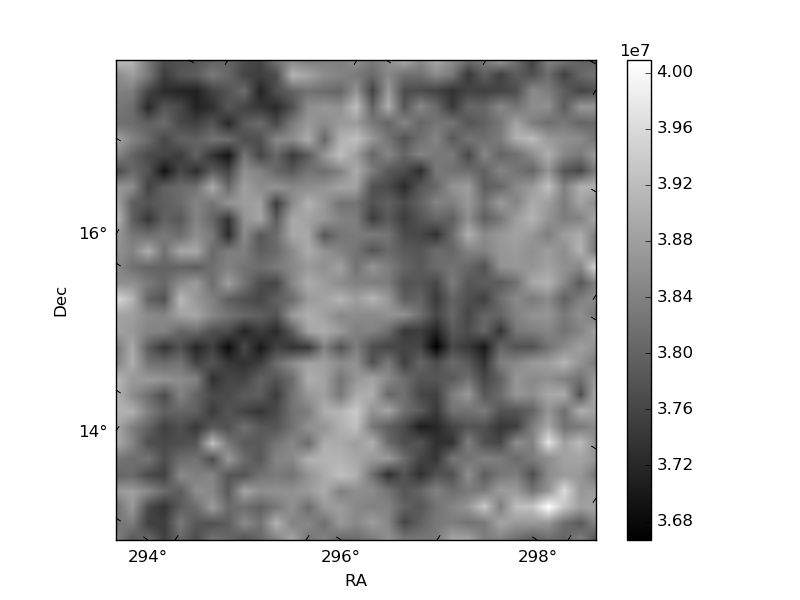
Histogram calculated using DETX and DETY for each event in the final _common_clean file
| Quadrant A | 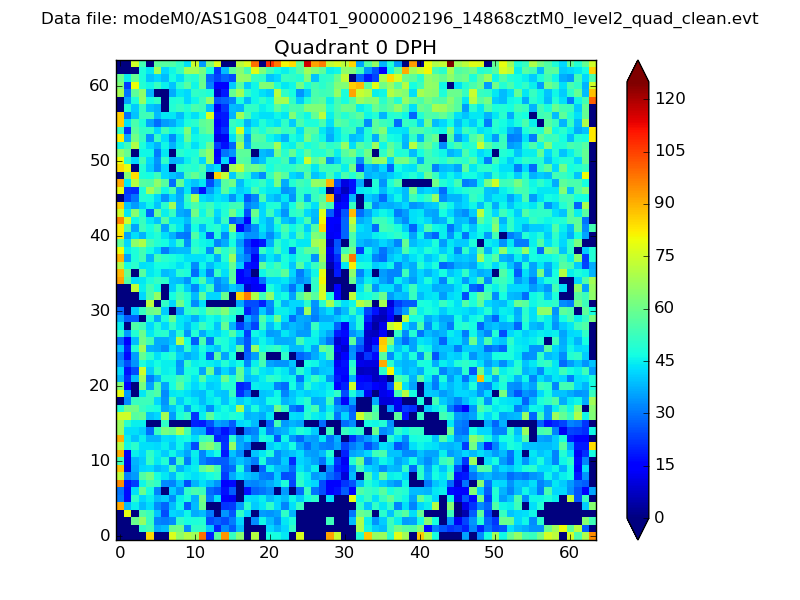 |
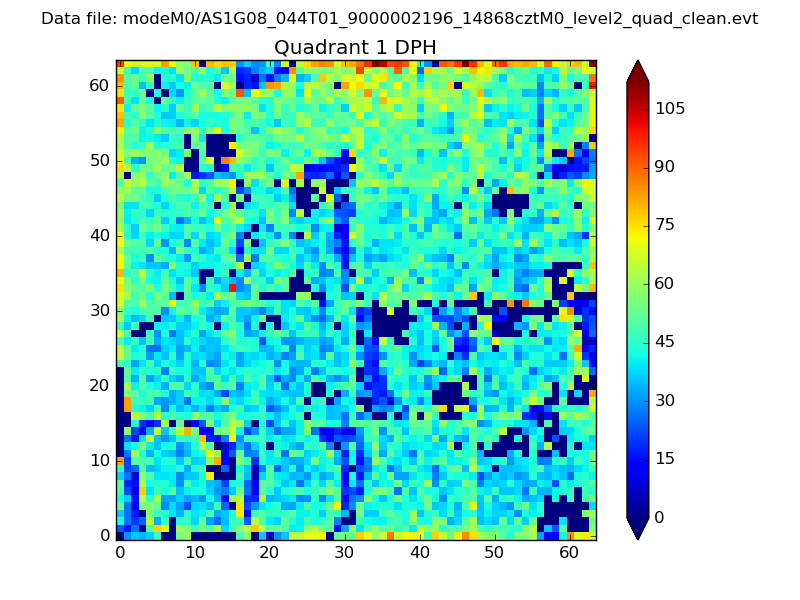 |
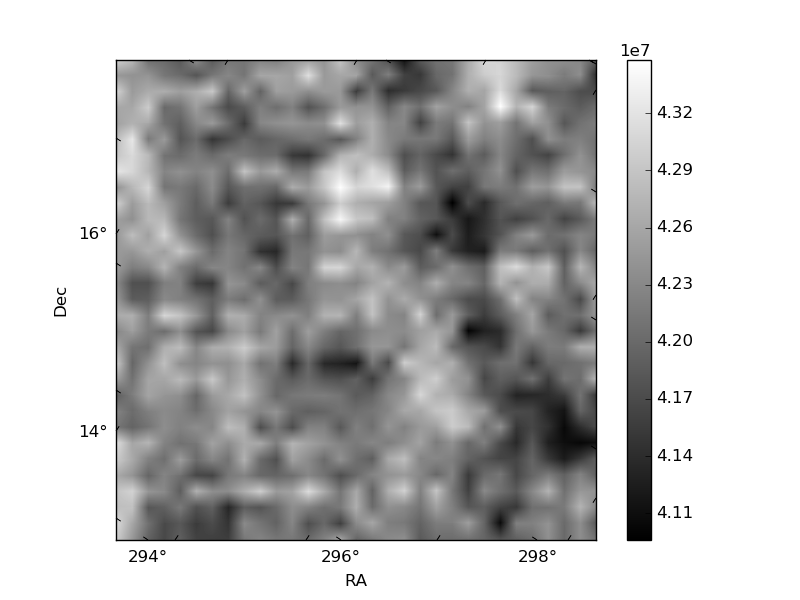
Quadrant B |
|---|---|---|---|
| Quadrant D | 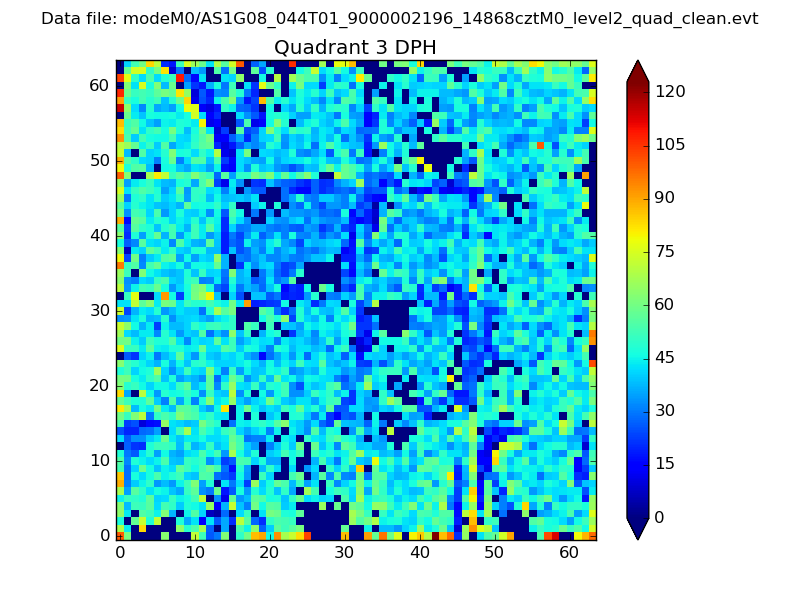 |
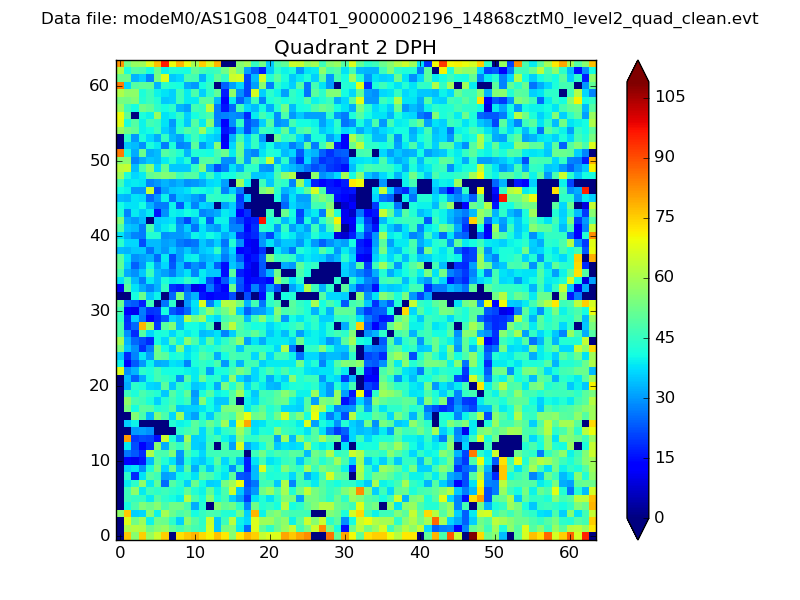 |
Quadrant C |
| Plot type | Count rate plots | Images |
|---|---|---|
| Comparison with Poisson distribution Blue bars denote a histogram of data divided into 1 sec bins. Red curve is a Poisson curve with rate = median count rate of data. |
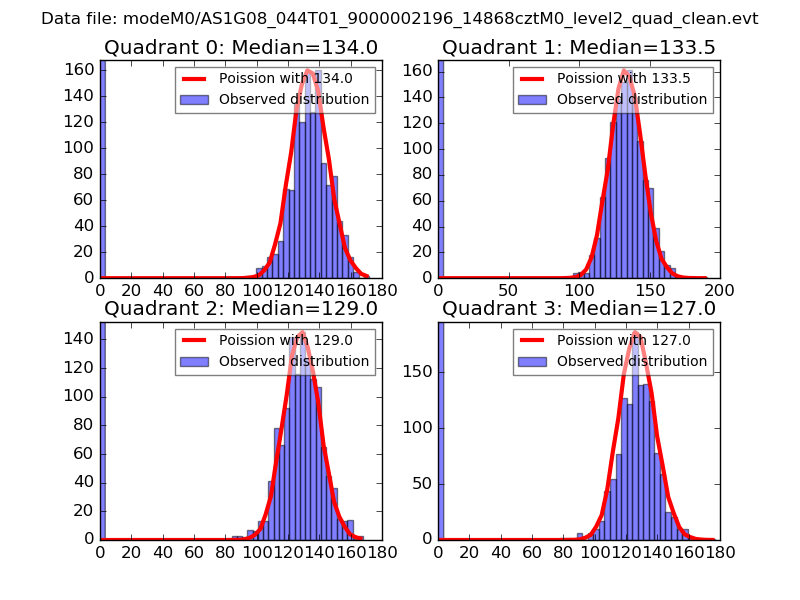 |
 |
| Quadrant-wise count rates Data is divided into 100 sec bins |
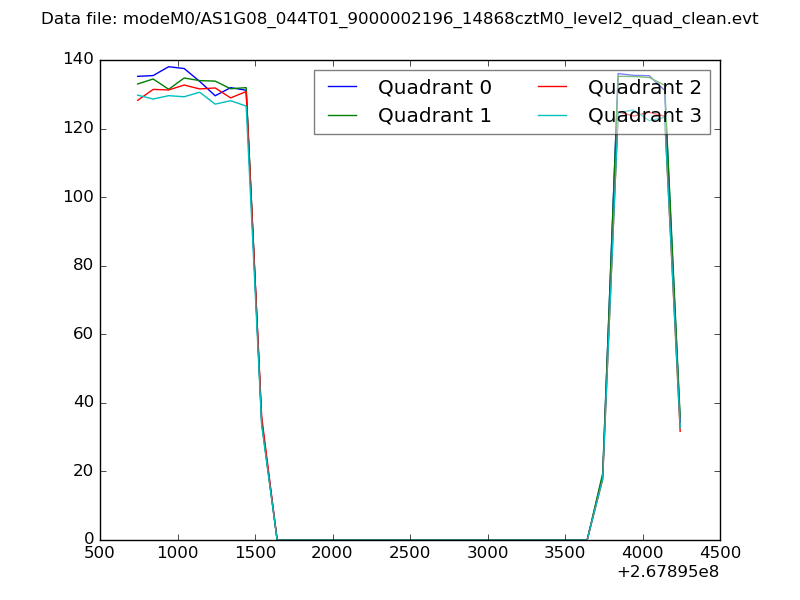 |
|
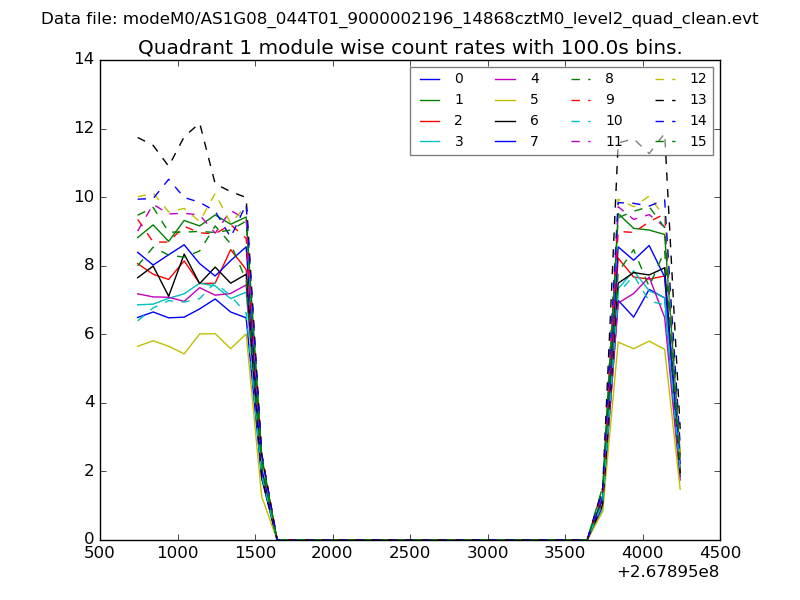
| Module-wise count rates for Quadrant A Data is divided into 100 sec bins |
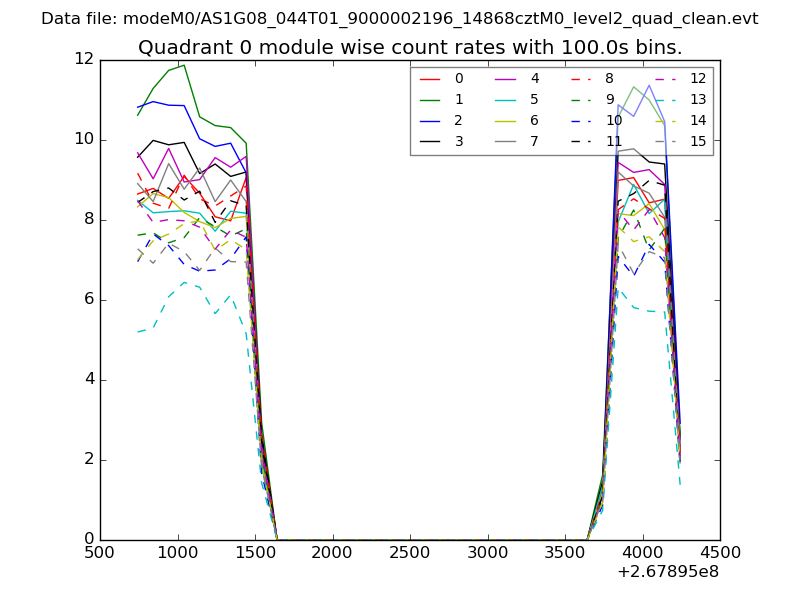 |
 |
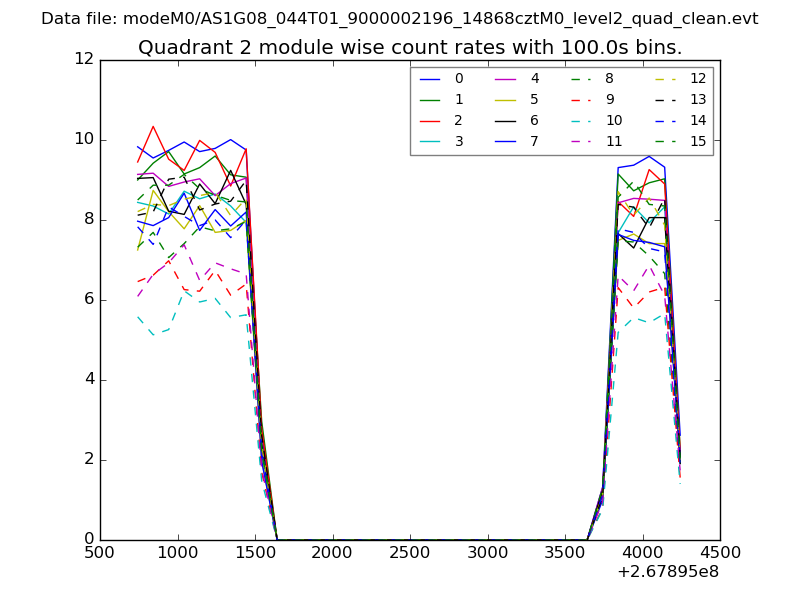
| Module-wise count rates for Quadrant B Data is divided into 100 sec bins |
 |
 |
| Module-wise count rates for Quadrant C Data is divided into 100 sec bins |
 |
 |
| Module-wise count rates for Quadrant D Data is divided into 100 sec bins |
 |
 |
| Parameter | Plot |
|---|---|
| CZT HV Monitor | 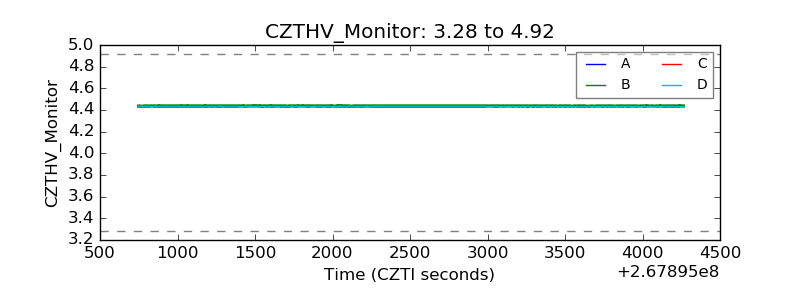 |
| D_VDD | 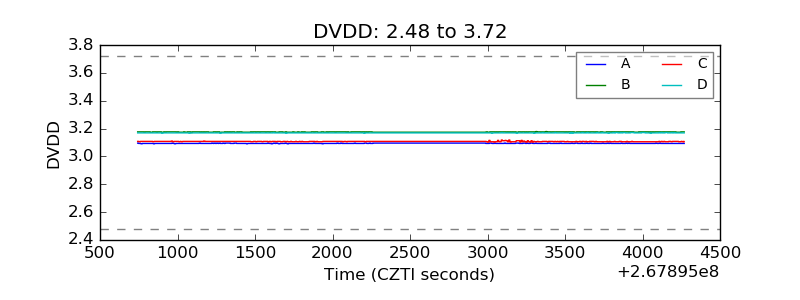 |
| Temperature 1 | 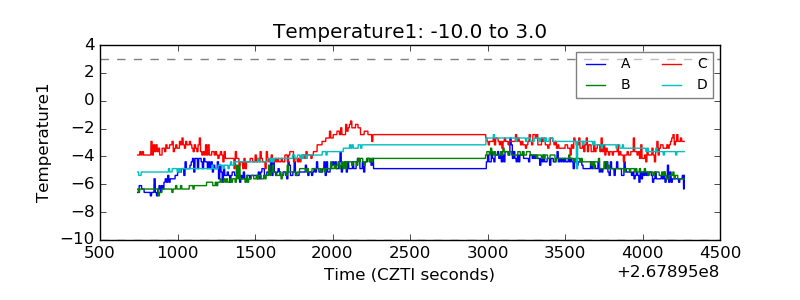 |
| Veto HV Monitor | 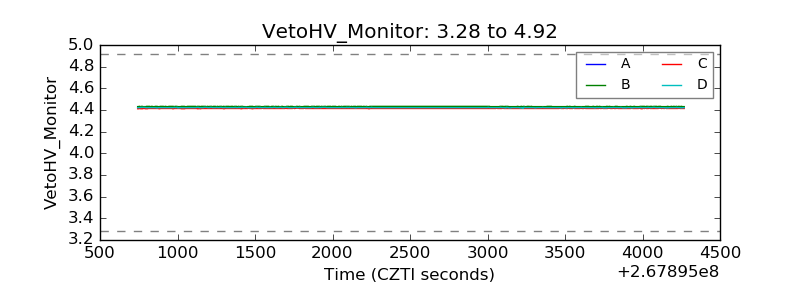 |
| Veto LLD |  |
| Alpha Counter | 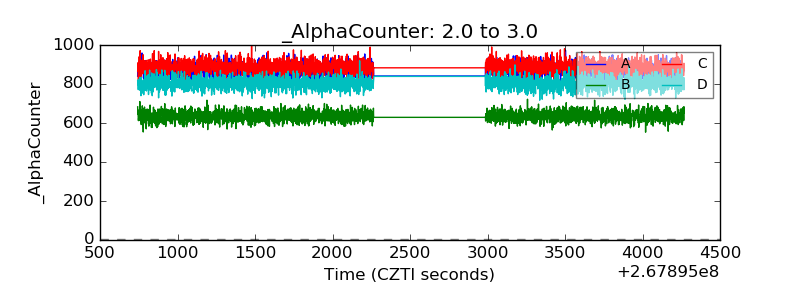 |
| _CPM_Rate | 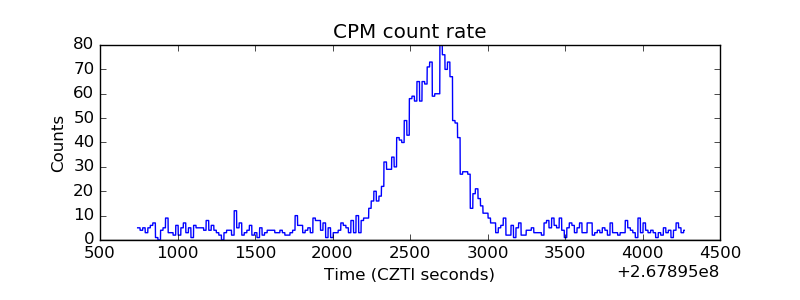 |
| CZT Counter | 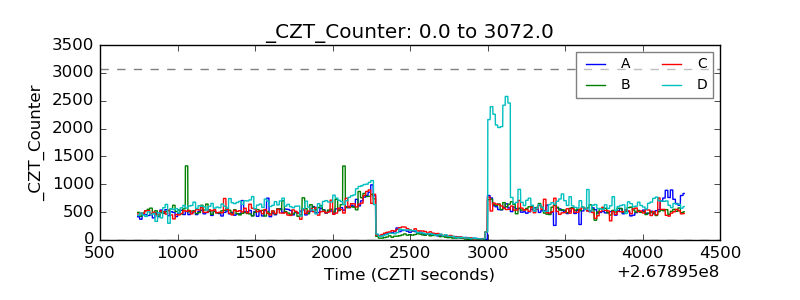 |
| +2.5 Volts monitor |  |
| +5 Volts monitor | 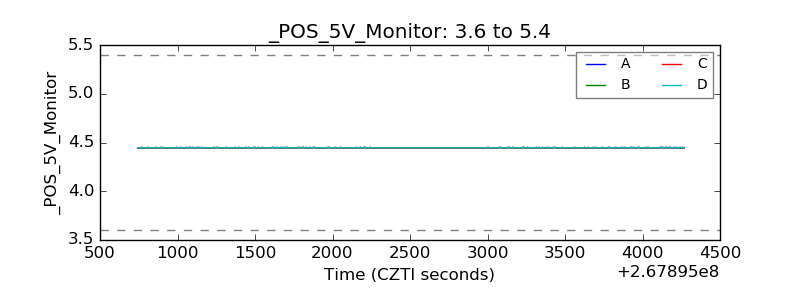 |
| _ROLL_ROT | 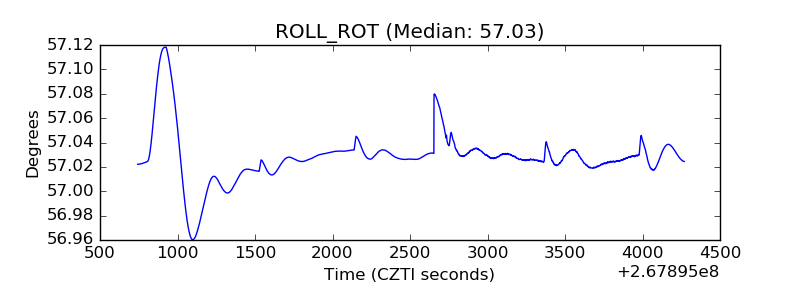 |
| _Roll_DEC | 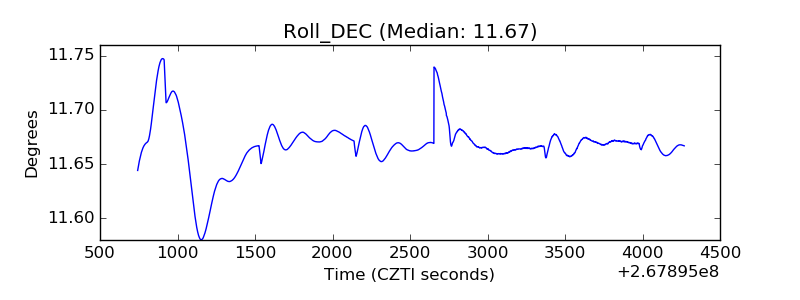 |
| _Roll_RA | 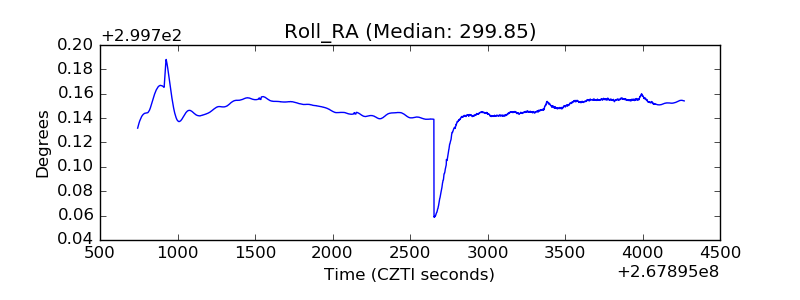 |
| Veto Counter | 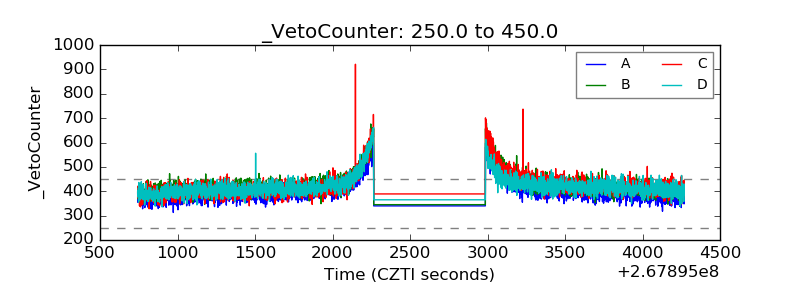 |