| Param | Original file | Final file |
|---|---|---|
| Filename | modeM0/AS1G08_044T01_9000002196_14869cztM0_level2.evt | modeM0/AS1G08_044T01_9000002196_14869cztM0_level2_quad_clean.evt |
| Size (bytes) | 611,988,480 | 95,935,680 |
| Size | 583.6 MB | 91.5 MB |
| Events in quadrant A | 4,285,425 | 598,844 |
| Events in quadrant B | 4,285,443 | 600,524 |
| Events in quadrant C | 4,186,121 | 572,234 |
| Events in quadrant D | 5,221,455 | 564,205 |
| Mode SS | |||
|---|---|---|---|
| Quadrant | BADHDUFLAG | Total packets | Discarded packets |
| A | 0 | 168 | 0 |
| B | 0 | 168 | 0 |
| C | 0 | 168 | 0 |
| D | 0 | 168 | 0 |
| Mode M0 | |||
|---|---|---|---|
| Quadrant | BADHDUFLAG | Total packets | Discarded packets |
| A | 0 | 17856 | 3 |
| B | 0 | 17696 | 2 |
| C | 0 | 17280 | 2 |
| D | 0 | 21533 | 2 |
| Mode M9 | |||
|---|---|---|---|
| Quadrant | BADHDUFLAG | Total packets | Discarded packets |
| A | 0 | 9 | 0 |
| B | 0 | 9 | 0 |
| C | 0 | 9 | 0 |
| D | 0 | 9 | 0 |
| Quadrant | Total seconds | Saturated seconds | Saturation percentage |
|---|---|---|---|
| A | 8187 | 170 | 2.076463% |
| B | 8187 | 218 | 2.662758% |
| C | 8187 | 136 | 1.661170% |
| D | 8187 | 323 | 3.945279% |
Noise dominated data is calculated using 1-second bins in cleaned event files. If a bin has >2000 counts, and if more than 50% of those come from <1% of pixels, then it is considered to be noise-dominated and hence unusable.
| Quadrant | # 1 sec bins | Bins with >0 counts | Bins with >2000 counts | High rate bins dominated by noise | Noise dominated (total time) | Noise dominated (detector-on time) | Marked lightcurve |
|---|---|---|---|---|---|---|---|
| A | 9168 | 8190 | 30 | 30 | 0.33% | 0.37% | 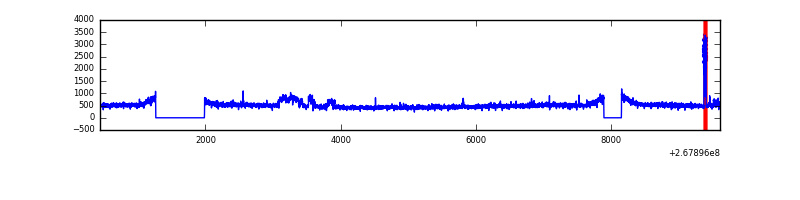 |
| B | 9168 | 8190 | 15 | 15 | 0.16% | 0.18% | 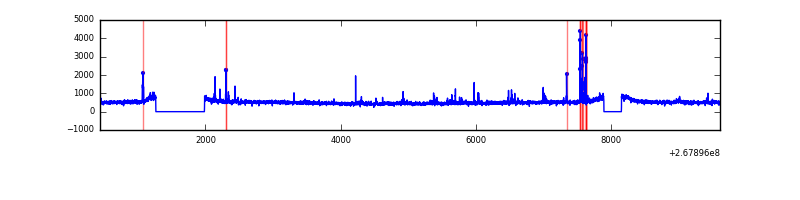 |
| C | 9168 | 8190 | 0 | 0 | 0.00% | 0.00% | 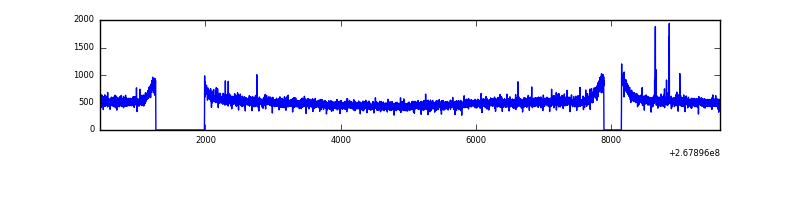 |
| D | 9168 | 8190 | 155 | 155 | 1.69% | 1.89% | 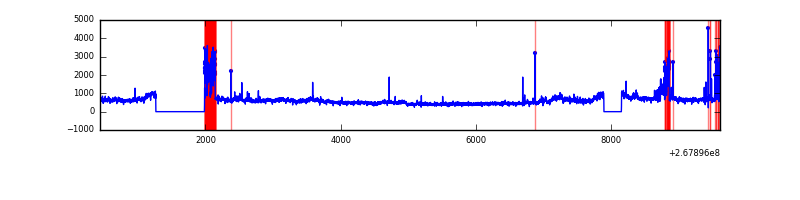 |
Top three noisy pixels from each quadrant. If the there are fewer than three noisy pixels in the level2.evt file, extra rows are filled as -1
| Pixel properties | Quadrant properties | ||||||
|---|---|---|---|---|---|---|---|
| Quadrant | DetID | PixID | Counts | Sigma | Mean | Median | Sigma |
| A | 12 | 189 | 180409 | 858.26 | 1032 | 1010 | 209.0 |
| A | 15 | 239 | 133571 | 634.19 | 1032 | 1010 | 209.0 |
| A | 0 | 226 | 9078 | 38.6 | 1032 | 1010 | 209.0 |
| B | 0 | 219 | 114500 | 568.45 | 1024 | 996 | 199.7 |
| B | 5 | 96 | 60482 | 297.92 | 1024 | 996 | 199.7 |
| B | 0 | 189 | 36244 | 176.53 | 1024 | 996 | 199.7 |
| C | 3 | 233 | 286332 | 1231.79 | 993 | 997 | 231.6 |
| C | 9 | 54 | 19418 | 79.52 | 993 | 997 | 231.6 |
| C | 13 | 61 | 6978 | 25.82 | 993 | 997 | 231.6 |
| D | 13 | 104 | 980345 | 4186.27 | 982 | 960 | 234.0 |
| D | 7 | 254 | 515130 | 2197.76 | 982 | 960 | 234.0 |
| D | 2 | 234 | 30141 | 124.73 | 982 | 960 | 234.0 |
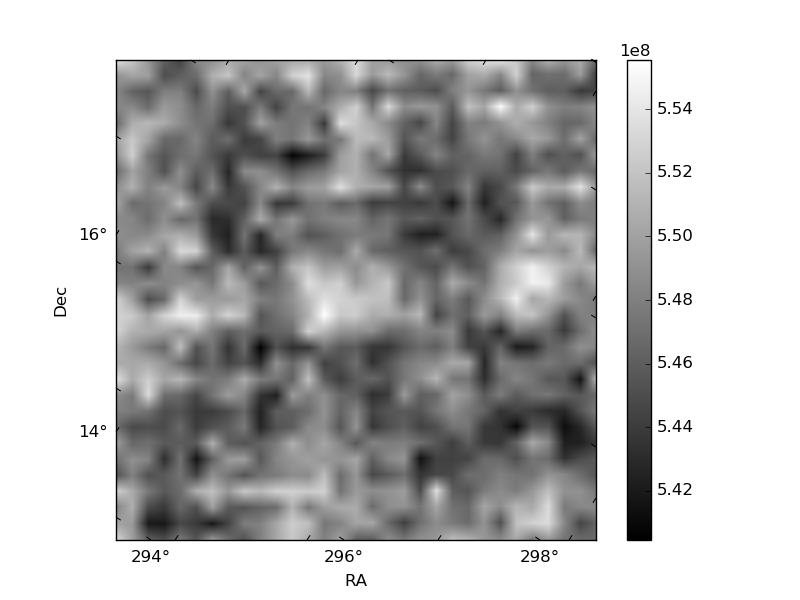
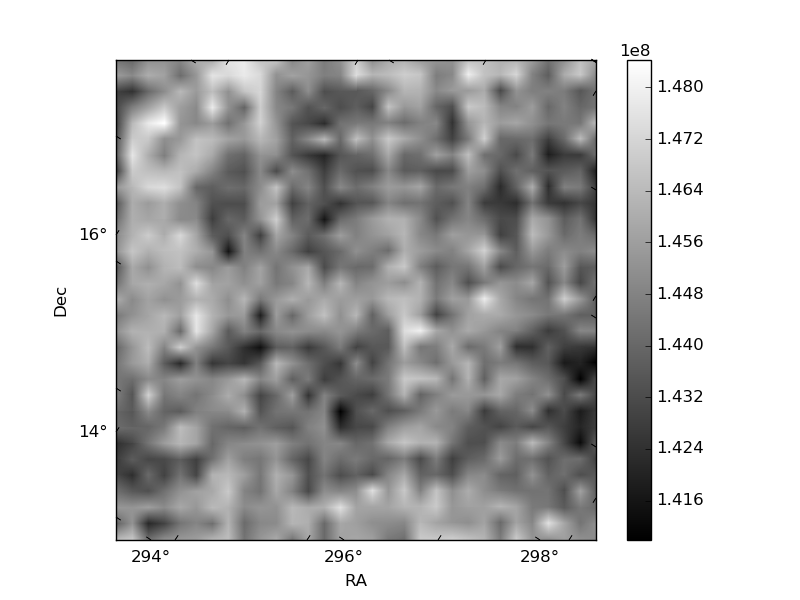
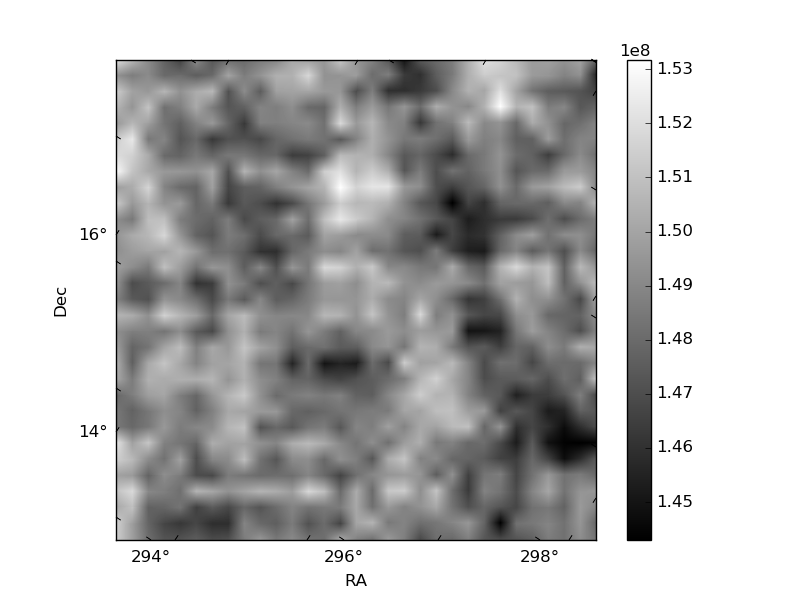
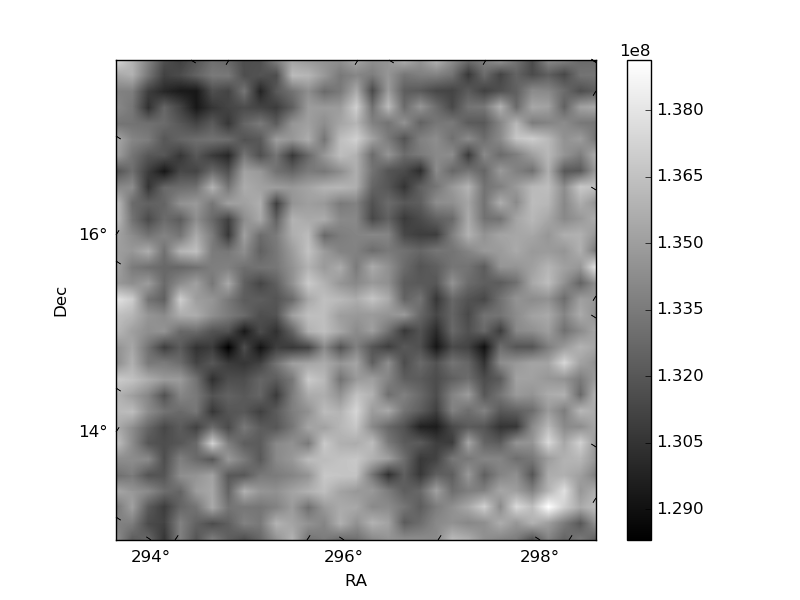
Histogram calculated using DETX and DETY for each event in the final _common_clean file
| Quadrant A | 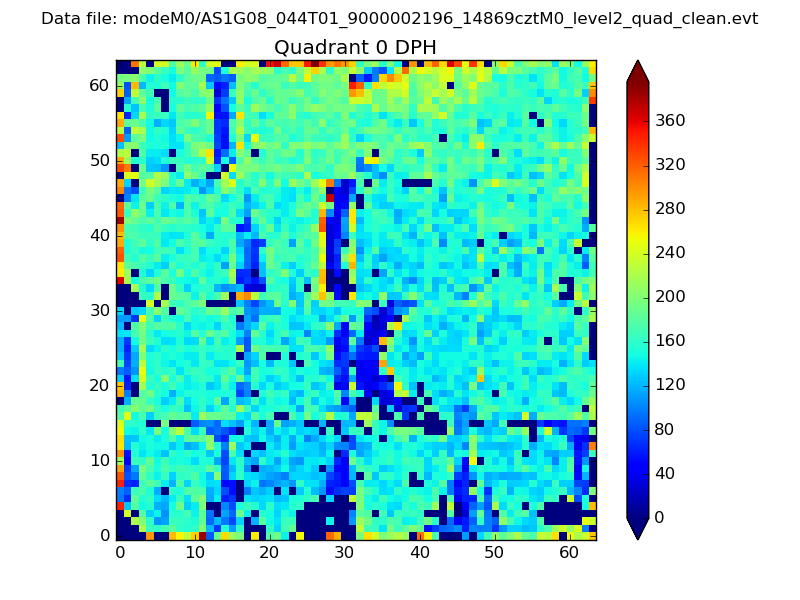 |
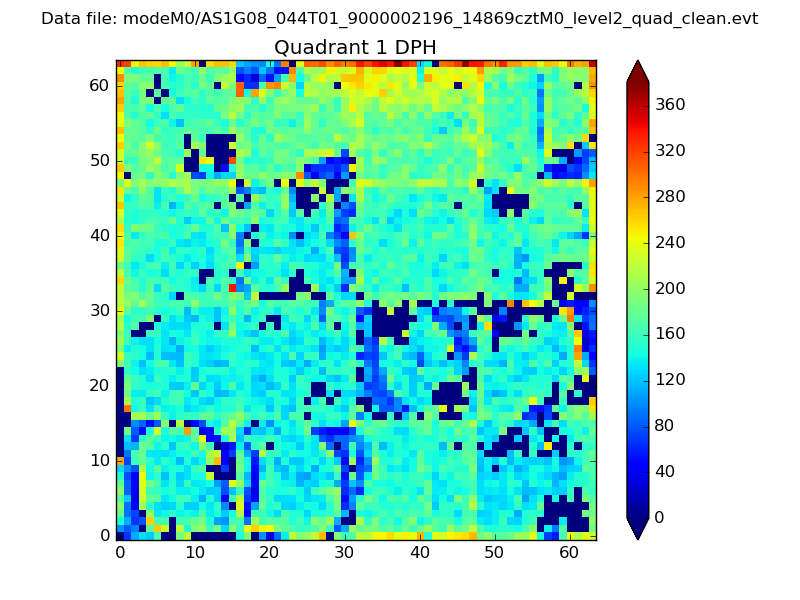 |
Quadrant B |
|---|---|---|---|
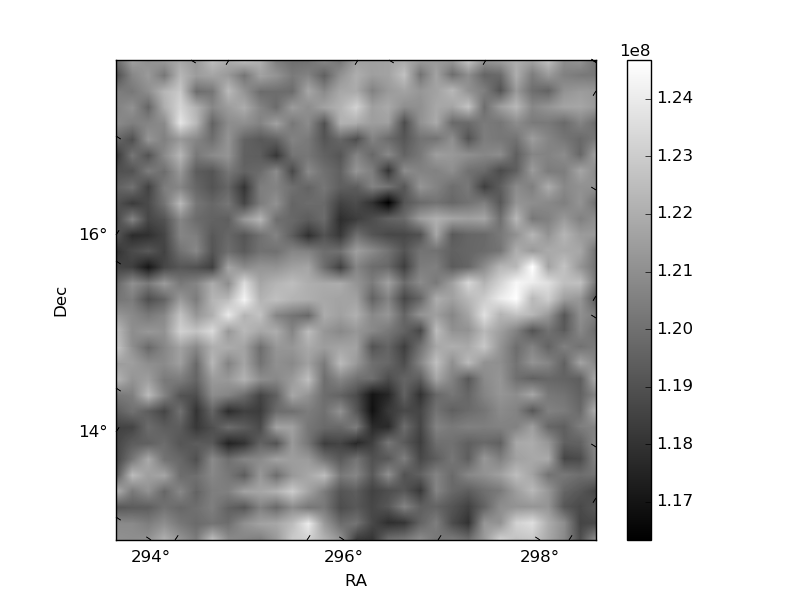
| Quadrant D |  |
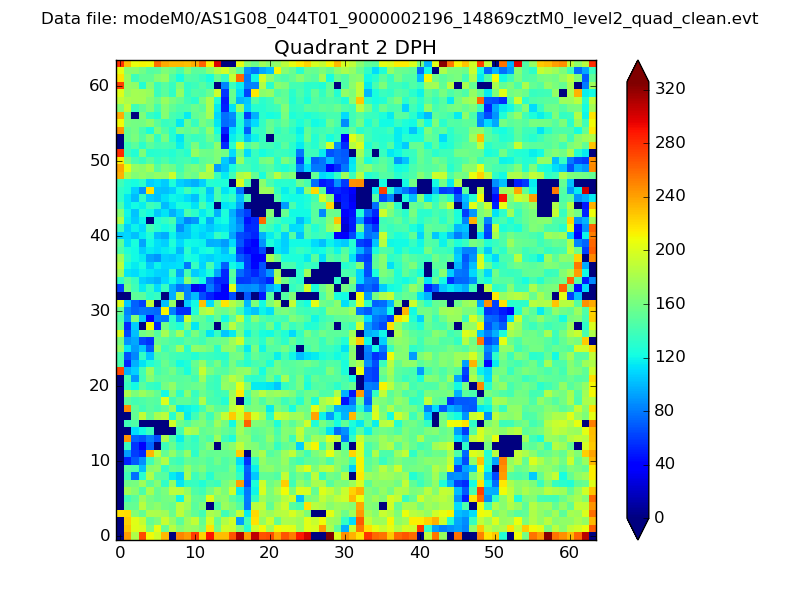 |
Quadrant C |
| Plot type | Count rate plots | Images |
|---|---|---|
| Comparison with Poisson distribution Blue bars denote a histogram of data divided into 1 sec bins. Red curve is a Poisson curve with rate = median count rate of data. |
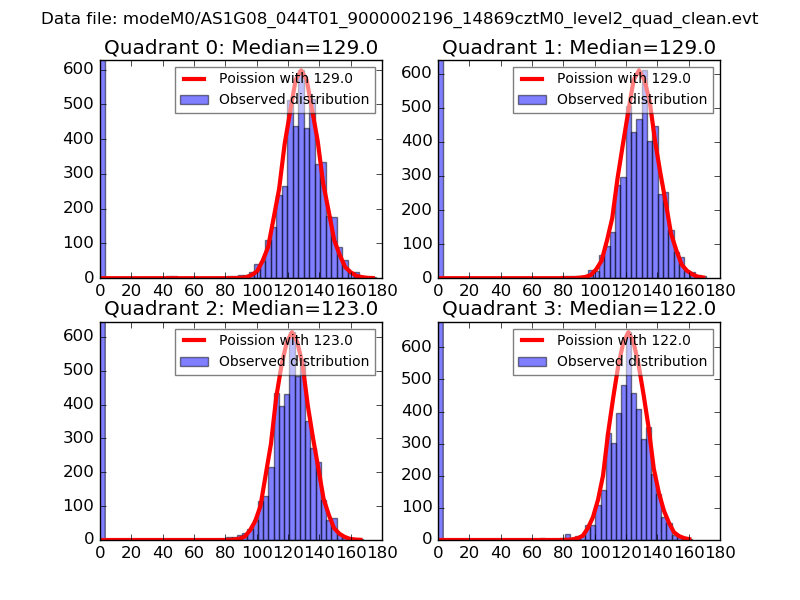 |
 |
| Quadrant-wise count rates Data is divided into 100 sec bins |
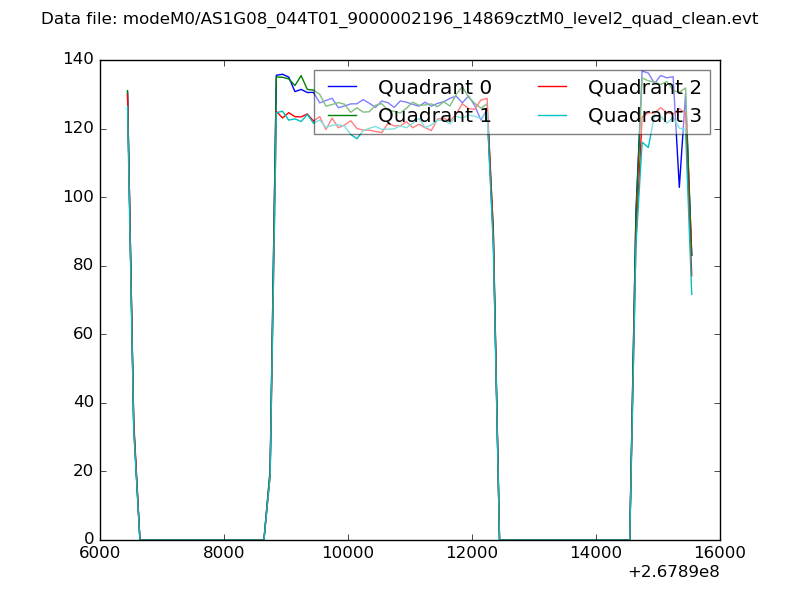 |
|
| Module-wise count rates for Quadrant A Data is divided into 100 sec bins |
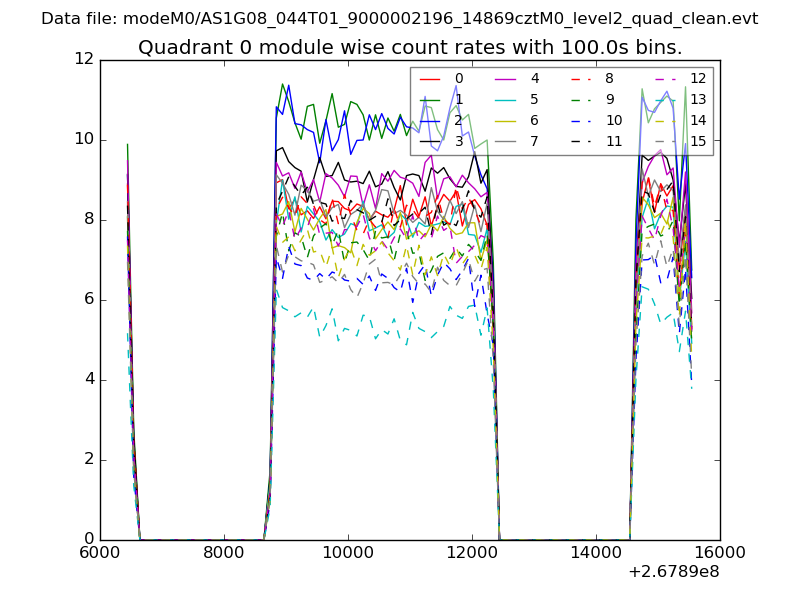 |
 |
| Module-wise count rates for Quadrant B Data is divided into 100 sec bins |
 |
 |
| Module-wise count rates for Quadrant C Data is divided into 100 sec bins |
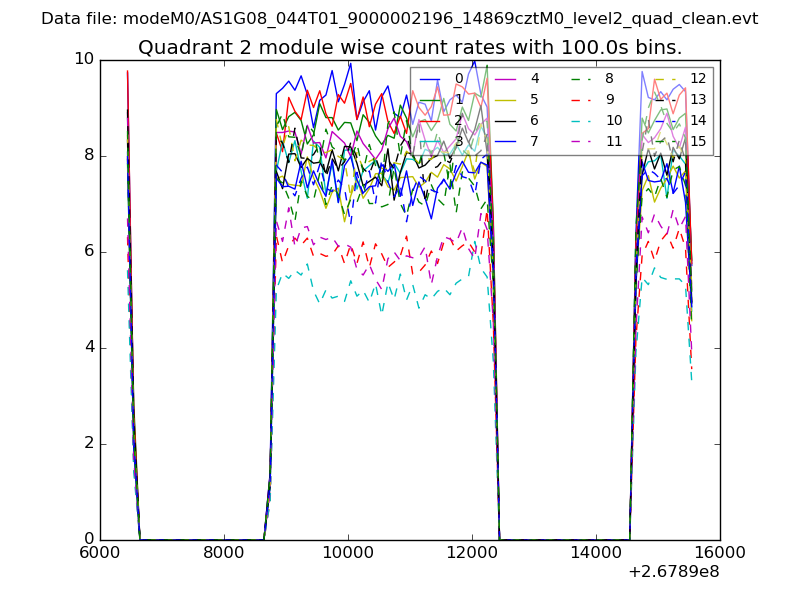 |
 |
| Module-wise count rates for Quadrant D Data is divided into 100 sec bins |
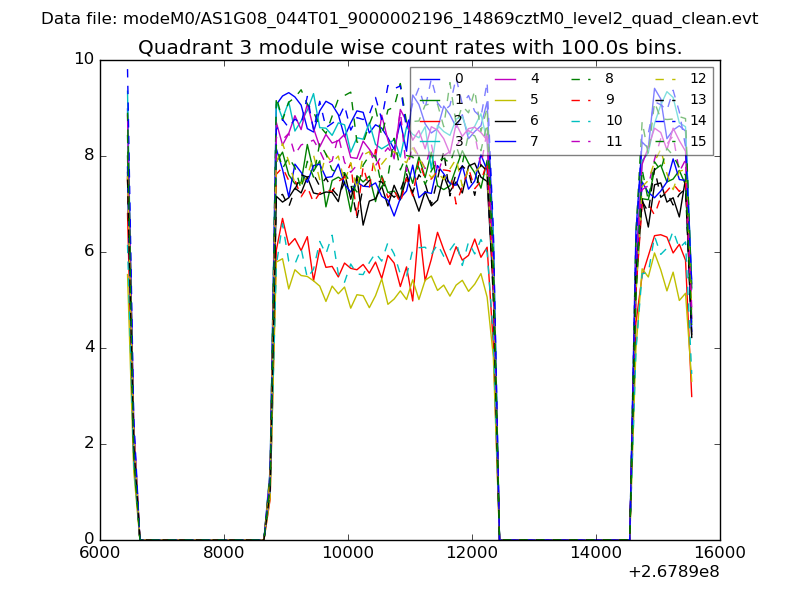 |
 |
| Parameter | Plot |
|---|---|
| CZT HV Monitor | 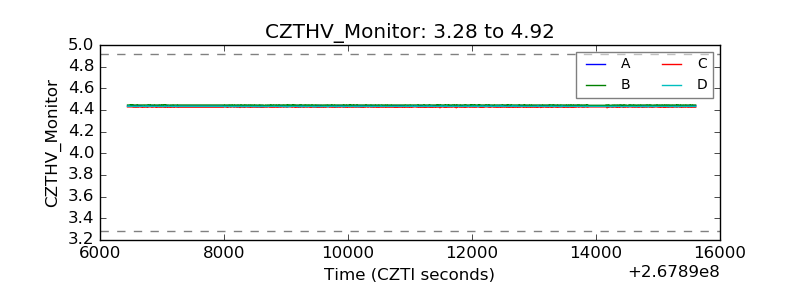 |
| D_VDD | 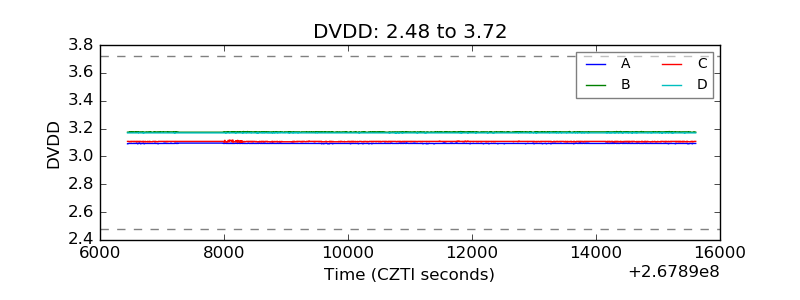 |
| Temperature 1 | 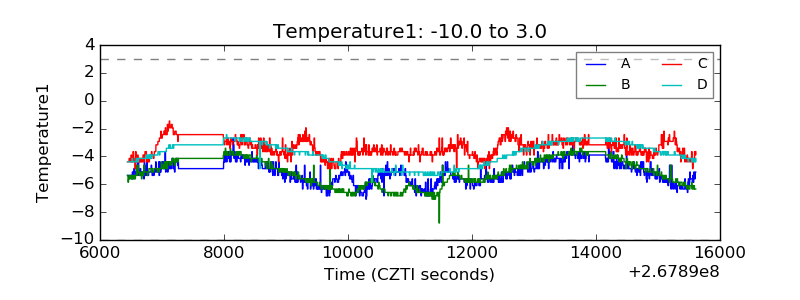 |
| Veto HV Monitor | 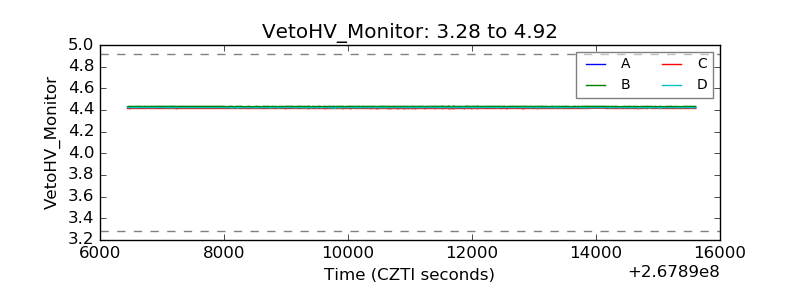 |
| Veto LLD | 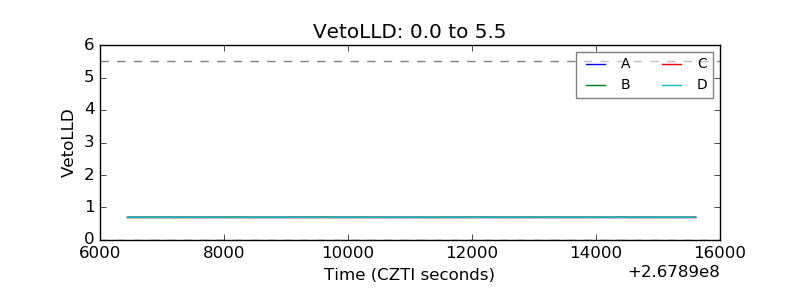 |
| Alpha Counter | 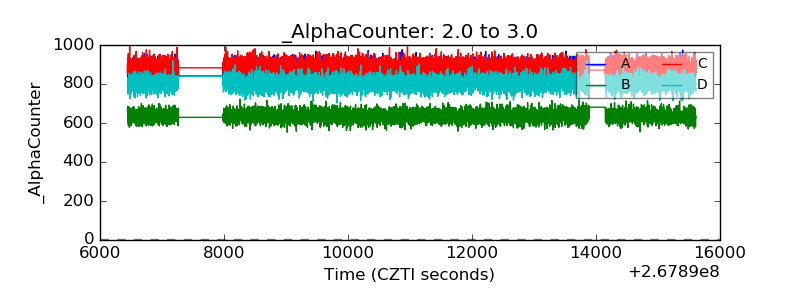 |
| _CPM_Rate | 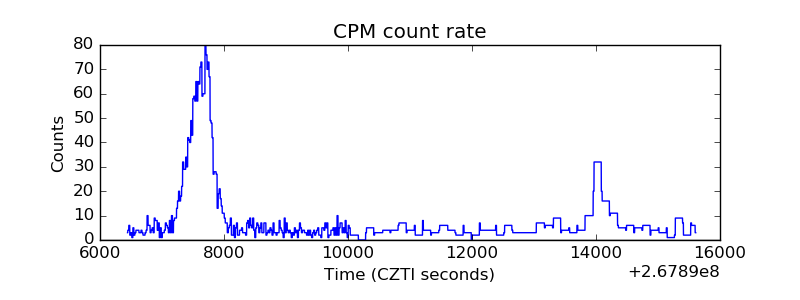 |
| CZT Counter | 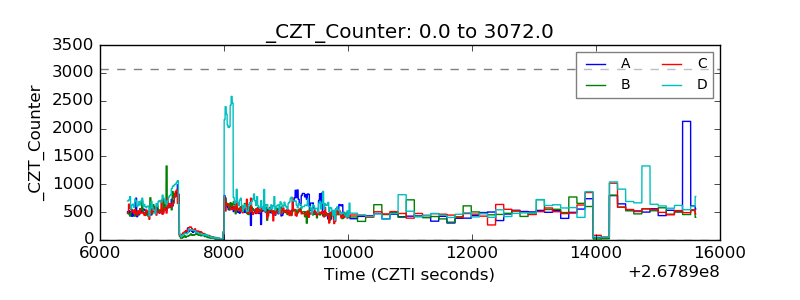 |
| +2.5 Volts monitor |  |
| +5 Volts monitor | 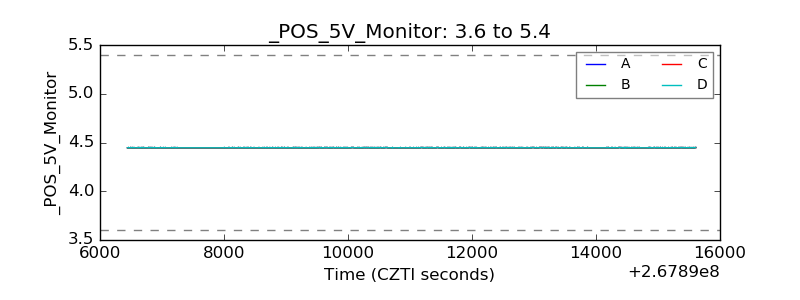 |
| _ROLL_ROT | 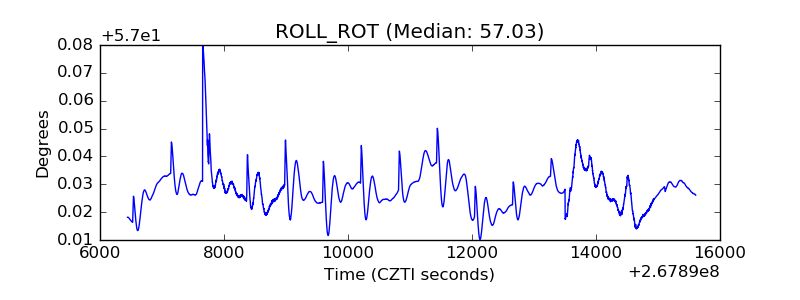 |
| _Roll_DEC | 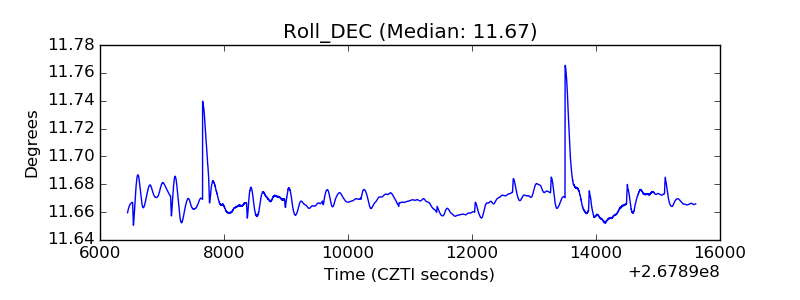 |
| _Roll_RA | 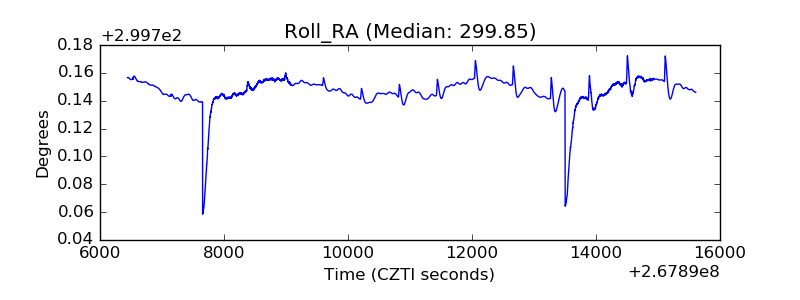 |
| Veto Counter | 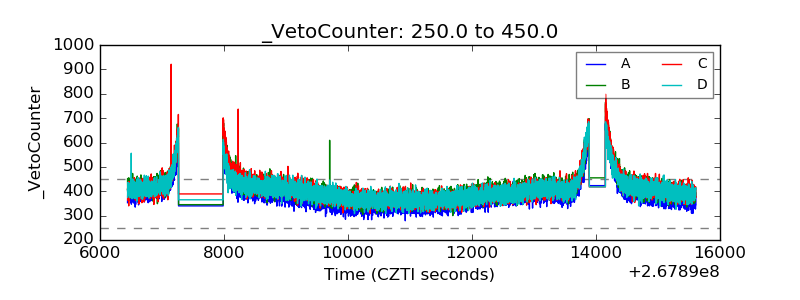 |