| Param | Original file | Final file |
|---|---|---|
| Filename | modeM0/AS1G08_044T01_9000002196_14870cztM0_level2.evt | modeM0/AS1G08_044T01_9000002196_14870cztM0_level2_quad_clean.evt |
| Size (bytes) | 597,657,600 | 101,960,640 |
| Size | 570.0 MB | 97.2 MB |
| Events in quadrant A | 3,829,242 | 658,668 |
| Events in quadrant B | 3,926,032 | 658,310 |
| Events in quadrant C | 3,833,753 | 627,194 |
| Events in quadrant D | 5,991,494 | 610,627 |
| Mode SS | |||
|---|---|---|---|
| Quadrant | BADHDUFLAG | Total packets | Discarded packets |
| A | 0 | 156 | 0 |
| B | 0 | 156 | 0 |
| C | 0 | 156 | 0 |
| D | 0 | 156 | 0 |
| Mode M0 | |||
|---|---|---|---|
| Quadrant | BADHDUFLAG | Total packets | Discarded packets |
| A | 0 | 16242 | 3 |
| B | 0 | 16403 | 2 |
| C | 0 | 16101 | 2 |
| D | 0 | 23303 | 2 |
| Mode M9 | |||
|---|---|---|---|
| Quadrant | BADHDUFLAG | Total packets | Discarded packets |
| A | 0 | 2 | 0 |
| B | 0 | 2 | 0 |
| C | 0 | 2 | 0 |
| D | 0 | 3 | 0 |
| Quadrant | Total seconds | Saturated seconds | Saturation percentage |
|---|---|---|---|
| A | 7659 | 111 | 1.449275% |
| B | 7659 | 105 | 1.370936% |
| C | 7659 | 66 | 0.861731% |
| D | 7659 | 679 | 8.865387% |
Noise dominated data is calculated using 1-second bins in cleaned event files. If a bin has >2000 counts, and if more than 50% of those come from <1% of pixels, then it is considered to be noise-dominated and hence unusable.
| Quadrant | # 1 sec bins | Bins with >0 counts | Bins with >2000 counts | High rate bins dominated by noise | Noise dominated (total time) | Noise dominated (detector-on time) | Marked lightcurve |
|---|---|---|---|---|---|---|---|
| A | 7915 | 7661 | 30 | 30 | 0.38% | 0.39% | 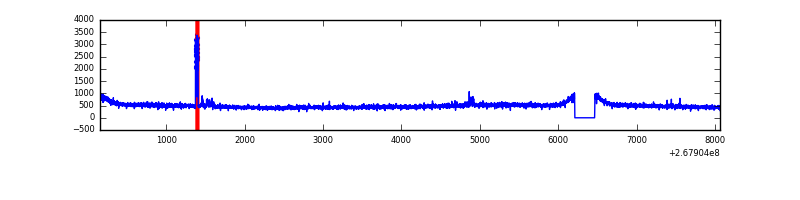 |
| B | 7915 | 7661 | 1 | 1 | 0.01% | 0.01% | 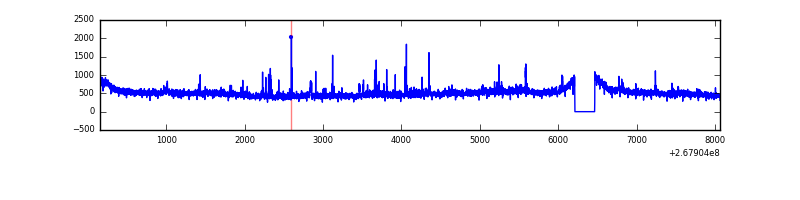 |
| C | 7915 | 7661 | 0 | 0 | 0.00% | 0.00% | 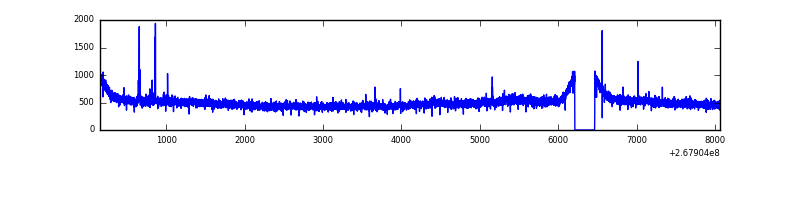 |
| D | 7915 | 7661 | 436 | 436 | 5.51% | 5.69% | 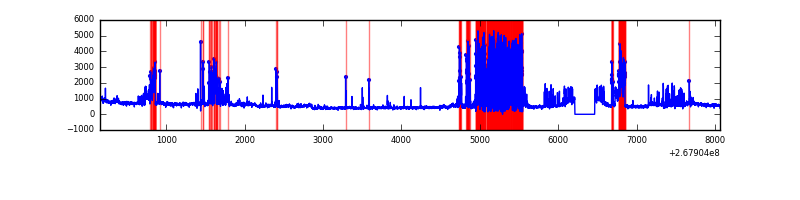 |
Top three noisy pixels from each quadrant. If the there are fewer than three noisy pixels in the level2.evt file, extra rows are filled as -1
| Pixel properties | Quadrant properties | ||||||
|---|---|---|---|---|---|---|---|
| Quadrant | DetID | PixID | Counts | Sigma | Mean | Median | Sigma |
| A | 15 | 239 | 137880 | 710.9 | 948 | 928 | 192.6 |
| A | 12 | 189 | 39731 | 201.42 | 948 | 928 | 192.6 |
| A | 0 | 226 | 8315 | 38.35 | 948 | 928 | 192.6 |
| B | 0 | 219 | 105346 | 561.01 | 947 | 923 | 186.1 |
| B | 0 | 205 | 36719 | 192.31 | 947 | 923 | 186.1 |
| B | 0 | 189 | 27956 | 145.23 | 947 | 923 | 186.1 |
| C | 3 | 233 | 227543 | 1055.26 | 917 | 922 | 214.8 |
| C | 9 | 54 | 19315 | 85.65 | 917 | 922 | 214.8 |
| C | 3 | 232 | 6682 | 26.82 | 917 | 922 | 214.8 |
| D | 13 | 104 | 2031001 | 9619.71 | 883 | 861 | 211.0 |
| D | 7 | 254 | 600822 | 2842.88 | 883 | 861 | 211.0 |
| D | 2 | 234 | 27261 | 125.09 | 883 | 861 | 211.0 |
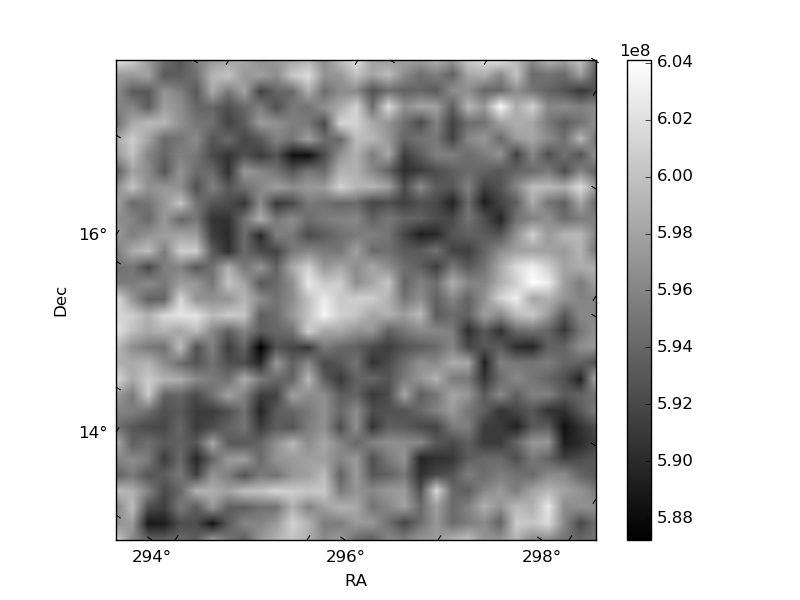
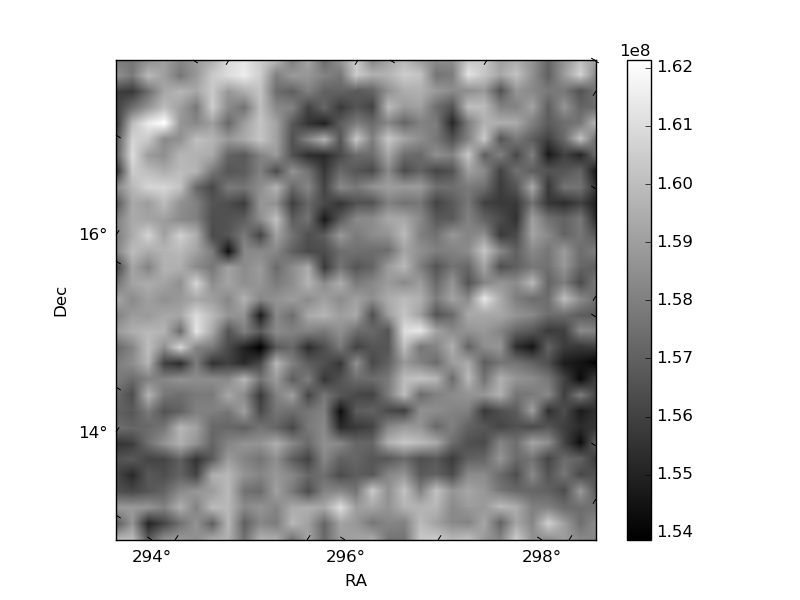
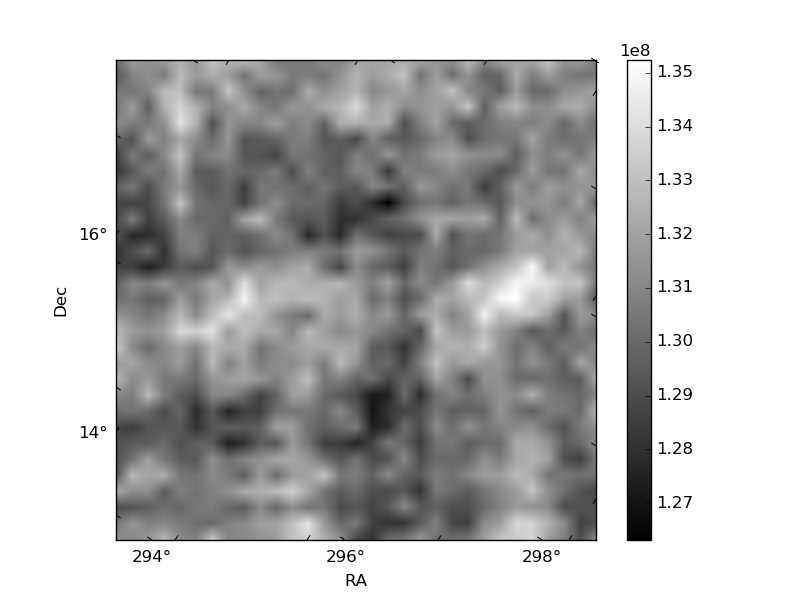
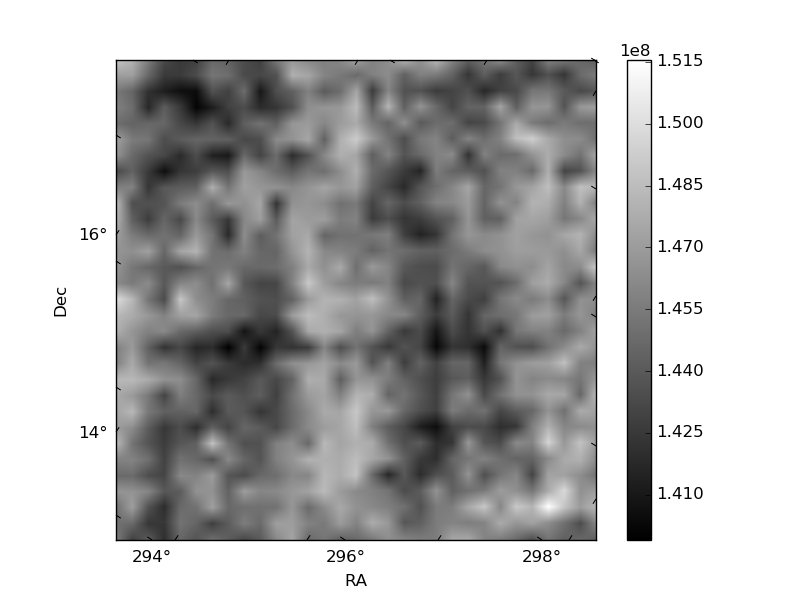
Histogram calculated using DETX and DETY for each event in the final _common_clean file
| Quadrant A | 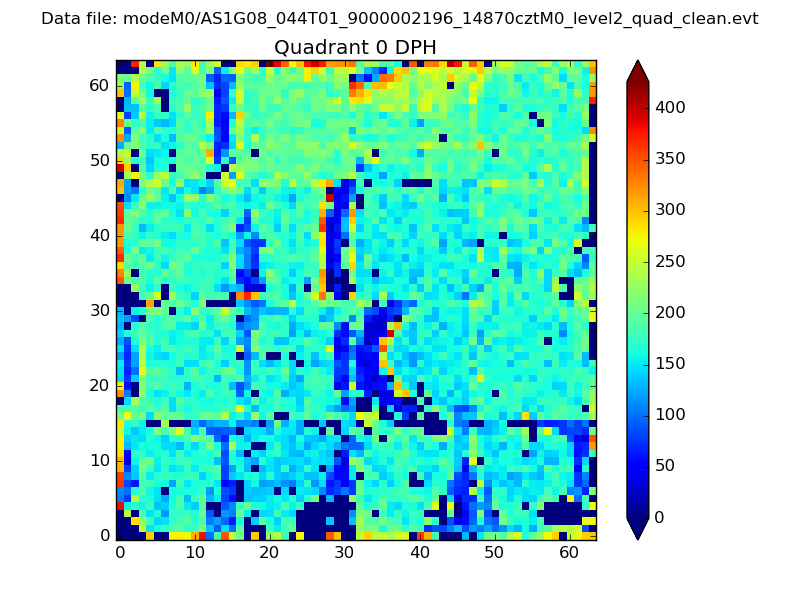 |
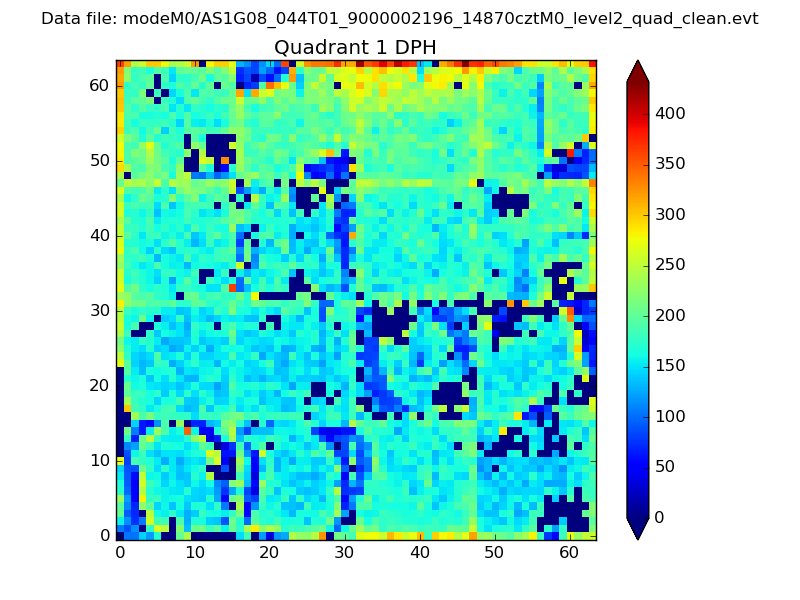 |
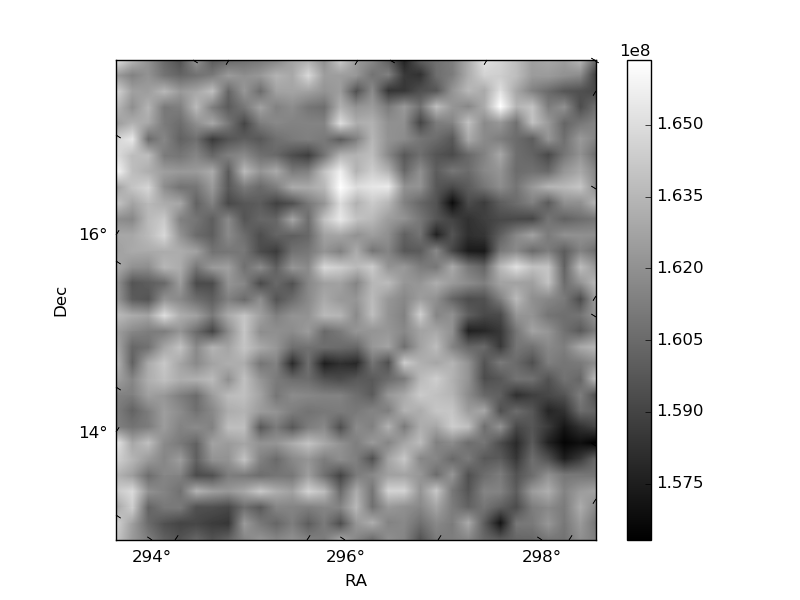
Quadrant B |
|---|---|---|---|
| Quadrant D | 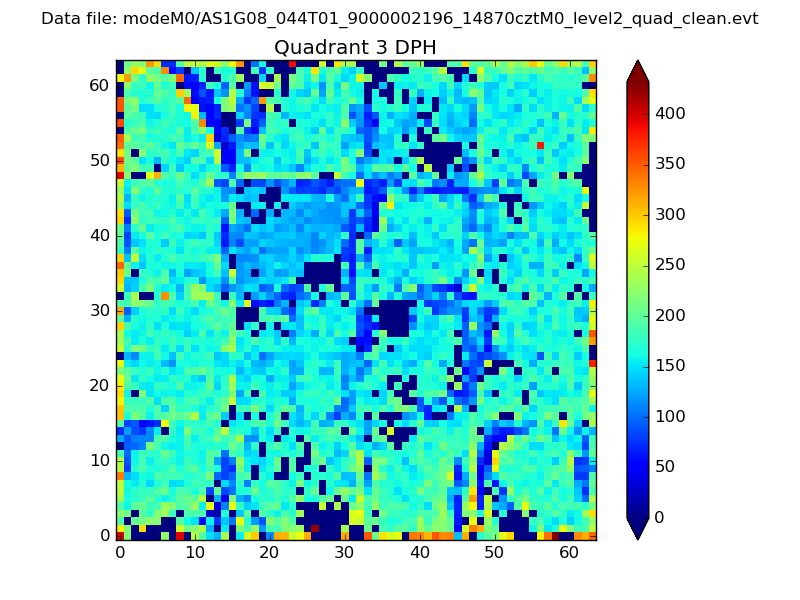 |
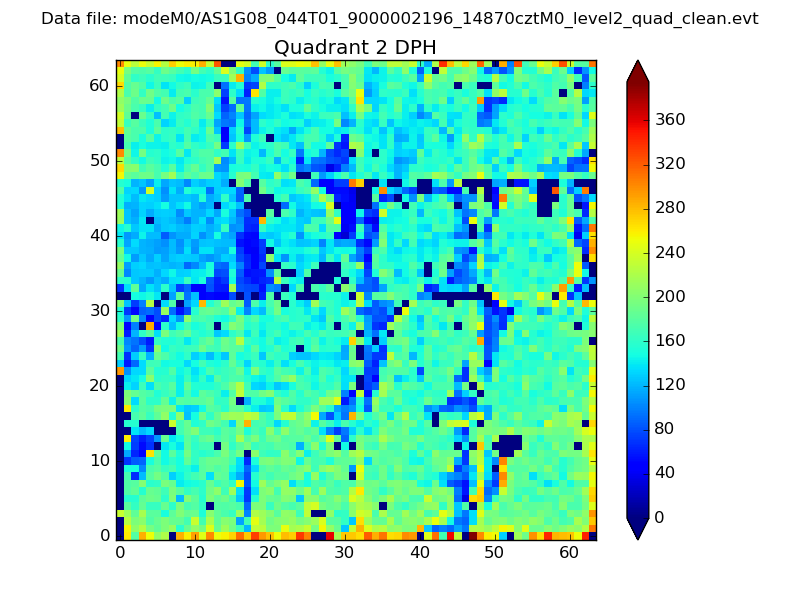 |
Quadrant C |
| Plot type | Count rate plots | Images |
|---|---|---|
| Comparison with Poisson distribution Blue bars denote a histogram of data divided into 1 sec bins. Red curve is a Poisson curve with rate = median count rate of data. |
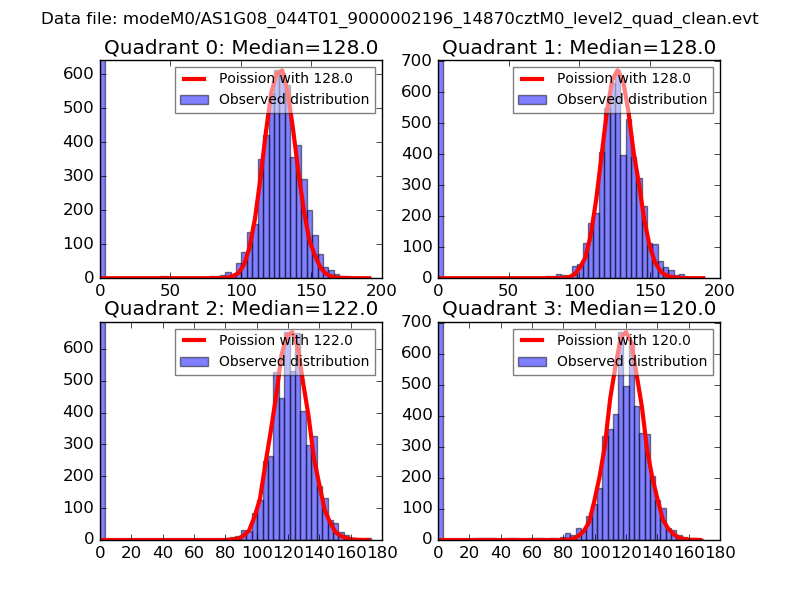 |
 |
| Quadrant-wise count rates Data is divided into 100 sec bins |
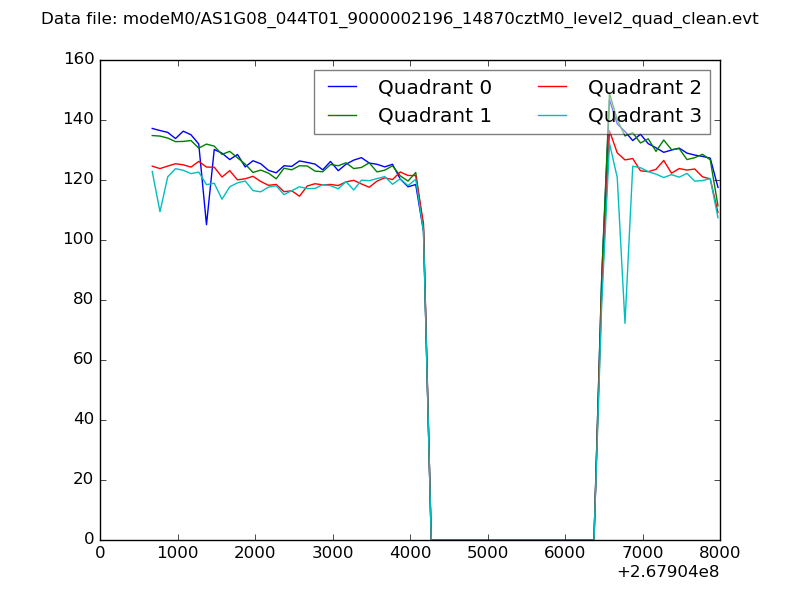 |
|
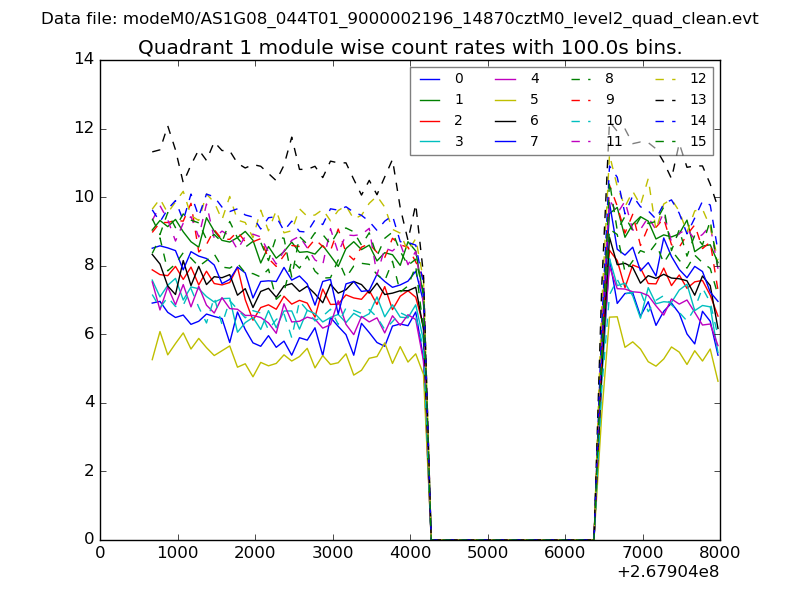
| Module-wise count rates for Quadrant A Data is divided into 100 sec bins |
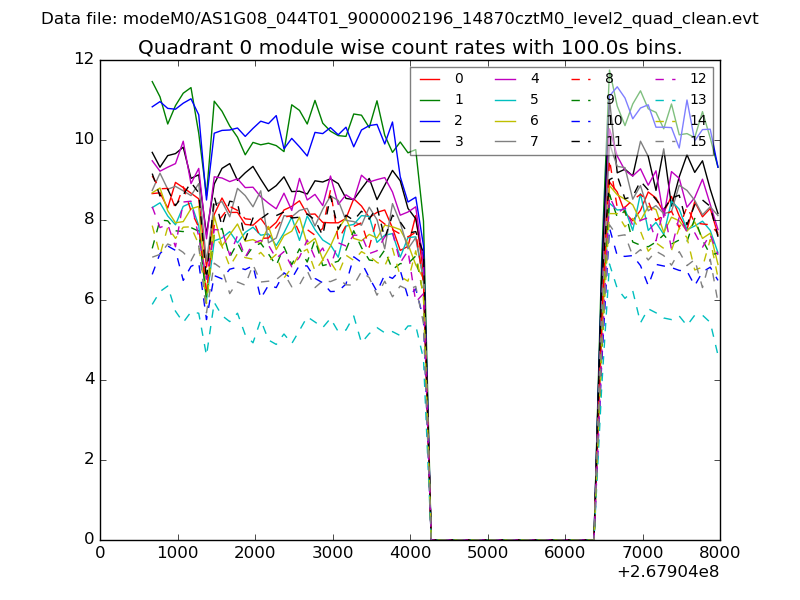 |
 |
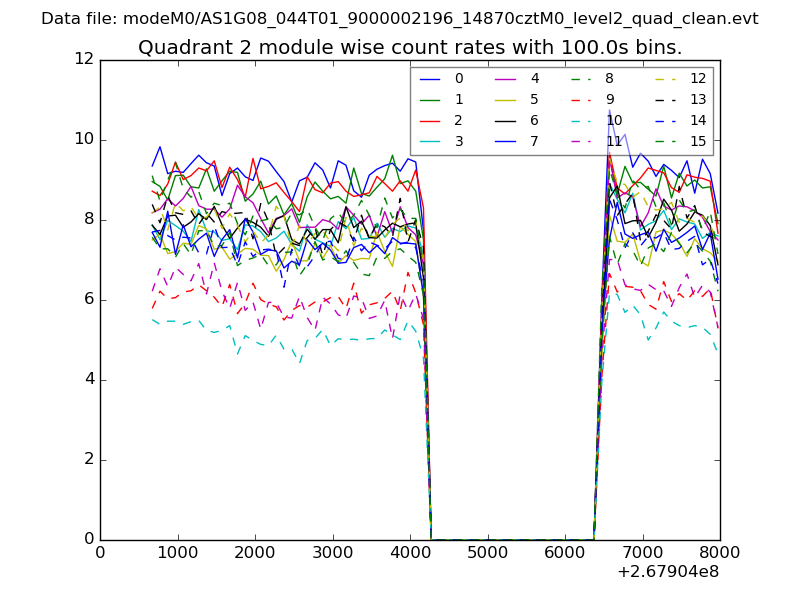
| Module-wise count rates for Quadrant B Data is divided into 100 sec bins |
 |
 |
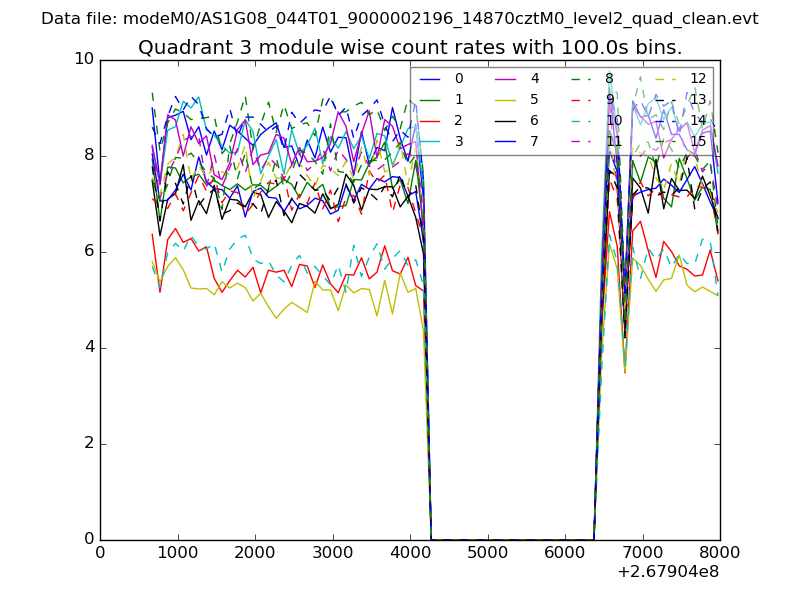
| Module-wise count rates for Quadrant C Data is divided into 100 sec bins |
 |
 |
| Module-wise count rates for Quadrant D Data is divided into 100 sec bins |
 |
 |
| Parameter | Plot |
|---|---|
| CZT HV Monitor | 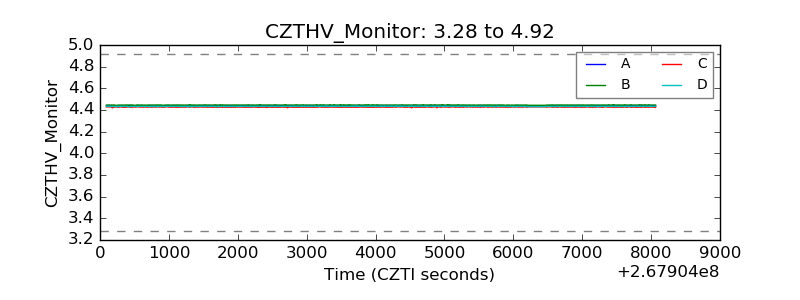 |
| D_VDD | 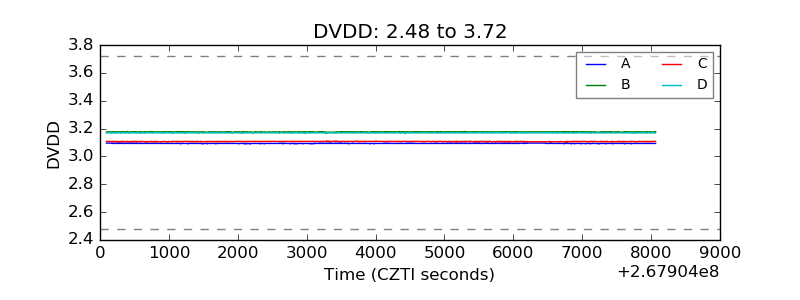 |
| Temperature 1 | 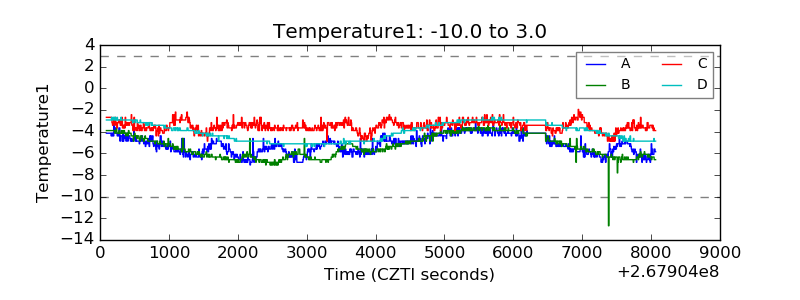 |
| Veto HV Monitor | 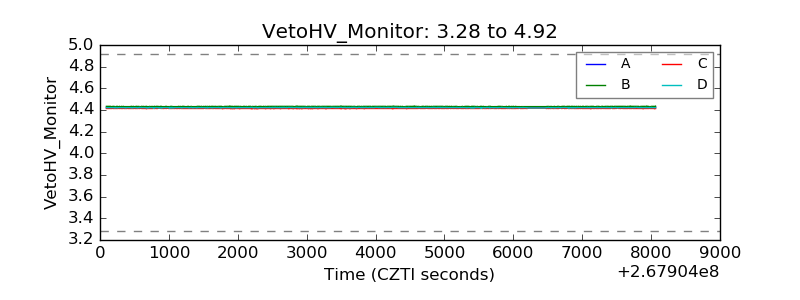 |
| Veto LLD | 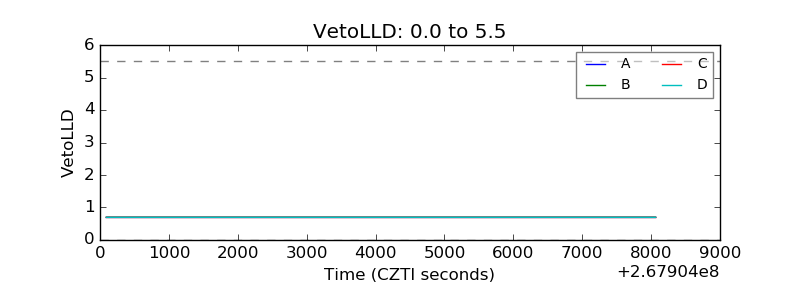 |
| Alpha Counter | 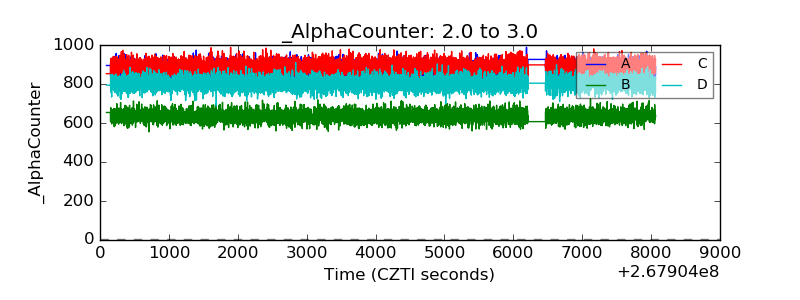 |
| _CPM_Rate | 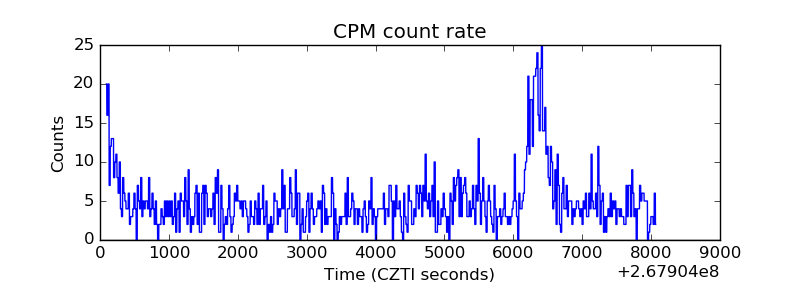 |
| CZT Counter | 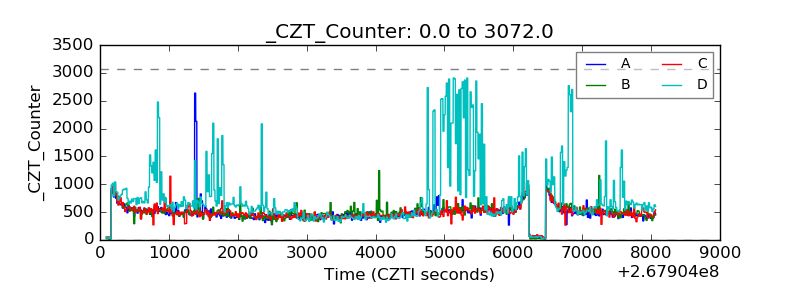 |
| +2.5 Volts monitor |  |
| +5 Volts monitor | 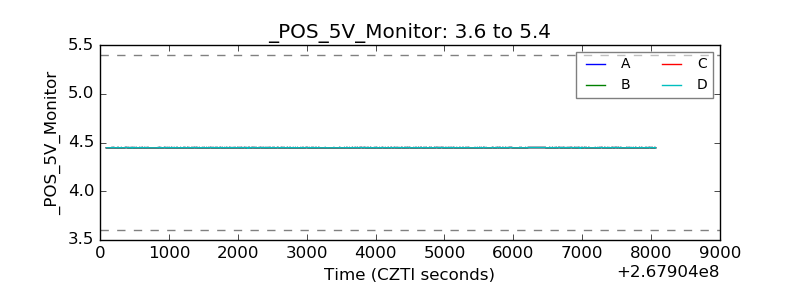 |
| _ROLL_ROT |  |
| _Roll_DEC |  |
| _Roll_RA | 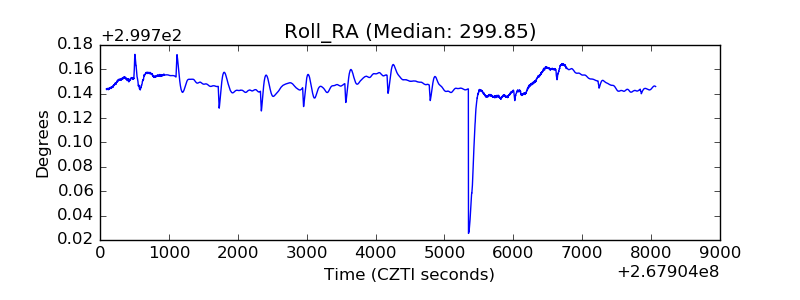 |
| Veto Counter |  |