| Param | Original file | Final file |
|---|---|---|
| Filename | modeM0/AS1G08_044T01_9000002196_14873cztM0_level2.evt | modeM0/AS1G08_044T01_9000002196_14873cztM0_level2_quad_clean.evt |
| Size (bytes) | 270,429,120 | 57,576,960 |
| Size | 257.9 MB | 54.9 MB |
| Events in quadrant A | 1,779,969 | 382,265 |
| Events in quadrant B | 1,881,787 | 381,224 |
| Events in quadrant C | 1,848,178 | 362,542 |
| Events in quadrant D | 2,424,947 | 353,471 |
| Mode SS | |||
|---|---|---|---|
| Quadrant | BADHDUFLAG | Total packets | Discarded packets |
| A | 0 | 78 | 0 |
| B | 0 | 78 | 0 |
| C | 0 | 78 | 0 |
| D | 0 | 78 | 0 |
| Mode M0 | |||
|---|---|---|---|
| Quadrant | BADHDUFLAG | Total packets | Discarded packets |
| A | 0 | 7812 | 1 |
| B | 0 | 8030 | 1 |
| C | 0 | 7873 | 1 |
| D | 0 | 9834 | 1 |
| Mode M9 | |||
|---|---|---|---|
| Quadrant | BADHDUFLAG | Total packets | Discarded packets |
| A | 0 | 2 | 0 |
| B | 0 | 2 | 0 |
| C | 0 | 2 | 0 |
| D | 0 | 2 | 0 |
| Quadrant | Total seconds | Saturated seconds | Saturation percentage |
|---|---|---|---|
| A | 3724 | 37 | 0.993555% |
| B | 3724 | 52 | 1.396348% |
| C | 3724 | 31 | 0.832438% |
| D | 3724 | 169 | 4.538131% |
Noise dominated data is calculated using 1-second bins in cleaned event files. If a bin has >2000 counts, and if more than 50% of those come from <1% of pixels, then it is considered to be noise-dominated and hence unusable.
| Quadrant | # 1 sec bins | Bins with >0 counts | Bins with >2000 counts | High rate bins dominated by noise | Noise dominated (total time) | Noise dominated (detector-on time) | Marked lightcurve |
|---|---|---|---|---|---|---|---|
| A | 3980 | 3726 | 0 | 0 | 0.00% | 0.00% | 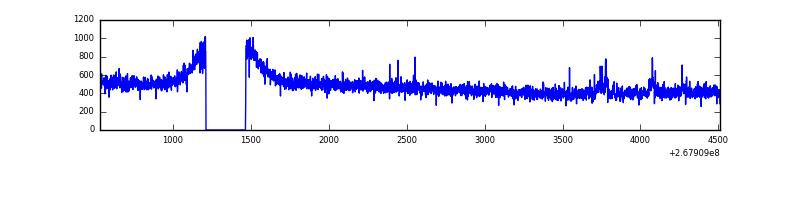 |
| B | 3980 | 3726 | 0 | 0 | 0.00% | 0.00% | 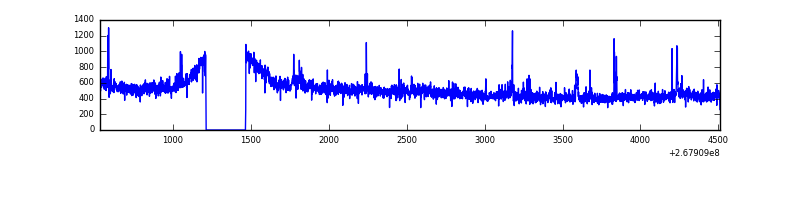 |
| C | 3980 | 3726 | 0 | 0 | 0.00% | 0.00% | 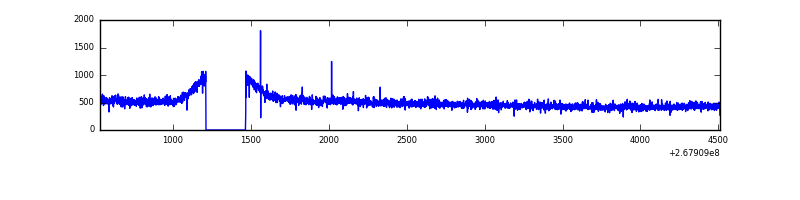 |
| D | 3980 | 3726 | 77 | 77 | 1.93% | 2.07% | 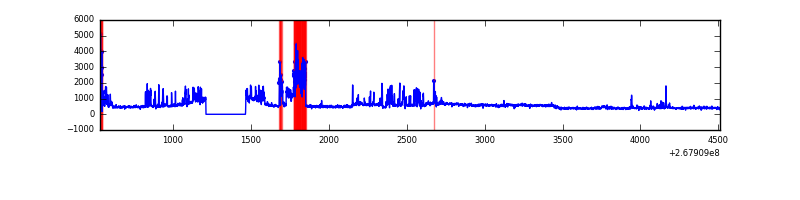 |
Top three noisy pixels from each quadrant. If the there are fewer than three noisy pixels in the level2.evt file, extra rows are filled as -1
| Pixel properties | Quadrant properties | ||||||
|---|---|---|---|---|---|---|---|
| Quadrant | DetID | PixID | Counts | Sigma | Mean | Median | Sigma |
| A | 15 | 239 | 26199 | 271.29 | 454 | 444 | 94.9 |
| A | 12 | 189 | 4238 | 39.96 | 454 | 444 | 94.9 |
| A | 0 | 226 | 3869 | 36.08 | 454 | 444 | 94.9 |
| B | 0 | 219 | 50839 | 559.25 | 454 | 441 | 90.1 |
| B | 0 | 214 | 14874 | 160.16 | 454 | 441 | 90.1 |
| B | 0 | 205 | 13934 | 149.73 | 454 | 441 | 90.1 |
| C | 3 | 233 | 112107 | 1066.71 | 444 | 446 | 104.7 |
| C | 13 | 61 | 3106 | 25.41 | 444 | 446 | 104.7 |
| C | 3 | 232 | 2885 | 23.3 | 444 | 446 | 104.7 |
| D | 13 | 104 | 516859 | 4917.07 | 435 | 425 | 105.0 |
| D | 7 | 254 | 251770 | 2393.11 | 435 | 425 | 105.0 |
| D | 2 | 234 | 13462 | 124.13 | 435 | 425 | 105.0 |
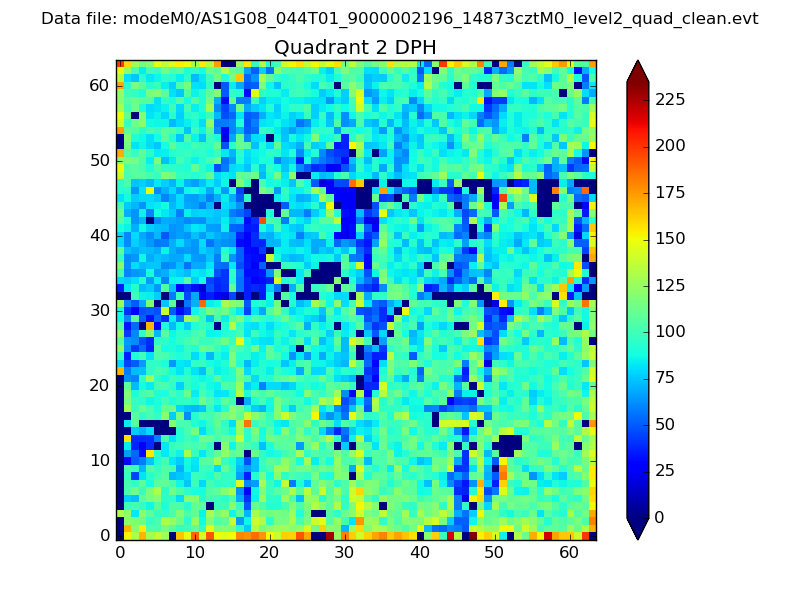
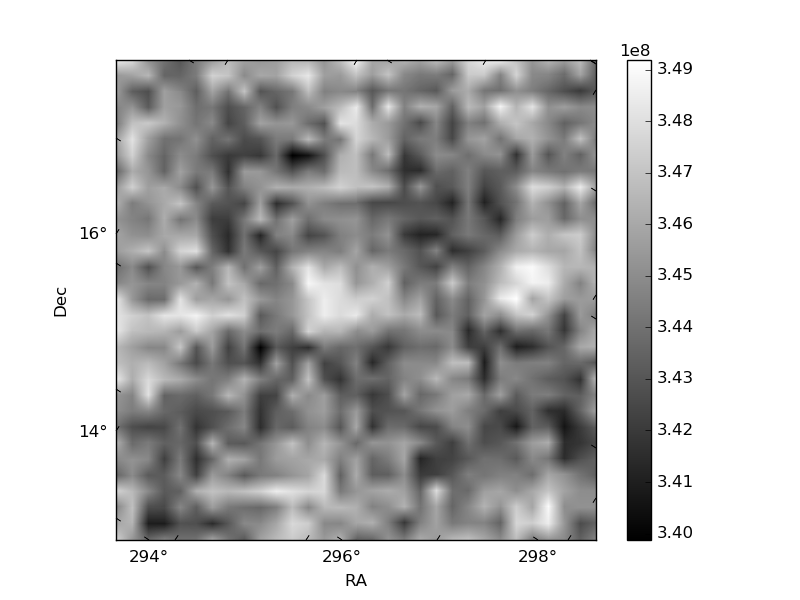
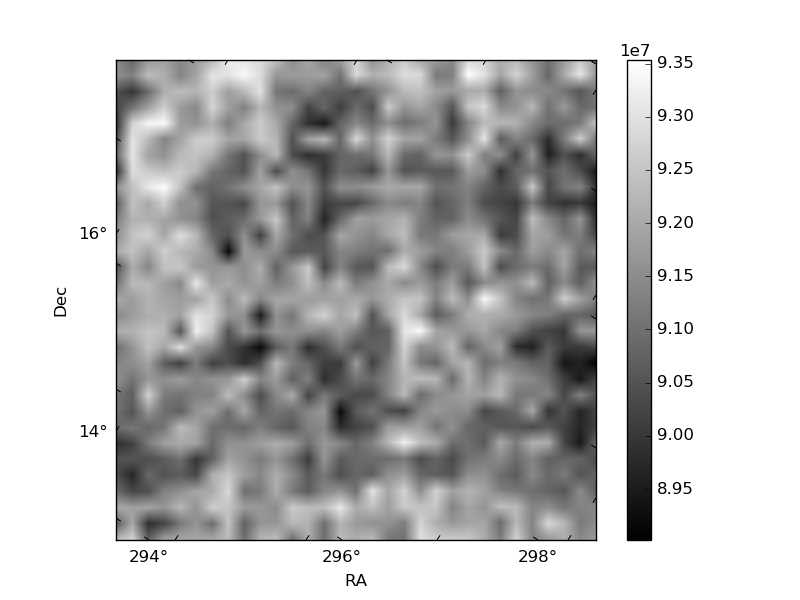
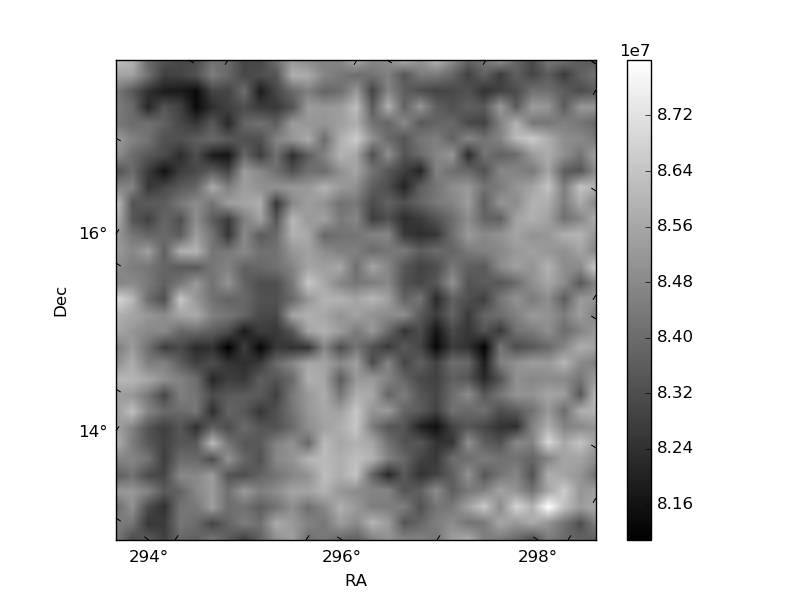
Histogram calculated using DETX and DETY for each event in the final _common_clean file
| Quadrant A | 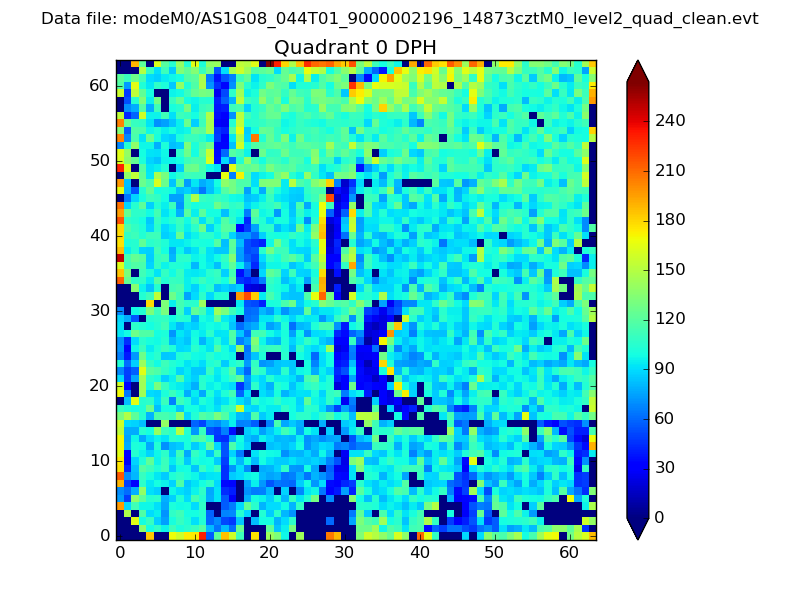 |
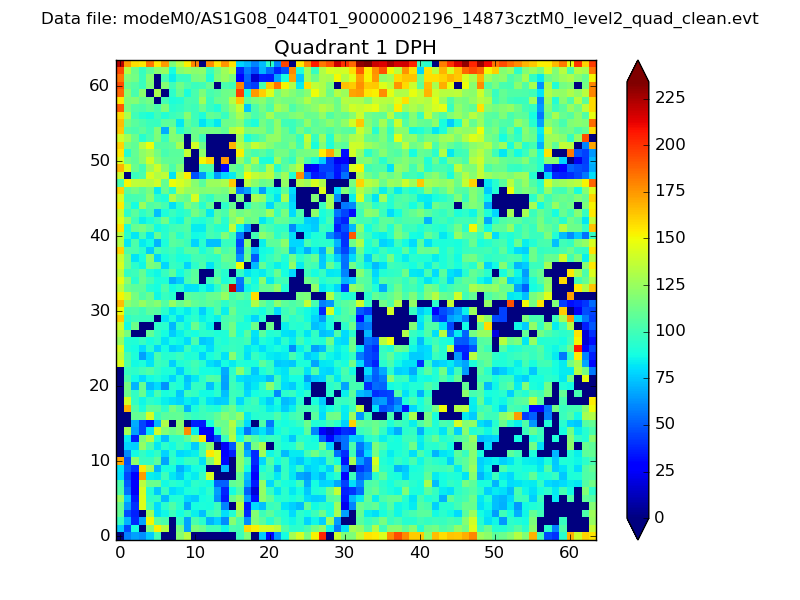 |
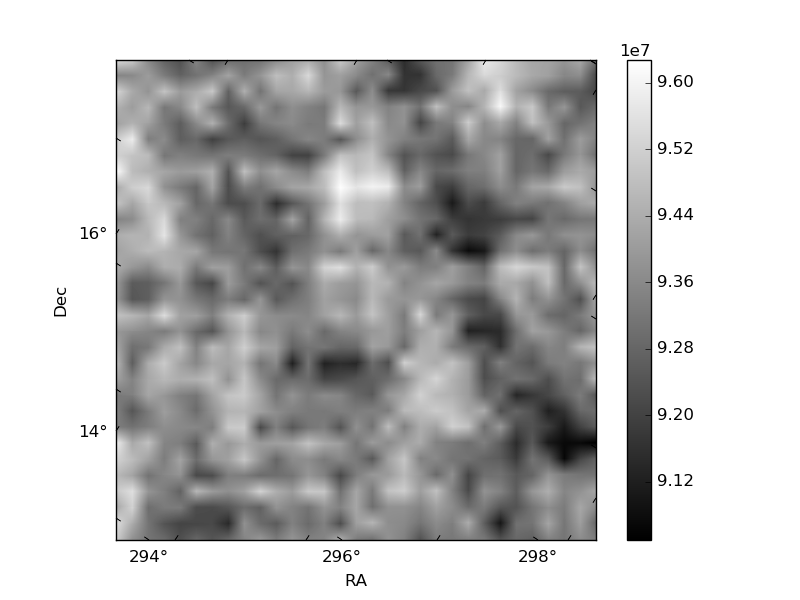
Quadrant B |
|---|---|---|---|
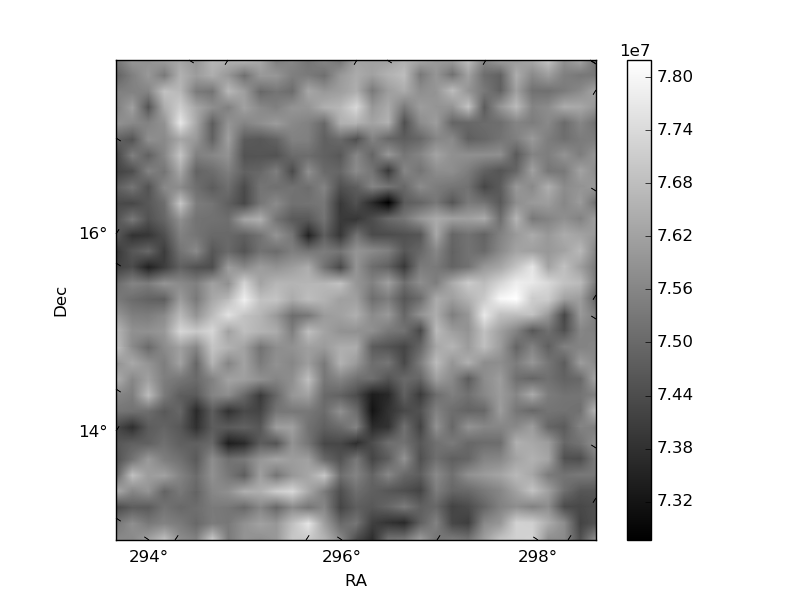
| Quadrant D | 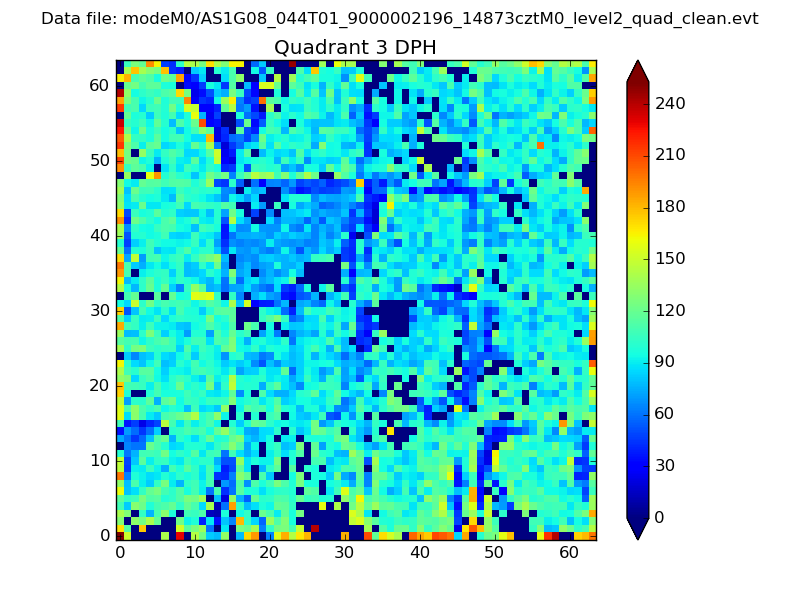 |
 |
Quadrant C |
| Plot type | Count rate plots | Images |
|---|---|---|
| Comparison with Poisson distribution Blue bars denote a histogram of data divided into 1 sec bins. Red curve is a Poisson curve with rate = median count rate of data. |
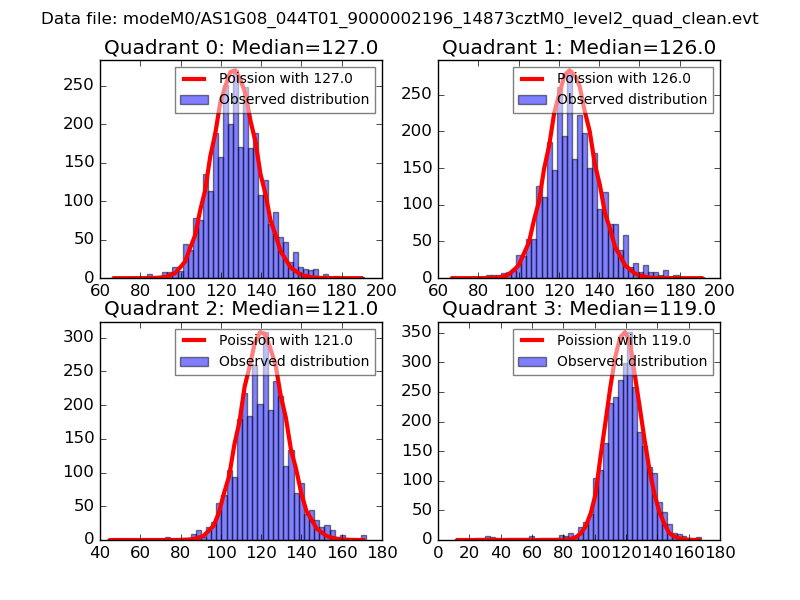 |
 |
| Quadrant-wise count rates Data is divided into 100 sec bins |
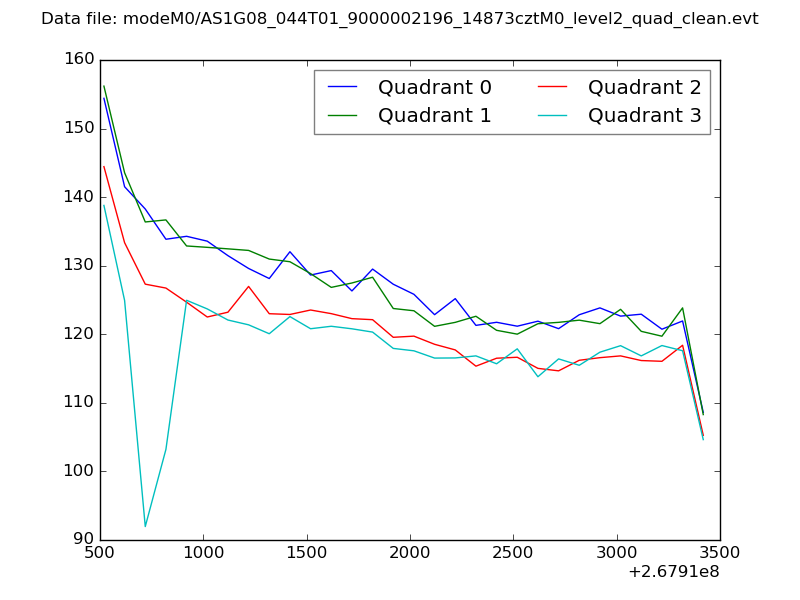 |
|
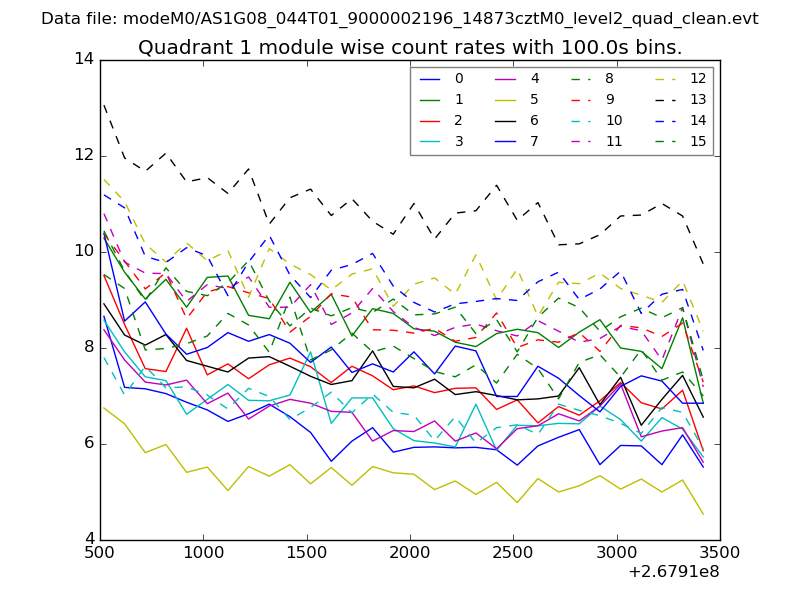
| Module-wise count rates for Quadrant A Data is divided into 100 sec bins |
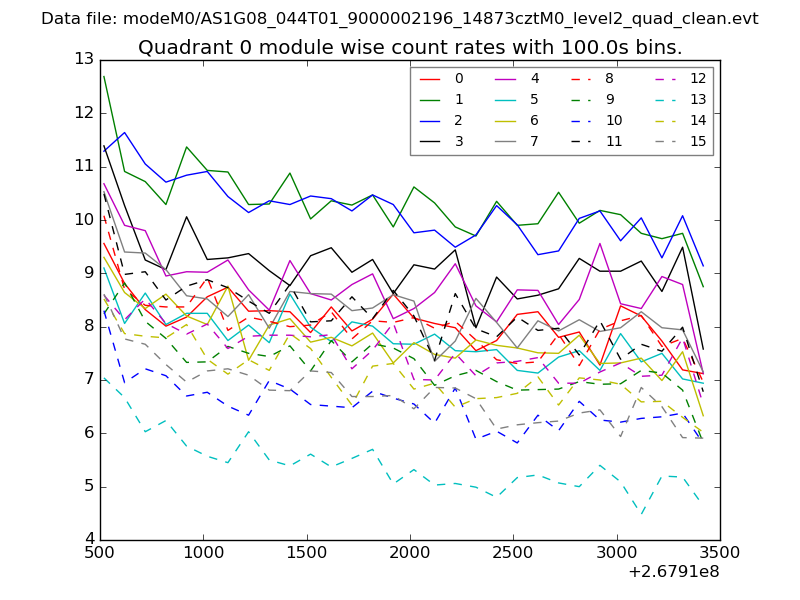 |
 |
| Module-wise count rates for Quadrant B Data is divided into 100 sec bins |
 |
 |
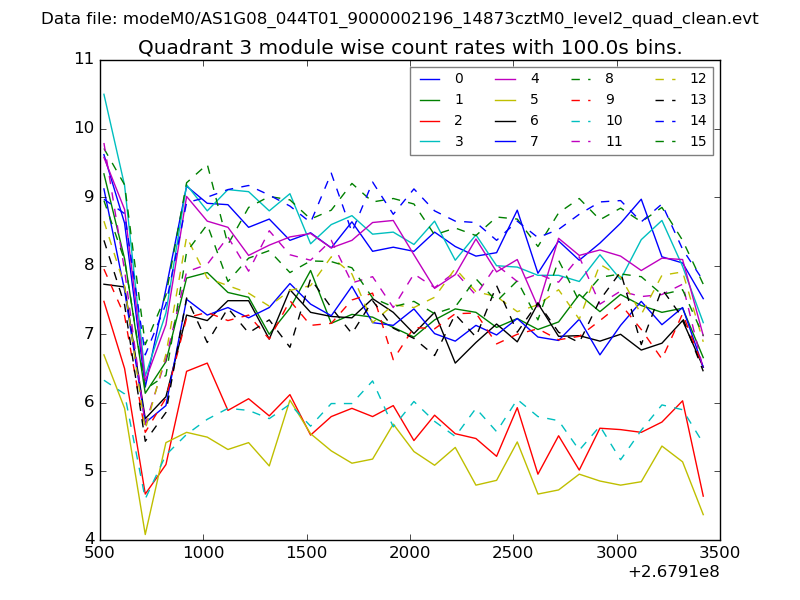
| Module-wise count rates for Quadrant C Data is divided into 100 sec bins |
 |
 |
| Module-wise count rates for Quadrant D Data is divided into 100 sec bins |
 |
 |
| Parameter | Plot |
|---|---|
| CZT HV Monitor |  |
| D_VDD | 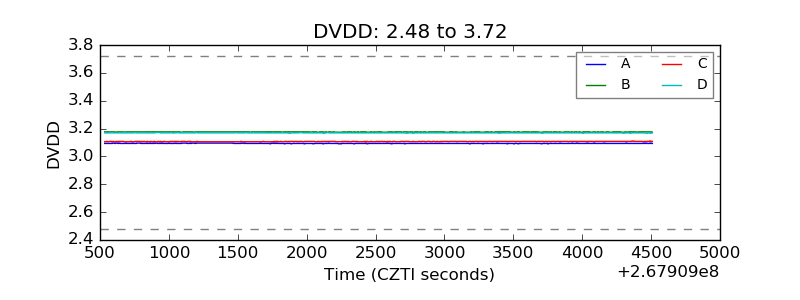 |
| Temperature 1 | 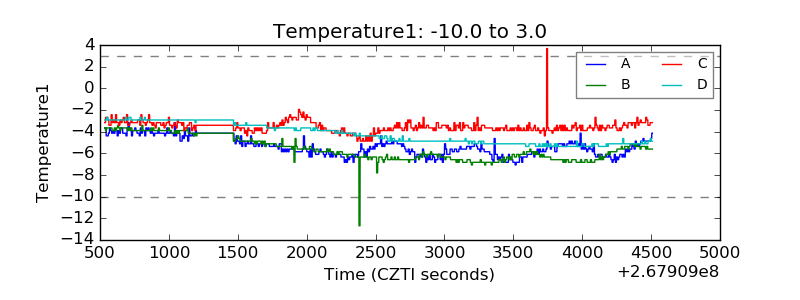 |
| Veto HV Monitor | 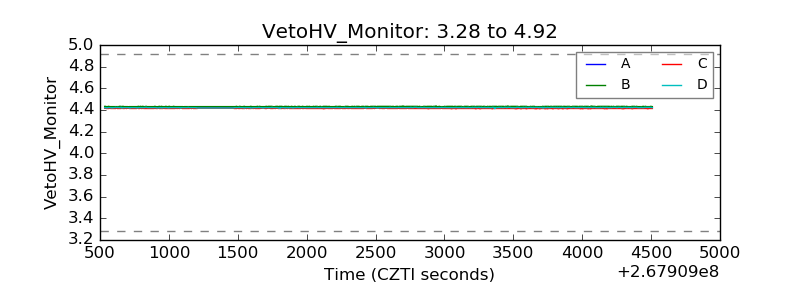 |
| Veto LLD |  |
| Alpha Counter | 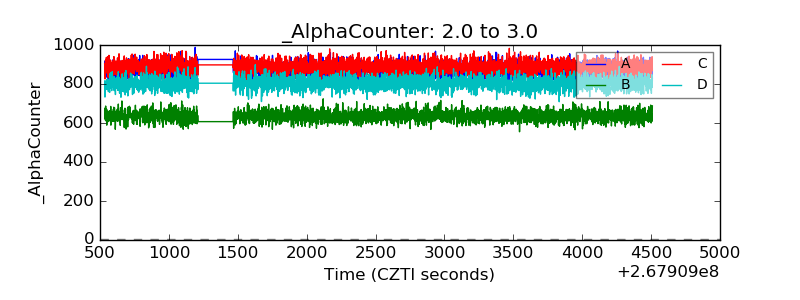 |
| _CPM_Rate | 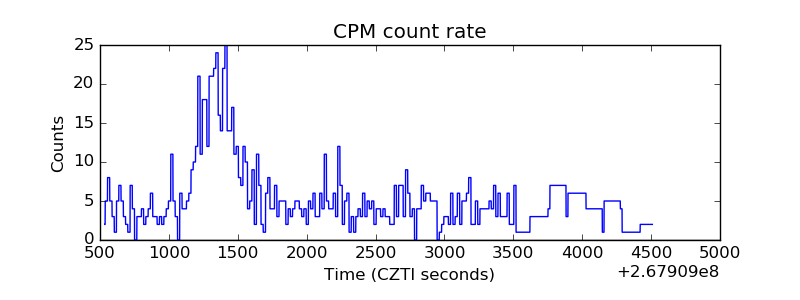 |
| CZT Counter | 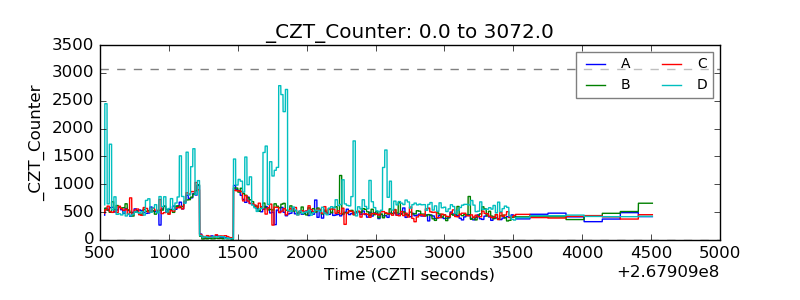 |
| +2.5 Volts monitor |  |
| +5 Volts monitor |  |
| _ROLL_ROT | 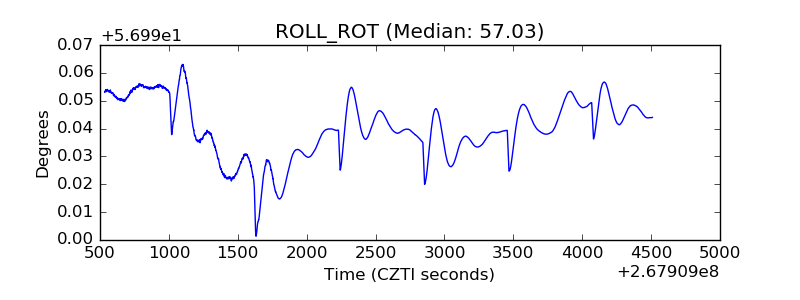 |
| _Roll_DEC | 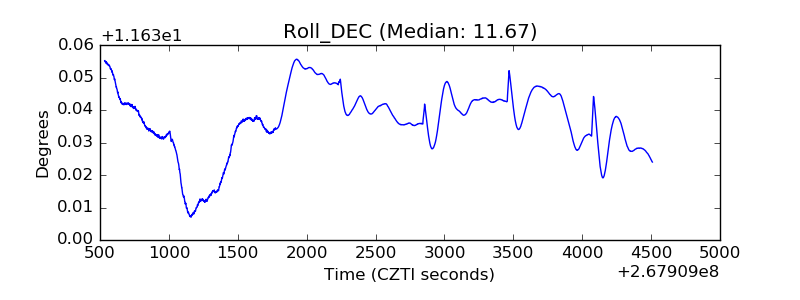 |
| _Roll_RA | 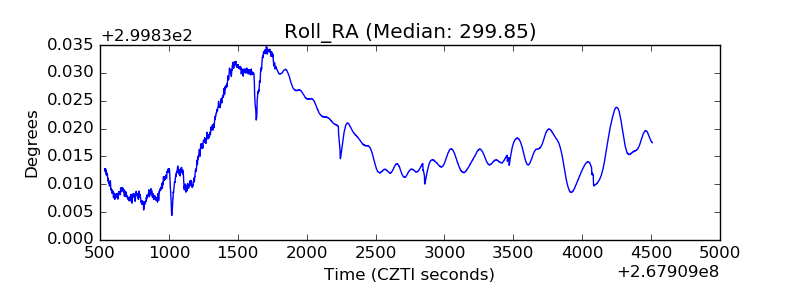 |
| Veto Counter | 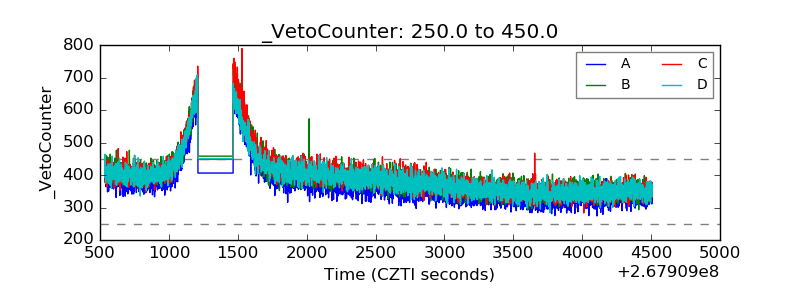 |