| Param | Original file | Final file |
|---|---|---|
| Filename | modeM0/AS1T02_054T01_9000002200cztM0_level2.fits | modeM0/AS1T02_054T01_9000002200cztM0_level2_quad_clean.evt |
| Size (bytes) | 861,523,200 | 895,786,560 |
| Size | 821.6 MB | 854.3 MB |
| Events in quadrant A | 5,376,110 | 5,672,140 |
| Events in quadrant B | 4,945,530 | 5,277,365 |
| Events in quadrant C | 5,251,392 | 5,410,065 |
| Events in quadrant D | 4,414,870 | 4,671,850 |
| Mode SS | |||
|---|---|---|---|
| Quadrant | BADHDUFLAG | Total packets | Discarded packets |
| A | 0 | 1810 | 0 |
| B | 0 | 1810 | 0 |
| C | 0 | 1810 | 0 |
| D | 0 | 1810 | 0 |
| Mode M9 | |||
|---|---|---|---|
| Quadrant | BADHDUFLAG | Total packets | Discarded packets |
| A | 0 | 154 | 0 |
| B | 0 | 154 | 0 |
| C | 0 | 154 | 0 |
| D | 0 | 154 | 0 |
| Mode M0 | |||
|---|---|---|---|
| Quadrant | BADHDUFLAG | Total packets | Discarded packets |
| A | 0 | 186154 | 0 |
| B | 0 | 224647 | 0 |
| C | 0 | 185505 | 0 |
| D | 0 | 259071 | 0 |
| Quadrant | Total seconds | Saturated seconds | Saturation percentage |
|---|---|---|---|
| A | 88972 | 912 | 1.025042% |
| B | 88972 | 5103 | 5.735512% |
| C | 88972 | 641 | 0.720451% |
| D | 88972 | 8139 | 9.147822% |
Noise dominated data is calculated using 1-second bins in cleaned event files. If a bin has >2000 counts, and if more than 50% of those come from <1% of pixels, then it is considered to be noise-dominated and hence unusable.
| Quadrant | # 1 sec bins | Bins with >0 counts | Bins with >2000 counts | High rate bins dominated by noise | Noise dominated (total time) | Noise dominated (detector-on time) | Marked lightcurve |
|---|---|---|---|---|---|---|---|
| A | 103896 | 88971 | 0 | 0 | 0.00% | 0.00% |  |
| B | 103896 | 88833 | 0 | 0 | 0.00% | 0.00% |  |
| C | 103896 | 88972 | 0 | 0 | 0.00% | 0.00% |  |
| D | 103896 | 88741 | 0 | 0 | 0.00% | 0.00% |  |
Top three noisy pixels from each quadrant. If the there are fewer than three noisy pixels in the level2.evt file, extra rows are filled as -1
| Pixel properties | Quadrant properties | ||||||
|---|---|---|---|---|---|---|---|
| Quadrant | DetID | PixID | Counts | Sigma | Mean | Median | Sigma |
| A | 0 | 29 | 5155 | 11.23 | 1402 | 1321 | 341.4 |
| A | 7 | 110 | 4168 | 8.34 | 1402 | 1321 | 341.4 |
| A | 9 | 19 | 4079 | 8.08 | 1402 | 1321 | 341.4 |
| B | 2 | 9 | 4303 | 12.18 | 1310 | 1259 | 250.0 |
| B | 5 | 128 | 3276 | 8.07 | 1310 | 1259 | 250.0 |
| B | 3 | 17 | 3272 | 8.05 | 1310 | 1259 | 250.0 |
| C | 12 | 241 | 3725 | 6.88 | 1388 | 1301 | 352.1 |
| C | 3 | 126 | 3541 | 6.36 | 1388 | 1301 | 352.1 |
| C | 2 | 191 | 3514 | 6.29 | 1388 | 1301 | 352.1 |
| D | 6 | 231 | 3165 | 6.05 | 1260 | 1154 | 332.4 |
| D | 10 | 189 | 3081 | 5.8 | 1260 | 1154 | 332.4 |
| D | 7 | 3 | 3081 | 5.8 | 1260 | 1154 | 332.4 |
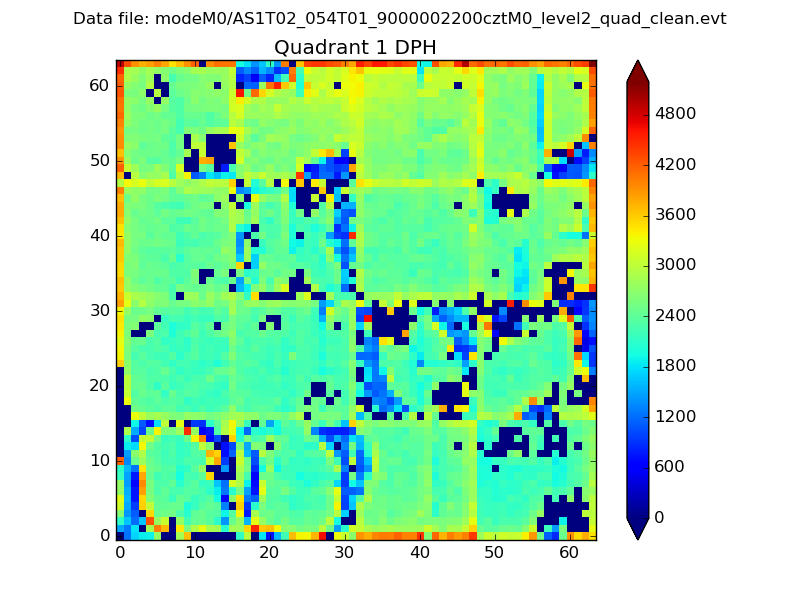
Histogram calculated using DETX and DETY for each event in the final _common_clean file
| Quadrant A |  |
 |
Quadrant B |
|---|---|---|---|
| Quadrant D | 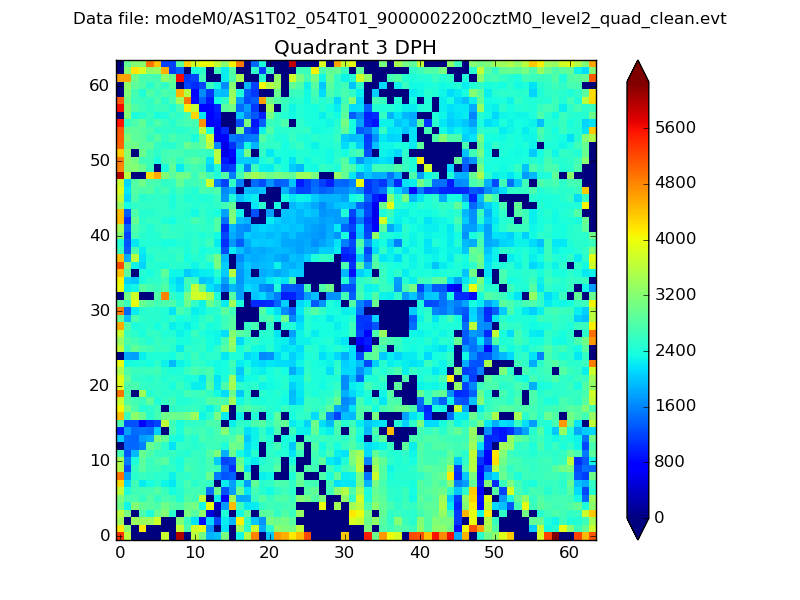 |
 |
Quadrant C |
| Plot type | Count rate plots | Images |
|---|---|---|
| Comparison with Poisson distribution Blue bars denote a histogram of data divided into 1 sec bins. Red curve is a Poisson curve with rate = median count rate of data. |
 |
 |
| Quadrant-wise count rates Data is divided into 100 sec bins |
 |
|
| Module-wise count rates for Quadrant A Data is divided into 100 sec bins |
 |
 |
| Module-wise count rates for Quadrant B Data is divided into 100 sec bins |
 |
 |
| Module-wise count rates for Quadrant C Data is divided into 100 sec bins |
 |
 |
| Module-wise count rates for Quadrant D Data is divided into 100 sec bins |
 |
 |
| Parameter | Plot |
|---|---|
| CZT HV Monitor |  |
| D_VDD | 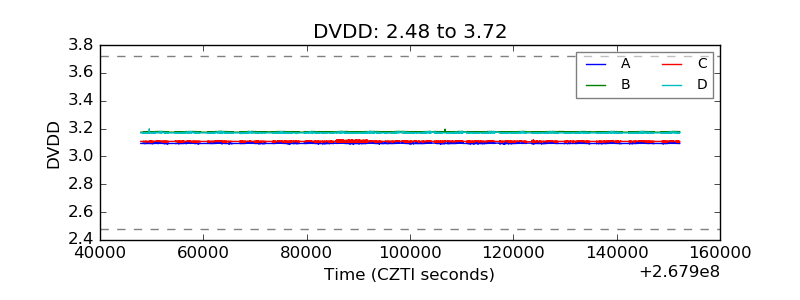 |
| Temperature 1 |  |
| Veto HV Monitor |  |
| Veto LLD |  |
| Alpha Counter |  |
| _CPM_Rate |  |
| CZT Counter |  |
| +2.5 Volts monitor |  |
| +5 Volts monitor |  |
| _ROLL_ROT |  |
| _Roll_DEC |  |
| _Roll_RA |  |
| Veto Counter |  |