| Param | Original file | Final file |
|---|---|---|
| Filename | modeM0/AS1T02_054T01_9000002200_14877cztM0_level2.evt | modeM0/AS1T02_054T01_9000002200_14877cztM0_level2_quad_clean.evt |
| Size (bytes) | 95,690,880 | 30,286,080 |
| Size | 91.3 MB | 28.9 MB |
| Events in quadrant A | 703,071 | 207,228 |
| Events in quadrant B | 696,709 | 208,424 |
| Events in quadrant C | 728,743 | 205,522 |
| Events in quadrant D | 680,190 | 200,230 |
| Mode SS | |||
|---|---|---|---|
| Quadrant | BADHDUFLAG | Total packets | Discarded packets |
| A | 0 | 24 | 0 |
| B | 0 | 24 | 0 |
| C | 0 | 24 | 0 |
| D | 0 | 24 | 0 |
| Mode M9 | |||
|---|---|---|---|
| Quadrant | BADHDUFLAG | Total packets | Discarded packets |
| A | 0 | 5 | 0 |
| B | 0 | 5 | 0 |
| C | 0 | 5 | 0 |
| D | 0 | 5 | 0 |
| Mode M0 | |||
|---|---|---|---|
| Quadrant | BADHDUFLAG | Total packets | Discarded packets |
| A | 0 | 2848 | 2 |
| B | 0 | 2851 | 1 |
| C | 0 | 2957 | 1 |
| D | 0 | 2791 | 1 |
| Quadrant | Total seconds | Saturated seconds | Saturation percentage |
|---|---|---|---|
| A | 1273 | 4 | 0.314218% |
| B | 1273 | 3 | 0.235664% |
| C | 1273 | 6 | 0.471328% |
| D | 1273 | 5 | 0.392773% |
Noise dominated data is calculated using 1-second bins in cleaned event files. If a bin has >2000 counts, and if more than 50% of those come from <1% of pixels, then it is considered to be noise-dominated and hence unusable.
| Quadrant | # 1 sec bins | Bins with >0 counts | Bins with >2000 counts | High rate bins dominated by noise | Noise dominated (total time) | Noise dominated (detector-on time) | Marked lightcurve |
|---|---|---|---|---|---|---|---|
| A | 1274 | 1274 | 0 | 0 | 0.00% | 0.00% | 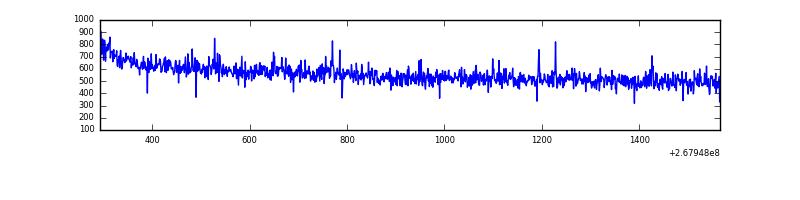 |
| B | 1274 | 1274 | 0 | 0 | 0.00% | 0.00% | 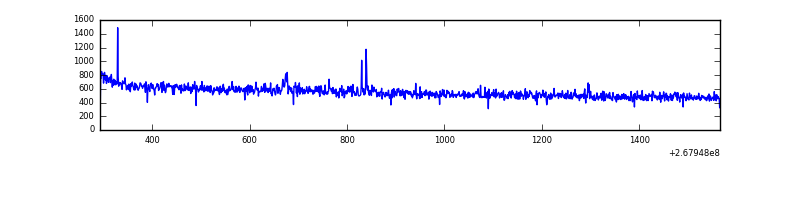 |
| C | 1274 | 1274 | 0 | 0 | 0.00% | 0.00% | 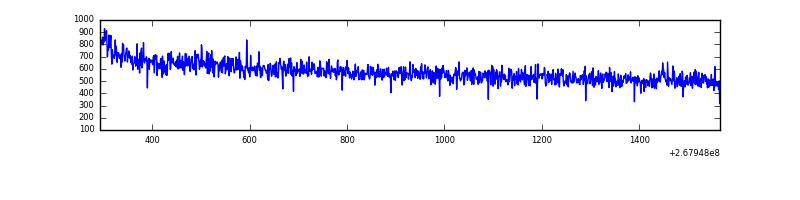 |
| D | 1274 | 1274 | 0 | 0 | 0.00% | 0.00% | 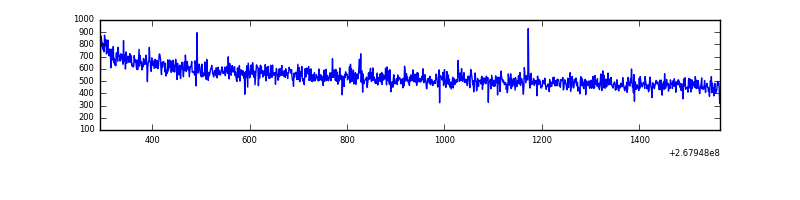 |
Top three noisy pixels from each quadrant. If the there are fewer than three noisy pixels in the level2.evt file, extra rows are filled as -1
| Pixel properties | Quadrant properties | ||||||
|---|---|---|---|---|---|---|---|
| Quadrant | DetID | PixID | Counts | Sigma | Mean | Median | Sigma |
| A | 12 | 189 | 11705 | 305.06 | 179 | 176 | 37.8 |
| A | 9 | 143 | 1649 | 38.98 | 179 | 176 | 37.8 |
| A | 0 | 226 | 1536 | 35.99 | 179 | 176 | 37.8 |
| B | 0 | 189 | 4167 | 115.69 | 177 | 172 | 34.5 |
| B | 12 | 111 | 3713 | 102.54 | 177 | 172 | 34.5 |
| B | 11 | 111 | 3085 | 84.36 | 177 | 172 | 34.5 |
| C | 3 | 233 | 26052 | 618.44 | 179 | 180 | 41.8 |
| C | 0 | 207 | 3136 | 70.66 | 179 | 180 | 41.8 |
| C | 13 | 61 | 1254 | 25.67 | 179 | 180 | 41.8 |
| D | 2 | 234 | 3953 | 83.7 | 178 | 173 | 45.2 |
| D | 13 | 104 | 3467 | 72.94 | 178 | 173 | 45.2 |
| D | 3 | 238 | 2816 | 58.52 | 178 | 173 | 45.2 |
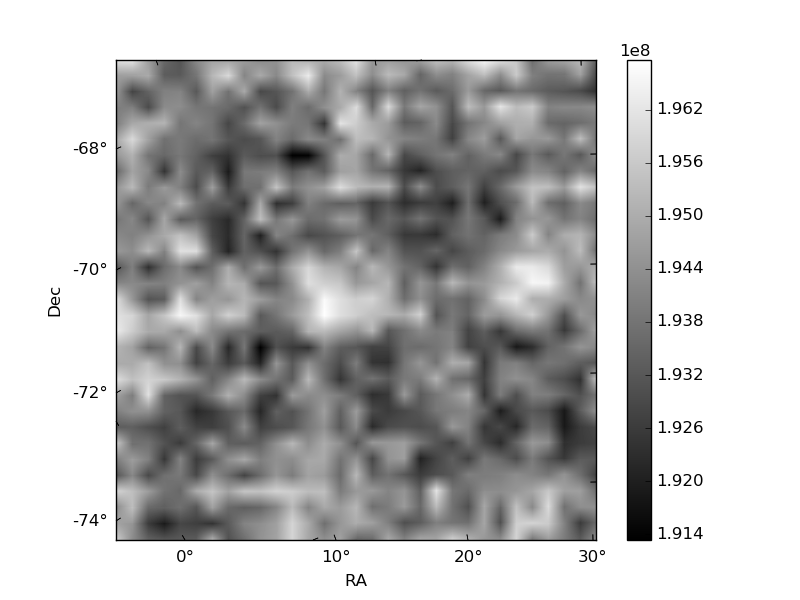
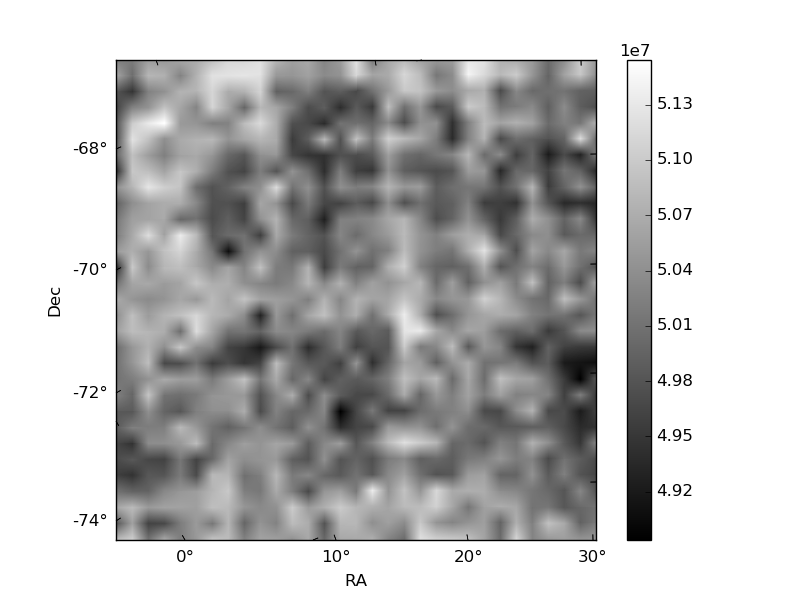
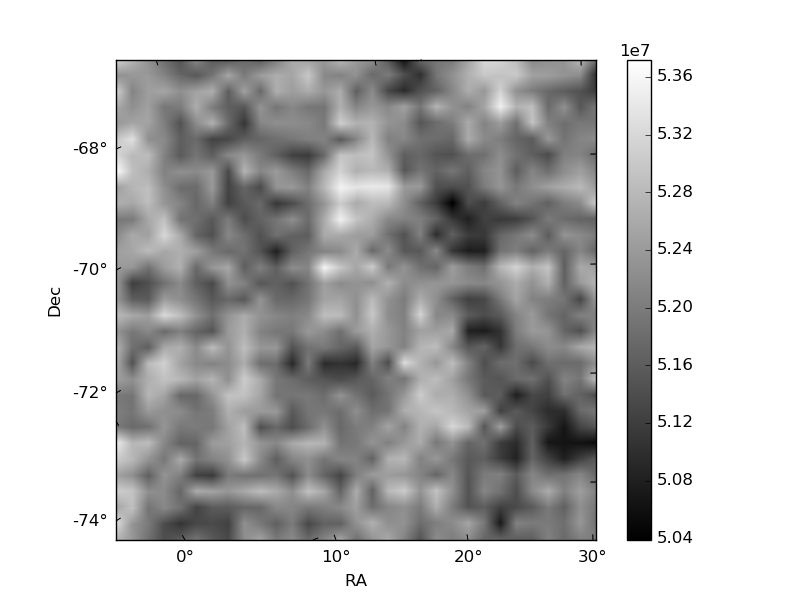
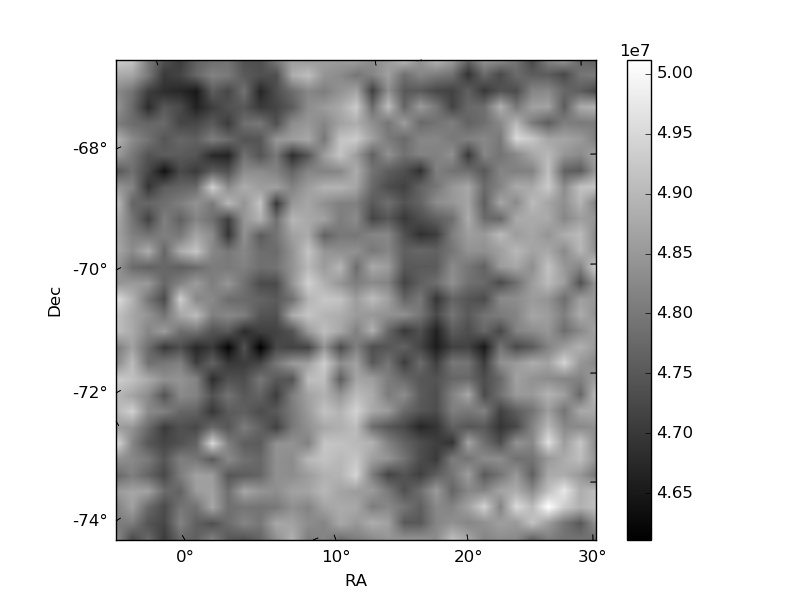
Histogram calculated using DETX and DETY for each event in the final _common_clean file
| Quadrant A |  |
 |
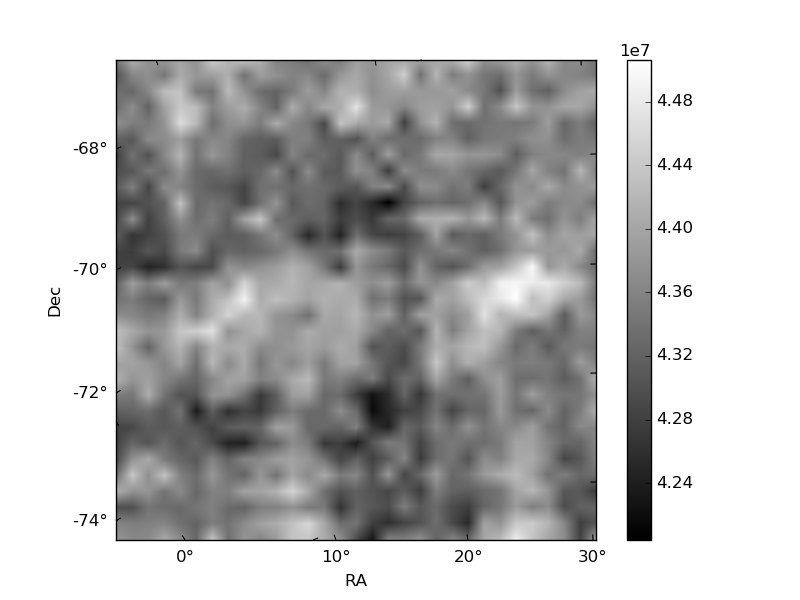
Quadrant B |
|---|---|---|---|
| Quadrant D |  |
 |
Quadrant C |
| Plot type | Count rate plots | Images |
|---|---|---|
| Comparison with Poisson distribution Blue bars denote a histogram of data divided into 1 sec bins. Red curve is a Poisson curve with rate = median count rate of data. |
 |
 |
| Quadrant-wise count rates Data is divided into 100 sec bins |
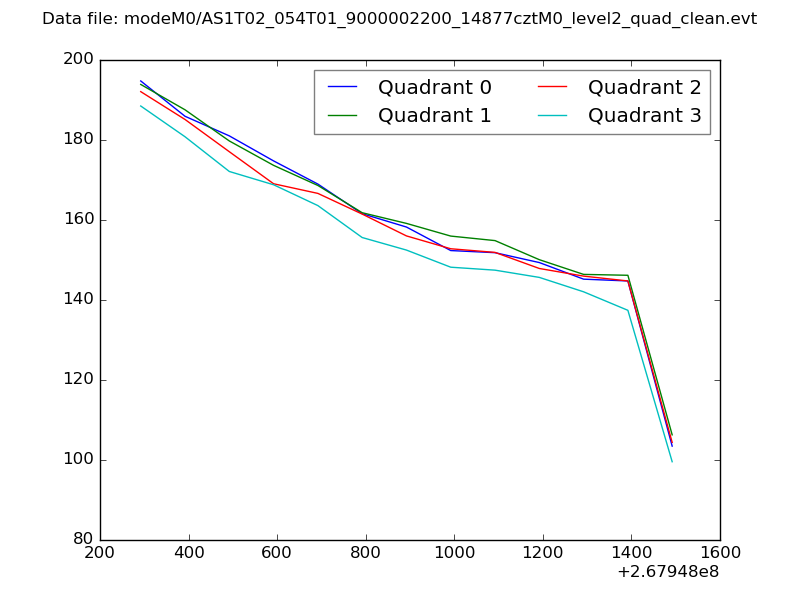 |
|
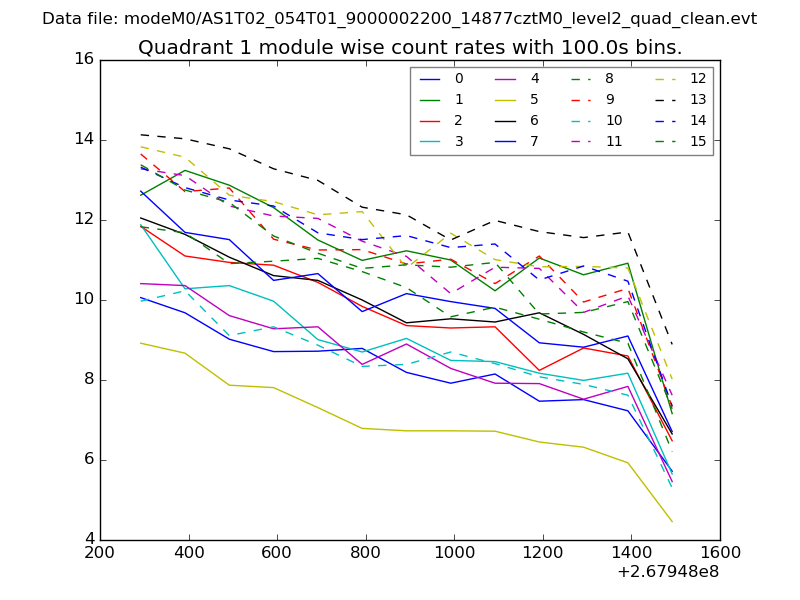
| Module-wise count rates for Quadrant A Data is divided into 100 sec bins |
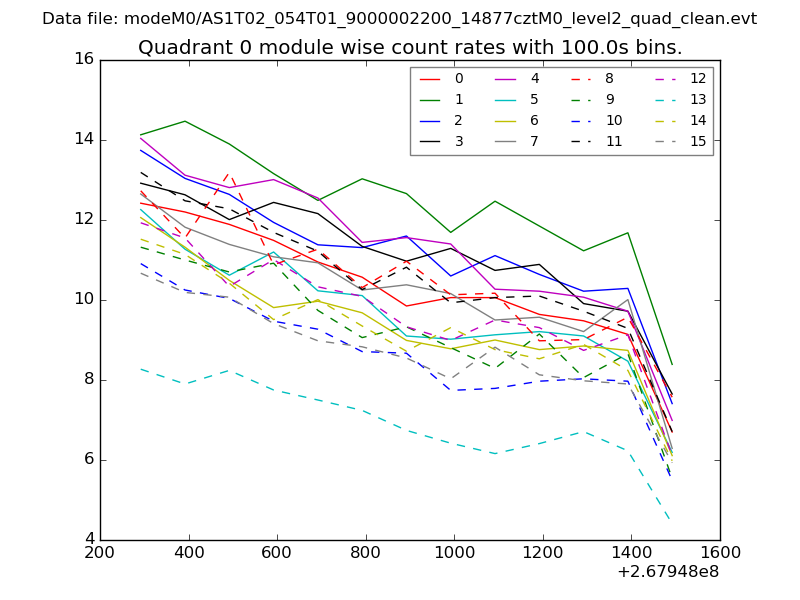 |
 |
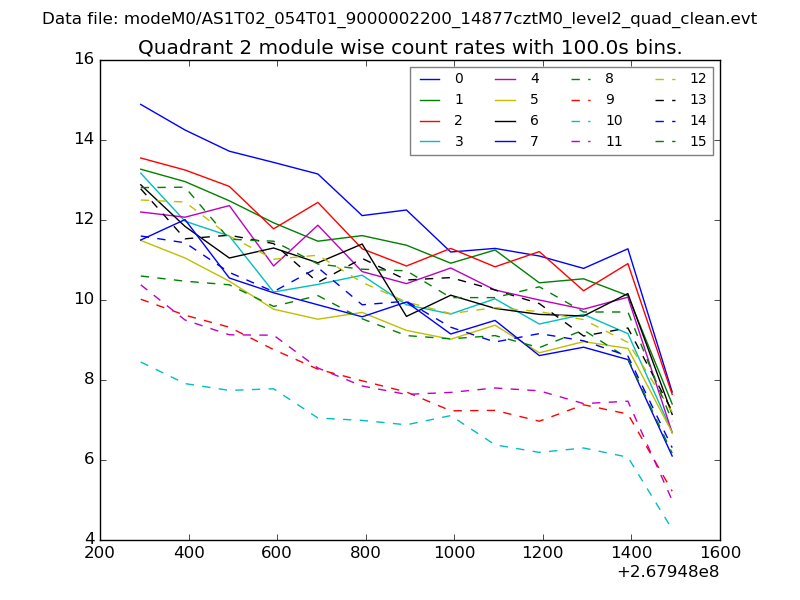
| Module-wise count rates for Quadrant B Data is divided into 100 sec bins |
 |
 |
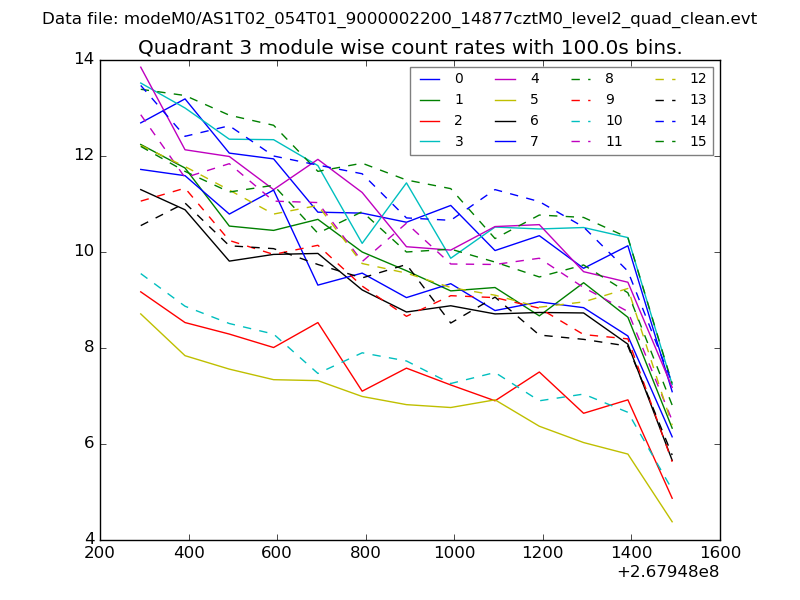
| Module-wise count rates for Quadrant C Data is divided into 100 sec bins |
 |
 |
| Module-wise count rates for Quadrant D Data is divided into 100 sec bins |
 |
 |
| Parameter | Plot |
|---|---|
| CZT HV Monitor | 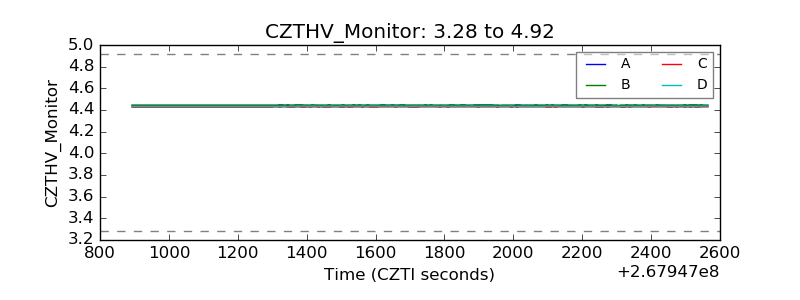 |
| D_VDD | 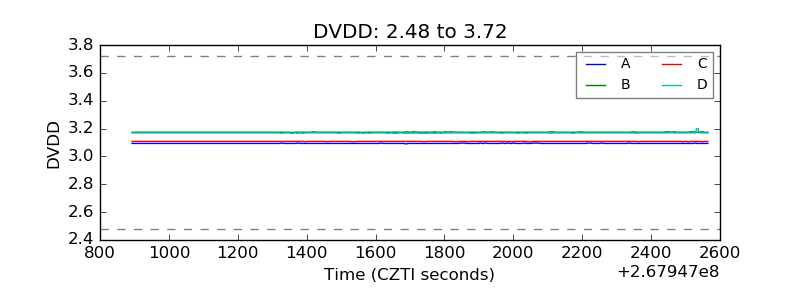 |
| Temperature 1 | 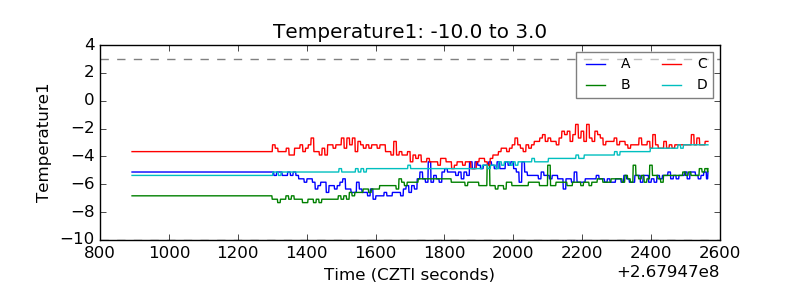 |
| Veto HV Monitor |  |
| Veto LLD | 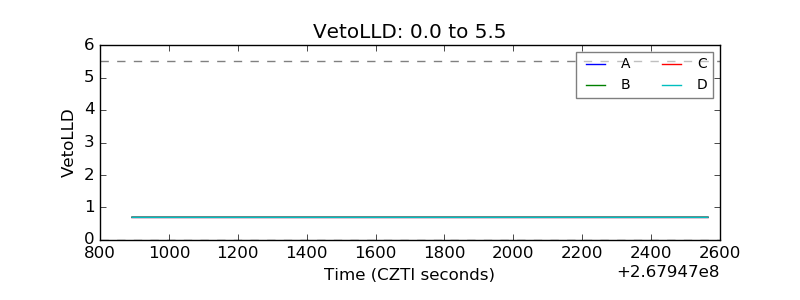 |
| Alpha Counter | 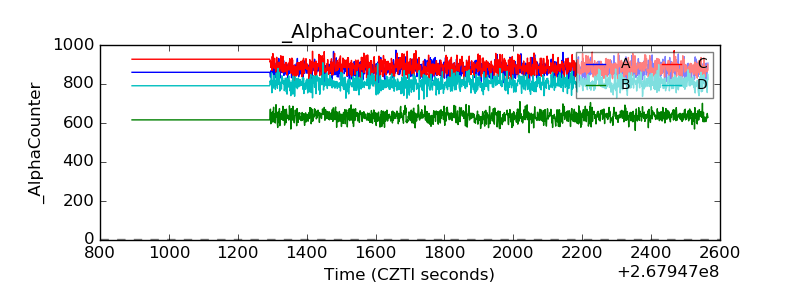 |
| _CPM_Rate | 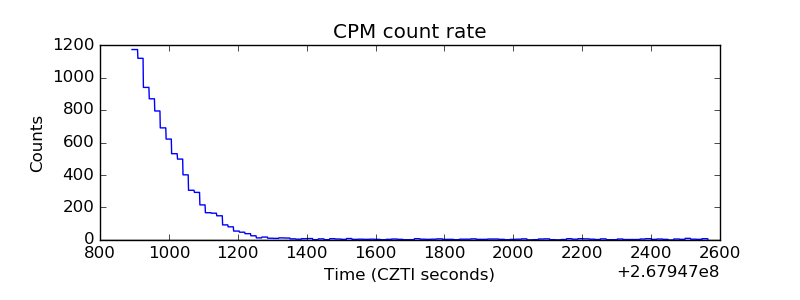 |
| CZT Counter |  |
| +2.5 Volts monitor |  |
| +5 Volts monitor | 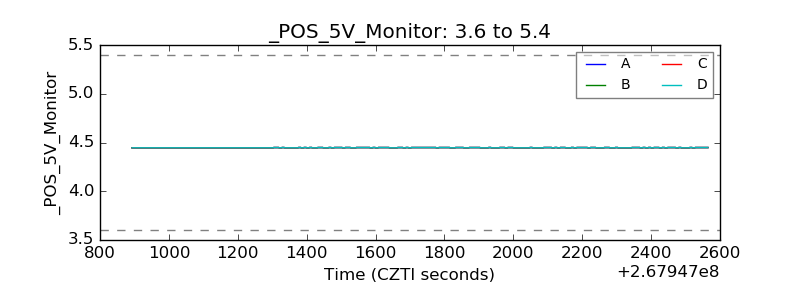 |
| _ROLL_ROT | 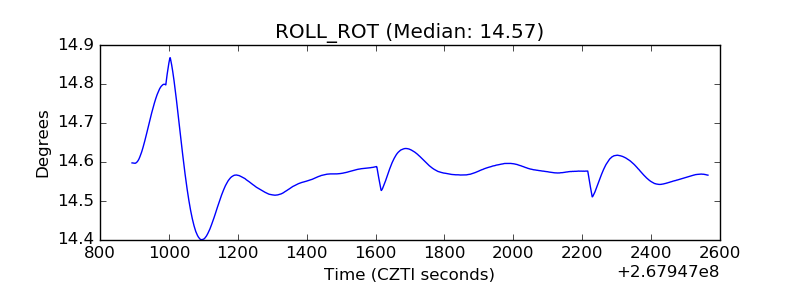 |
| _Roll_DEC |  |
| _Roll_RA | 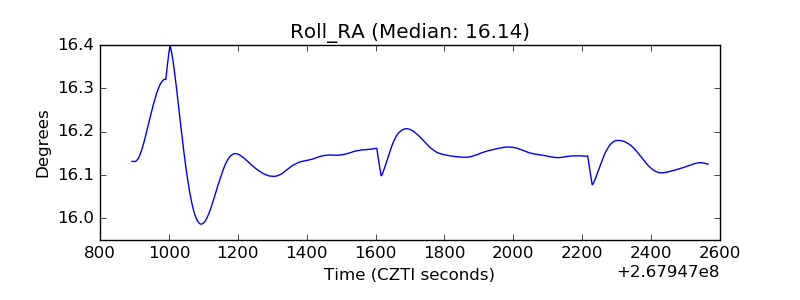 |
| Veto Counter | 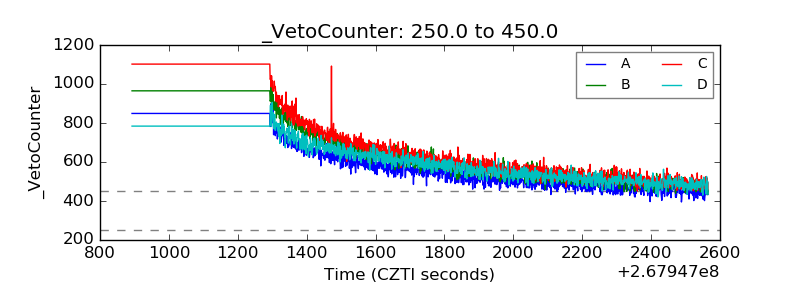 |