| Param | Original file | Final file |
|---|---|---|
| Filename | modeM0/AS1T02_054T01_9000002200_14878cztM0_level2.evt | modeM0/AS1T02_054T01_9000002200_14878cztM0_level2_quad_clean.evt |
| Size (bytes) | 469,025,280 | 117,354,240 |
| Size | 447.3 MB | 111.9 MB |
| Events in quadrant A | 3,220,291 | 789,035 |
| Events in quadrant B | 3,437,058 | 789,194 |
| Events in quadrant C | 3,304,081 | 787,213 |
| Events in quadrant D | 3,816,760 | 750,886 |
| Mode SS | |||
|---|---|---|---|
| Quadrant | BADHDUFLAG | Total packets | Discarded packets |
| A | 0 | 128 | 0 |
| B | 0 | 128 | 0 |
| C | 0 | 128 | 0 |
| D | 0 | 128 | 0 |
| Mode M9 | |||
|---|---|---|---|
| Quadrant | BADHDUFLAG | Total packets | Discarded packets |
| A | 0 | 13 | 0 |
| B | 0 | 14 | 0 |
| C | 0 | 14 | 0 |
| D | 0 | 14 | 0 |
| Mode M0 | |||
|---|---|---|---|
| Quadrant | BADHDUFLAG | Total packets | Discarded packets |
| A | 0 | 13473 | 0 |
| B | 0 | 14104 | 0 |
| C | 0 | 13725 | 0 |
| D | 0 | 15265 | 0 |
| Quadrant | Total seconds | Saturated seconds | Saturation percentage |
|---|---|---|---|
| A | 6274 | 75 | 1.195410% |
| B | 6274 | 93 | 1.482308% |
| C | 6274 | 74 | 1.179471% |
| D | 6274 | 303 | 4.829455% |
Noise dominated data is calculated using 1-second bins in cleaned event files. If a bin has >2000 counts, and if more than 50% of those come from <1% of pixels, then it is considered to be noise-dominated and hence unusable.
| Quadrant | # 1 sec bins | Bins with >0 counts | Bins with >2000 counts | High rate bins dominated by noise | Noise dominated (total time) | Noise dominated (detector-on time) | Marked lightcurve |
|---|---|---|---|---|---|---|---|
| A | 7509 | 6275 | 3 | 3 | 0.04% | 0.05% | 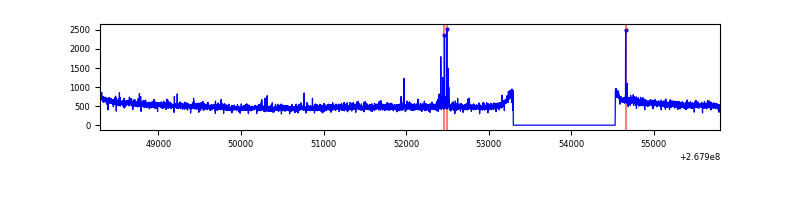 |
| B | 7509 | 6275 | 12 | 12 | 0.16% | 0.19% | 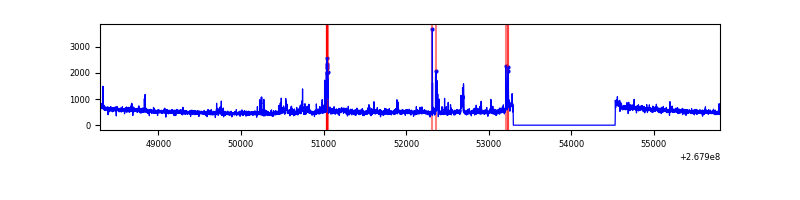 |
| C | 7509 | 6275 | 2 | 2 | 0.03% | 0.03% | 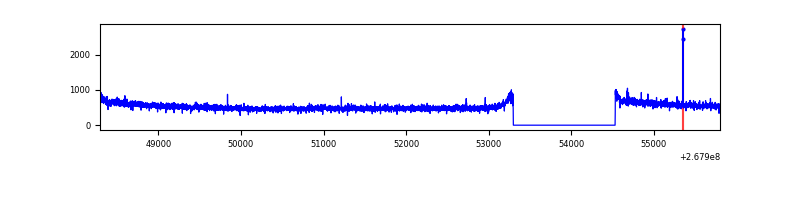 |
| D | 7509 | 6275 | 233 | 233 | 3.10% | 3.71% | 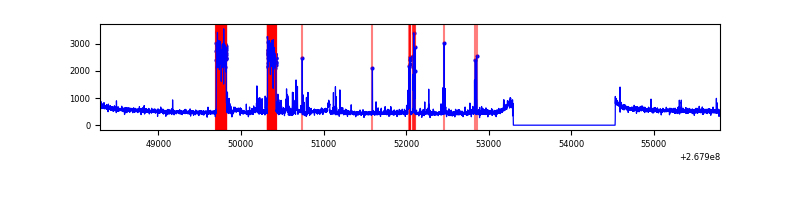 |
Top three noisy pixels from each quadrant. If the there are fewer than three noisy pixels in the level2.evt file, extra rows are filled as -1
| Pixel properties | Quadrant properties | ||||||
|---|---|---|---|---|---|---|---|
| Quadrant | DetID | PixID | Counts | Sigma | Mean | Median | Sigma |
| A | 12 | 189 | 44231 | 265.69 | 817 | 801 | 163.5 |
| A | 13 | 248 | 23411 | 138.32 | 817 | 801 | 163.5 |
| A | 0 | 226 | 7282 | 39.65 | 817 | 801 | 163.5 |
| B | 0 | 219 | 115212 | 771.81 | 802 | 784 | 148.3 |
| B | 0 | 189 | 45534 | 301.83 | 802 | 784 | 148.3 |
| B | 0 | 228 | 38184 | 252.26 | 802 | 784 | 148.3 |
| C | 3 | 233 | 171948 | 950.28 | 798 | 803 | 180.1 |
| C | 14 | 234 | 8435 | 42.38 | 798 | 803 | 180.1 |
| C | 0 | 207 | 6848 | 33.56 | 798 | 803 | 180.1 |
| D | 13 | 104 | 693900 | 3557.09 | 790 | 770 | 194.9 |
| D | 7 | 254 | 64922 | 329.22 | 790 | 770 | 194.9 |
| D | 7 | 38 | 28063 | 140.07 | 790 | 770 | 194.9 |
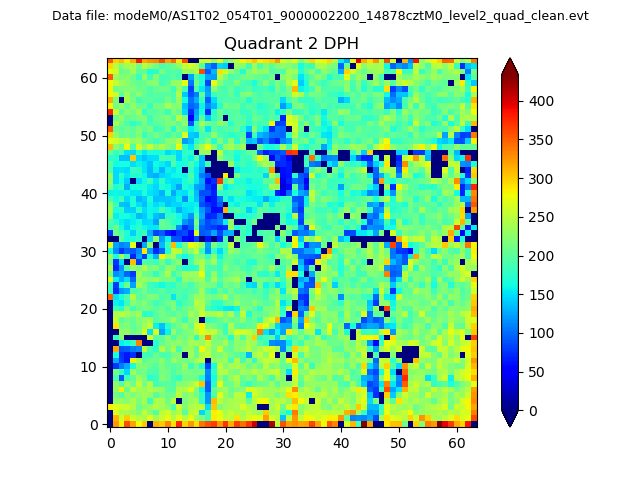
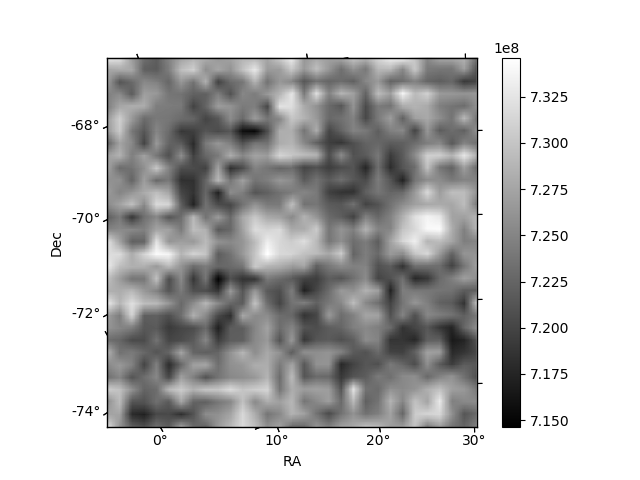
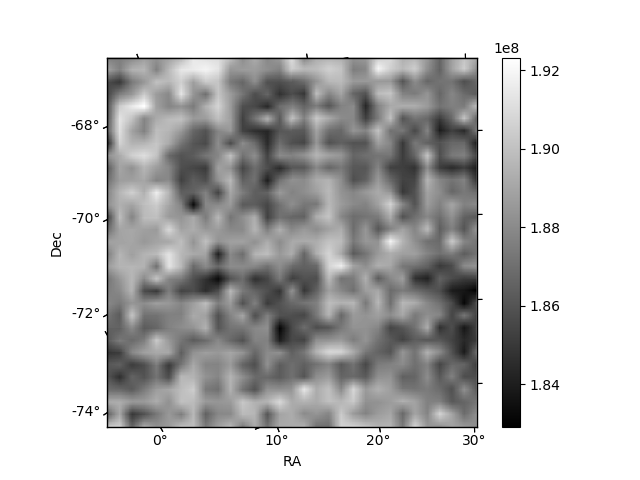
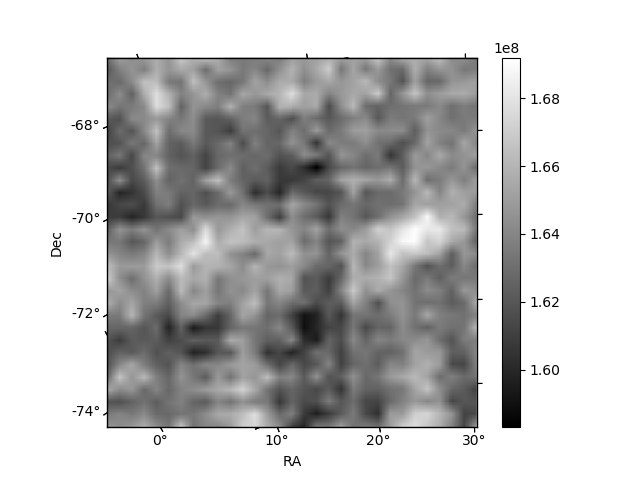
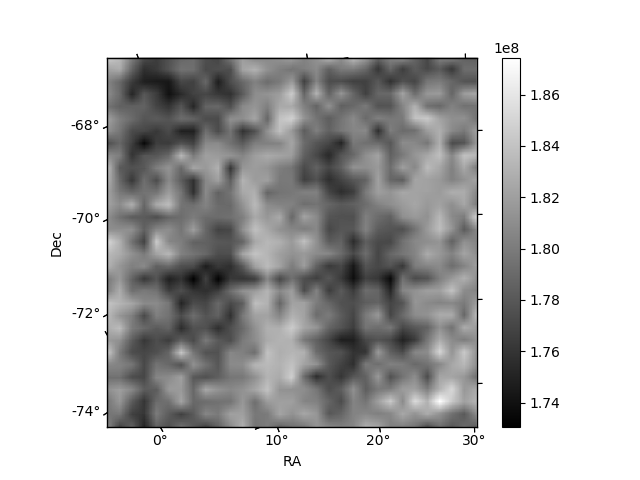
Histogram calculated using DETX and DETY for each event in the final _common_clean file
| Quadrant A | 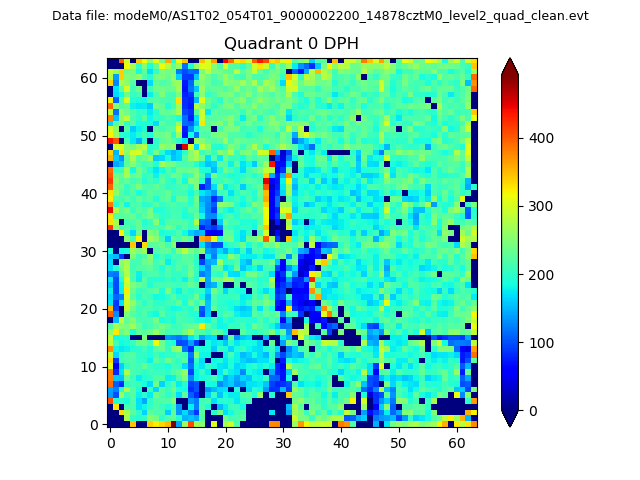 |
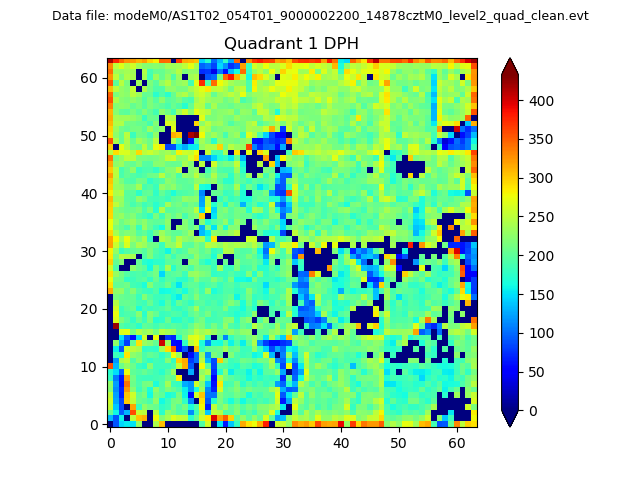 |
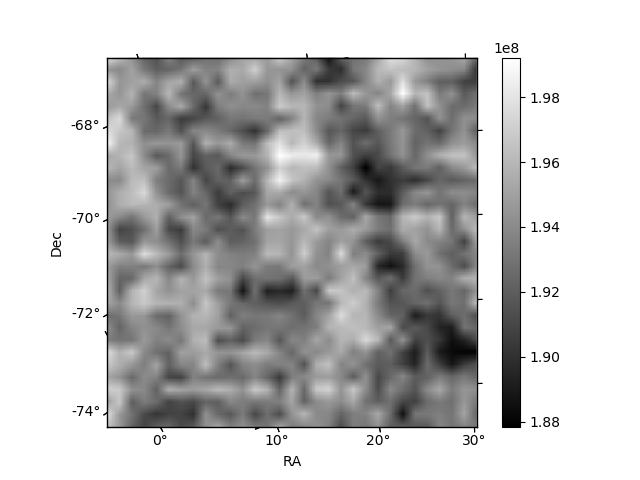
Quadrant B |
|---|---|---|---|
| Quadrant D | 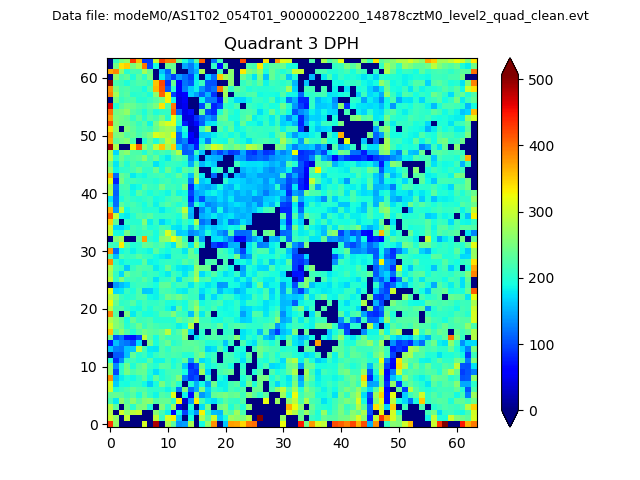 |
 |
Quadrant C |
| Plot type | Count rate plots | Images |
|---|---|---|
| Comparison with Poisson distribution Blue bars denote a histogram of data divided into 1 sec bins. Red curve is a Poisson curve with rate = median count rate of data. |
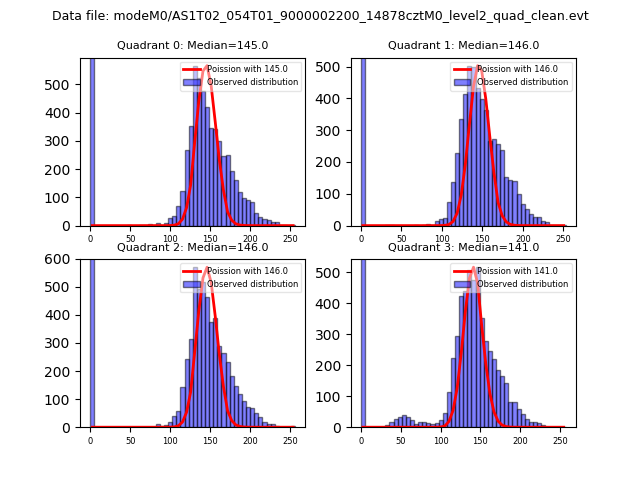 |
 |
| Quadrant-wise count rates Data is divided into 100 sec bins |
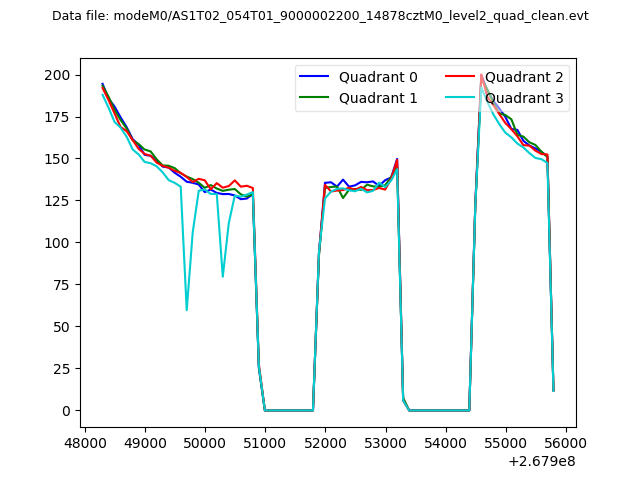 |
|
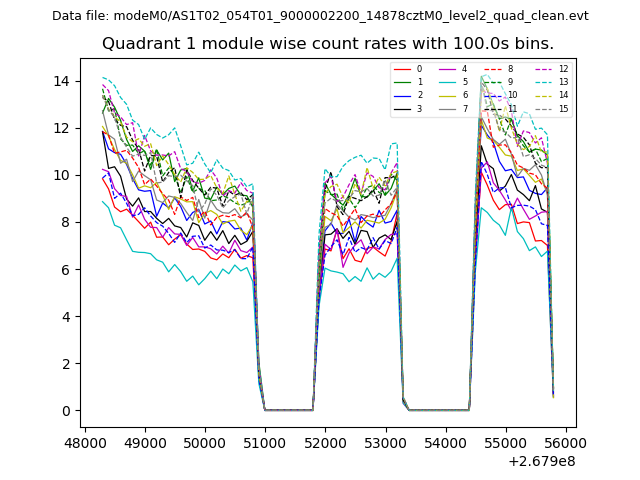
| Module-wise count rates for Quadrant A Data is divided into 100 sec bins |
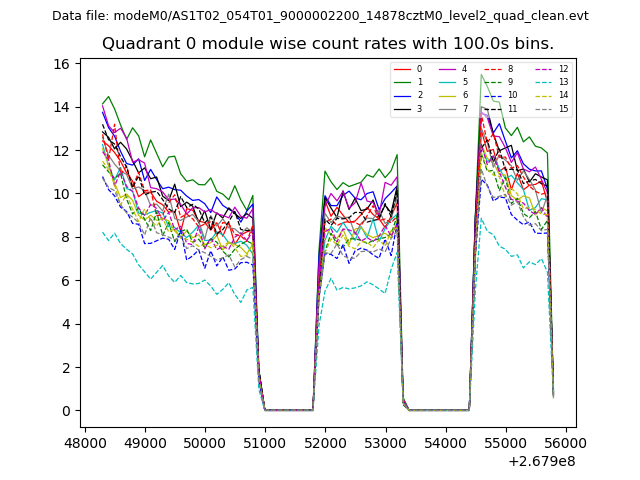 |
 |
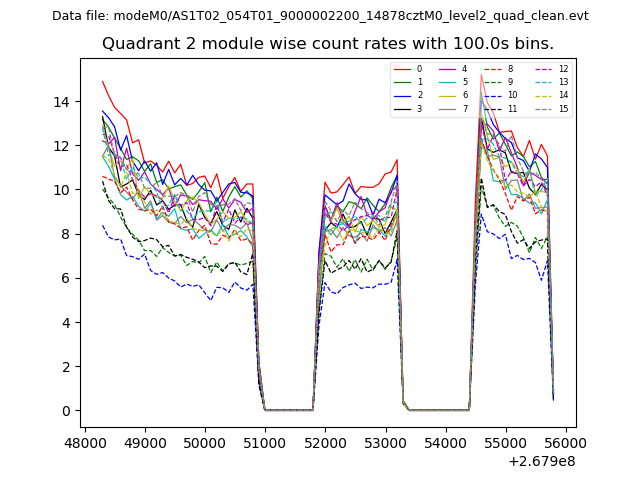
| Module-wise count rates for Quadrant B Data is divided into 100 sec bins |
 |
 |
| Module-wise count rates for Quadrant C Data is divided into 100 sec bins |
 |
 |
| Module-wise count rates for Quadrant D Data is divided into 100 sec bins |
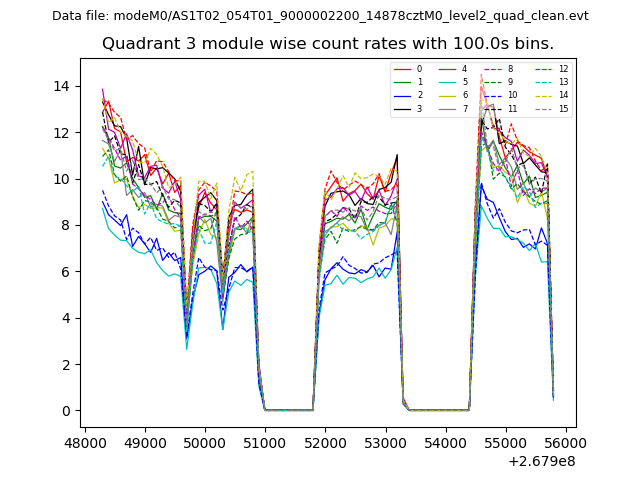 |
 |
| Parameter | Plot |
|---|---|
| CZT HV Monitor | 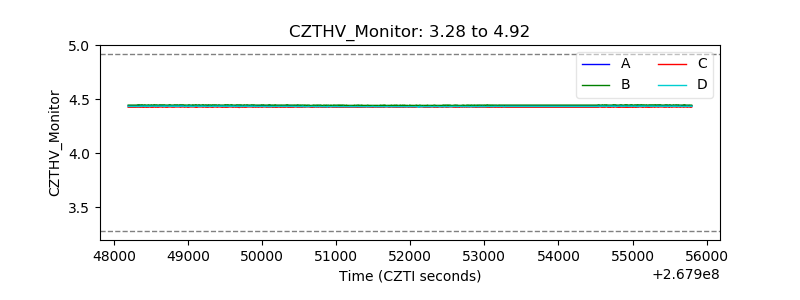 |
| D_VDD | 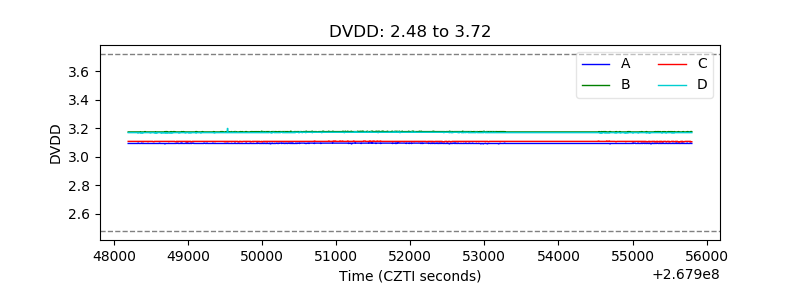 |
| Temperature 1 | 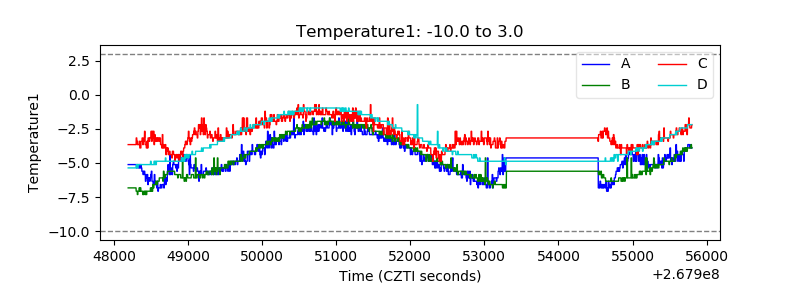 |
| Veto HV Monitor | 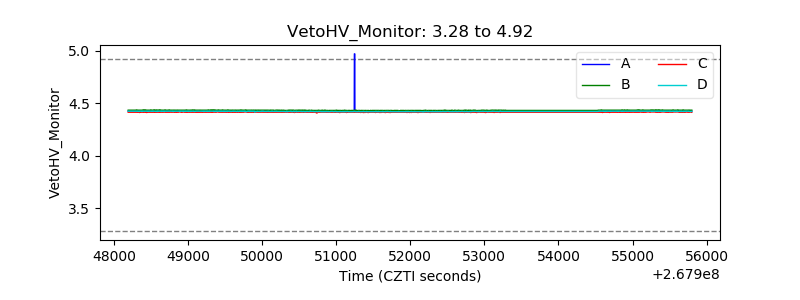 |
| Veto LLD | 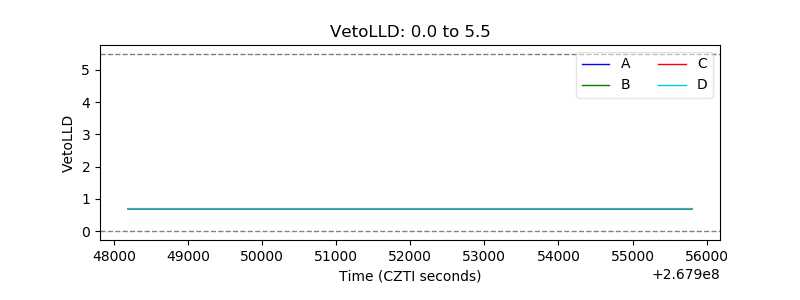 |
| Alpha Counter | 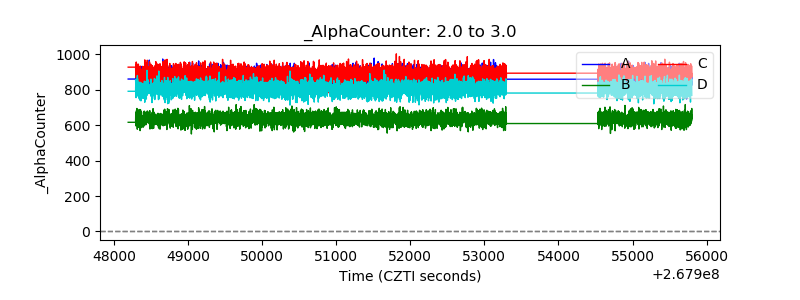 |
| _CPM_Rate | 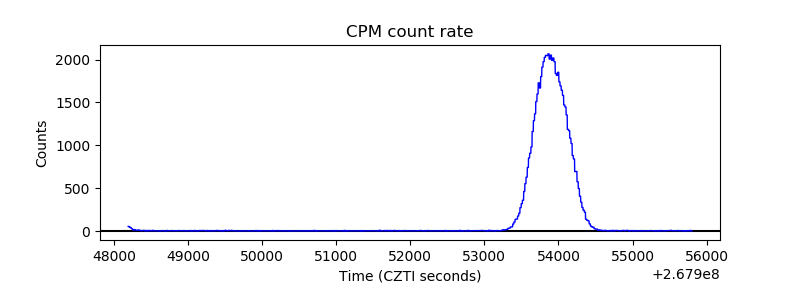 |
| CZT Counter | 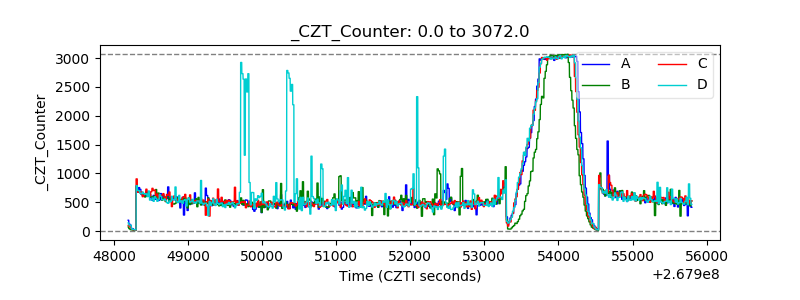 |
| +2.5 Volts monitor |  |
| +5 Volts monitor | 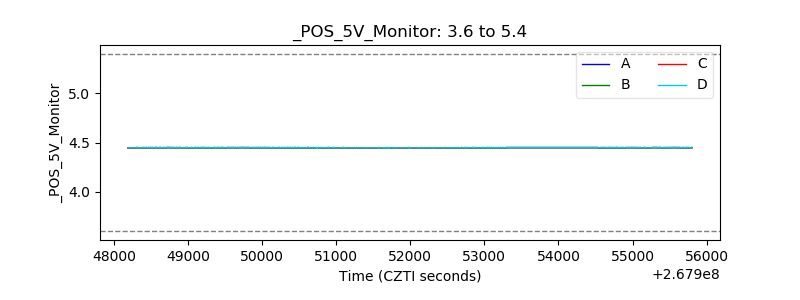 |
| _ROLL_ROT | 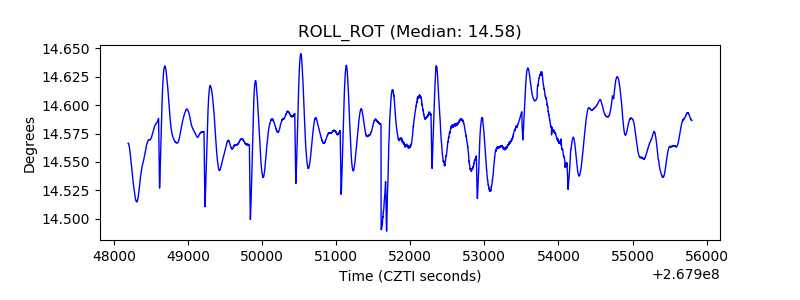 |
| _Roll_DEC | 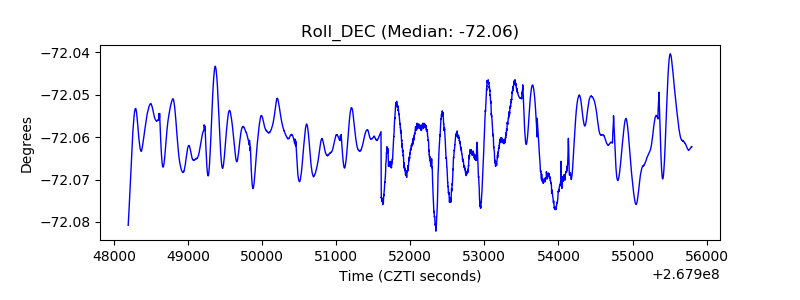 |
| _Roll_RA | 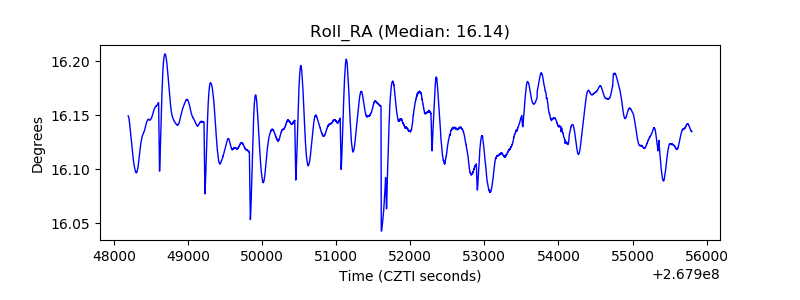 |
| Veto Counter | 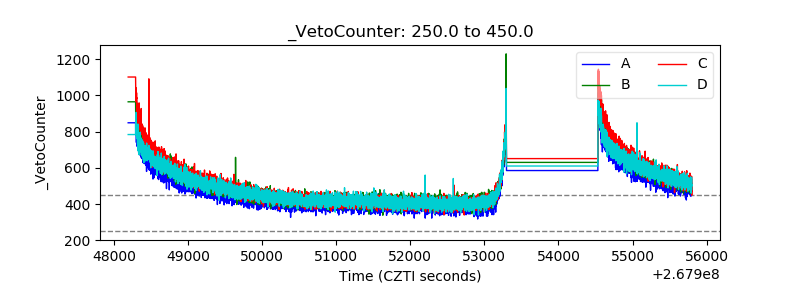 |