| Param | Original file | Final file |
|---|---|---|
| Filename | modeM0/AS1T02_054T01_9000002200_14879cztM0_level2.evt | modeM0/AS1T02_054T01_9000002200_14879cztM0_level2_quad_clean.evt |
| Size (bytes) | 436,740,480 | 113,958,720 |
| Size | 416.5 MB | 108.7 MB |
| Events in quadrant A | 3,086,280 | 765,256 |
| Events in quadrant B | 3,240,694 | 762,843 |
| Events in quadrant C | 3,192,841 | 760,321 |
| Events in quadrant D | 3,295,414 | 740,093 |
| Mode SS | |||
|---|---|---|---|
| Quadrant | BADHDUFLAG | Total packets | Discarded packets |
| A | 0 | 122 | 0 |
| B | 0 | 122 | 0 |
| C | 0 | 122 | 0 |
| D | 0 | 122 | 0 |
| Mode M9 | |||
|---|---|---|---|
| Quadrant | BADHDUFLAG | Total packets | Discarded packets |
| A | 0 | 14 | 0 |
| B | 0 | 14 | 0 |
| C | 0 | 14 | 0 |
| D | 0 | 14 | 0 |
| Mode M0 | |||
|---|---|---|---|
| Quadrant | BADHDUFLAG | Total packets | Discarded packets |
| A | 0 | 12737 | 2 |
| B | 0 | 13260 | 1 |
| C | 0 | 13042 | 1 |
| D | 0 | 13503 | 1 |
| Quadrant | Total seconds | Saturated seconds | Saturation percentage |
|---|---|---|---|
| A | 6062 | 44 | 0.725833% |
| B | 6062 | 49 | 0.808314% |
| C | 6062 | 52 | 0.857803% |
| D | 6062 | 110 | 1.814583% |
Noise dominated data is calculated using 1-second bins in cleaned event files. If a bin has >2000 counts, and if more than 50% of those come from <1% of pixels, then it is considered to be noise-dominated and hence unusable.
| Quadrant | # 1 sec bins | Bins with >0 counts | Bins with >2000 counts | High rate bins dominated by noise | Noise dominated (total time) | Noise dominated (detector-on time) | Marked lightcurve |
|---|---|---|---|---|---|---|---|
| A | 7388 | 6064 | 0 | 0 | 0.00% | 0.00% | 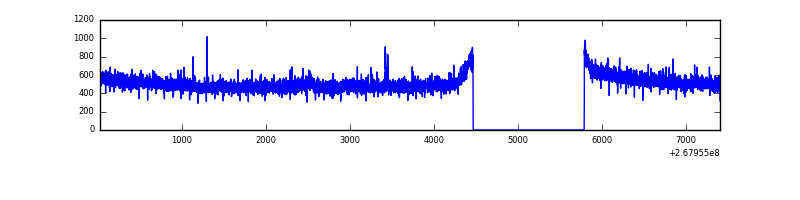 |
| B | 7388 | 6064 | 7 | 7 | 0.09% | 0.12% | 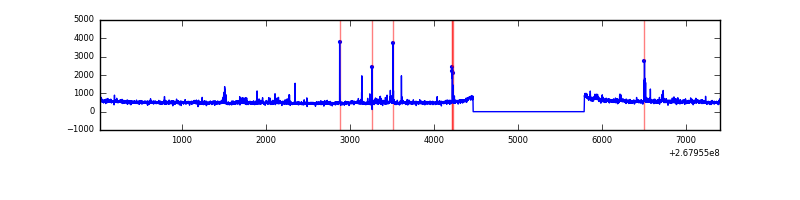 |
| C | 7388 | 6064 | 7 | 7 | 0.09% | 0.12% | 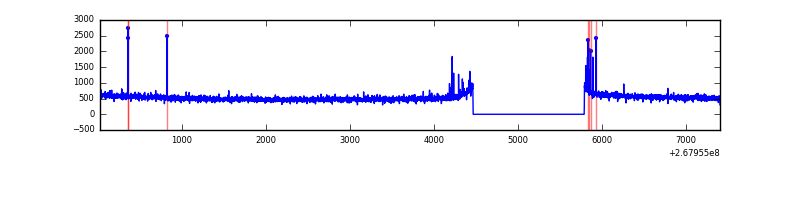 |
| D | 7388 | 6064 | 52 | 52 | 0.70% | 0.86% | 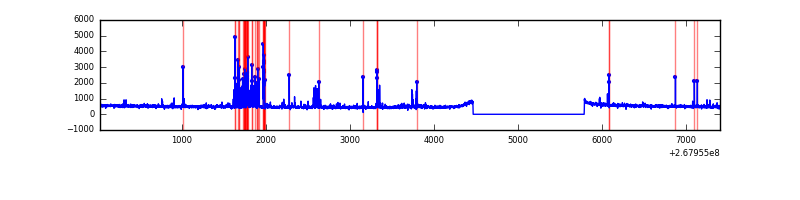 |
Top three noisy pixels from each quadrant. If the there are fewer than three noisy pixels in the level2.evt file, extra rows are filled as -1
| Pixel properties | Quadrant properties | ||||||
|---|---|---|---|---|---|---|---|
| Quadrant | DetID | PixID | Counts | Sigma | Mean | Median | Sigma |
| A | 12 | 189 | 30475 | 189.44 | 791 | 778 | 156.8 |
| A | 0 | 226 | 7179 | 40.83 | 791 | 778 | 156.8 |
| A | 12 | 194 | 6179 | 34.45 | 791 | 778 | 156.8 |
| B | 0 | 189 | 72255 | 497.74 | 774 | 756 | 143.6 |
| B | 3 | 64 | 57955 | 398.19 | 774 | 756 | 143.6 |
| B | 0 | 219 | 22823 | 153.62 | 774 | 756 | 143.6 |
| C | 3 | 233 | 164873 | 951.09 | 763 | 767 | 172.5 |
| C | 0 | 207 | 31544 | 178.37 | 763 | 767 | 172.5 |
| C | 14 | 234 | 8951 | 47.43 | 763 | 767 | 172.5 |
| D | 7 | 254 | 289002 | 1593.15 | 769 | 751 | 180.9 |
| D | 2 | 120 | 32075 | 173.13 | 769 | 751 | 180.9 |
| D | 2 | 234 | 24261 | 129.94 | 769 | 751 | 180.9 |
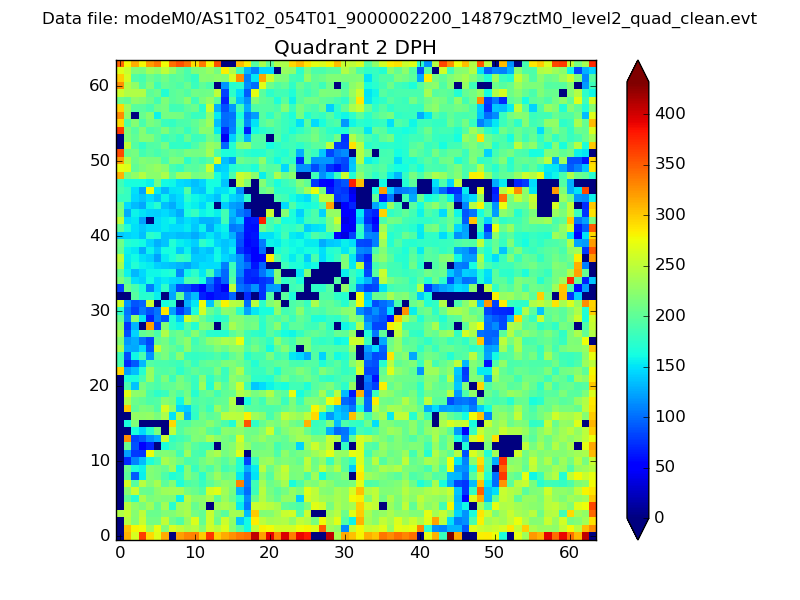
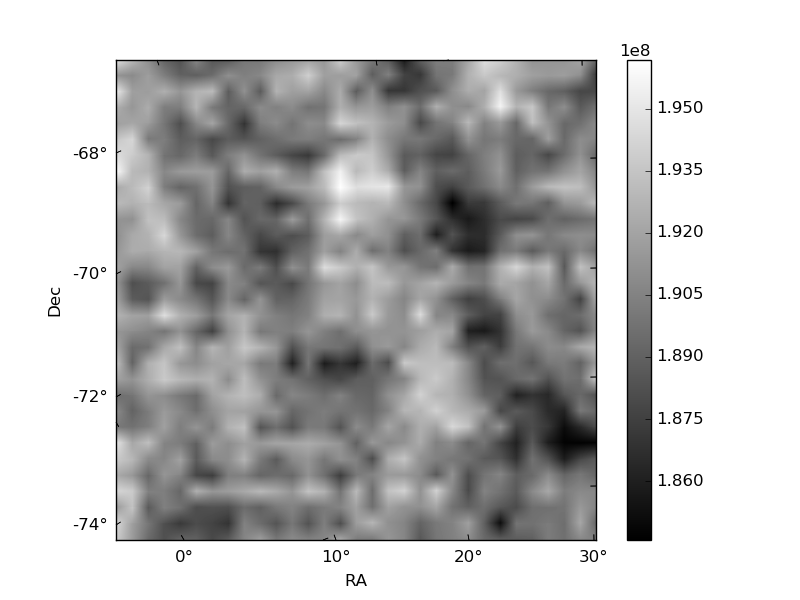
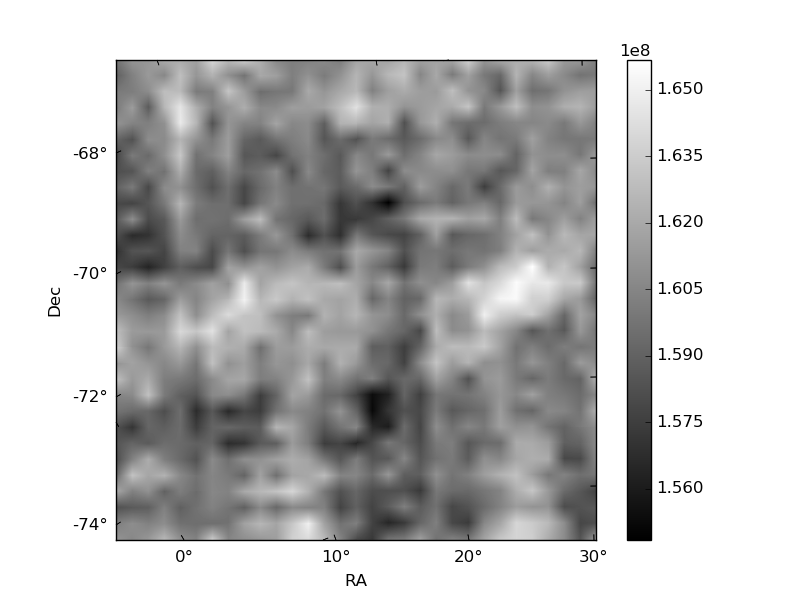
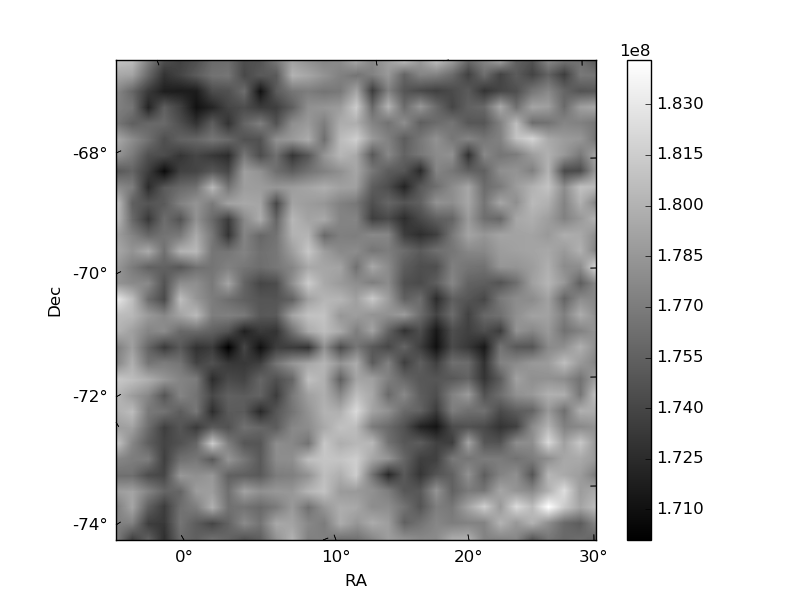
Histogram calculated using DETX and DETY for each event in the final _common_clean file
| Quadrant A | 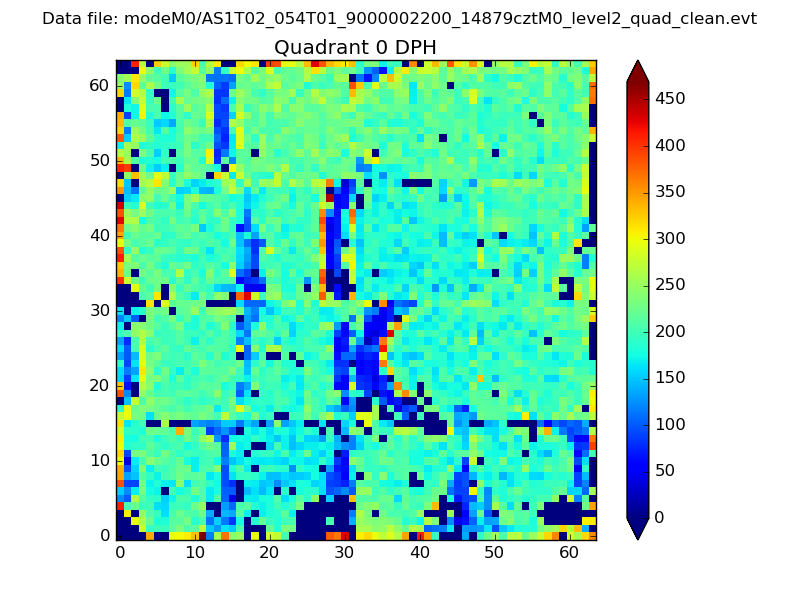 |
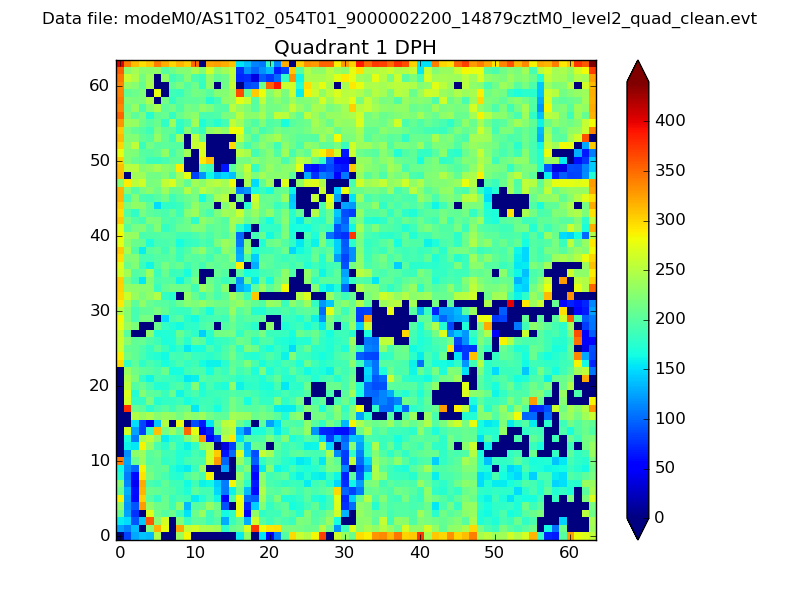 |
Quadrant B |
|---|---|---|---|
| Quadrant D | 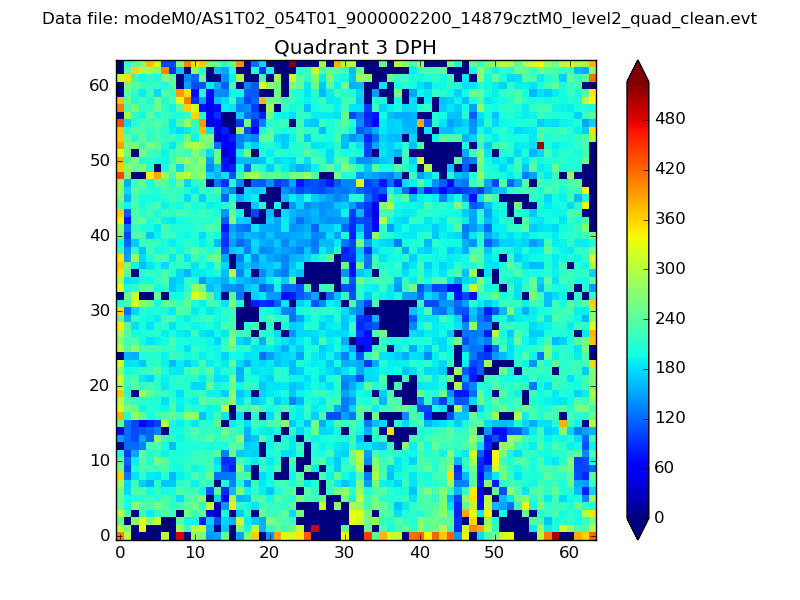 |
 |
Quadrant C |
| Plot type | Count rate plots | Images |
|---|---|---|
| Comparison with Poisson distribution Blue bars denote a histogram of data divided into 1 sec bins. Red curve is a Poisson curve with rate = median count rate of data. |
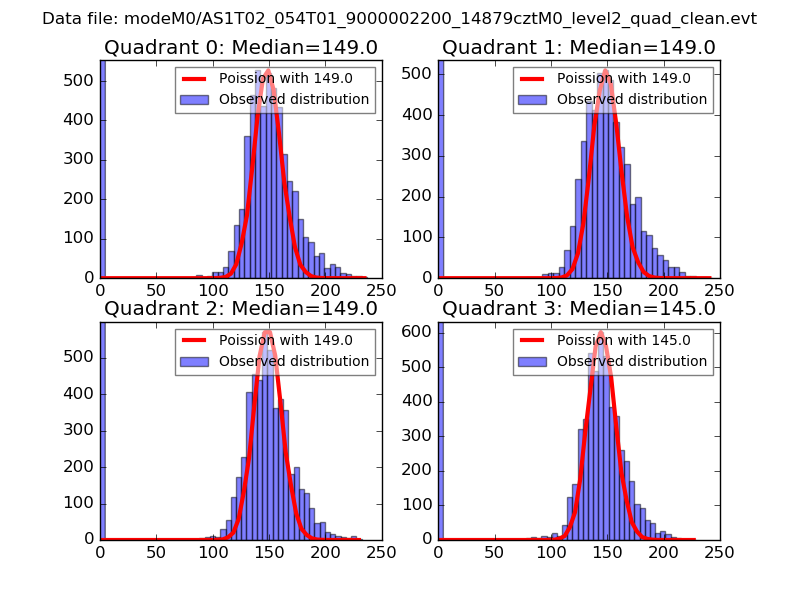 |
 |
| Quadrant-wise count rates Data is divided into 100 sec bins |
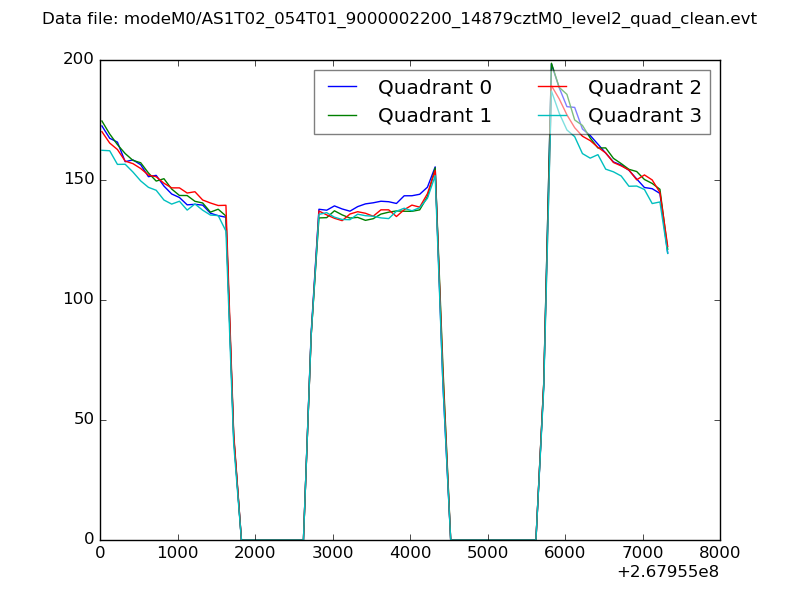 |
|
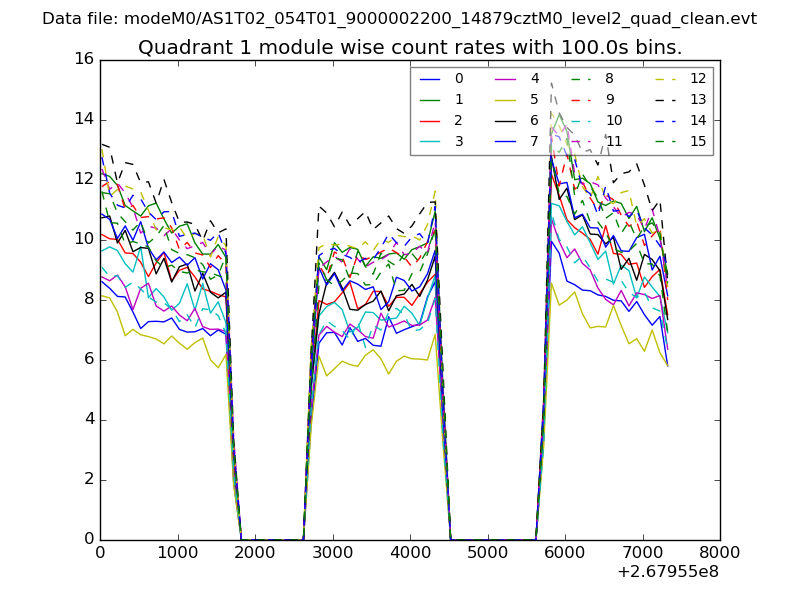
| Module-wise count rates for Quadrant A Data is divided into 100 sec bins |
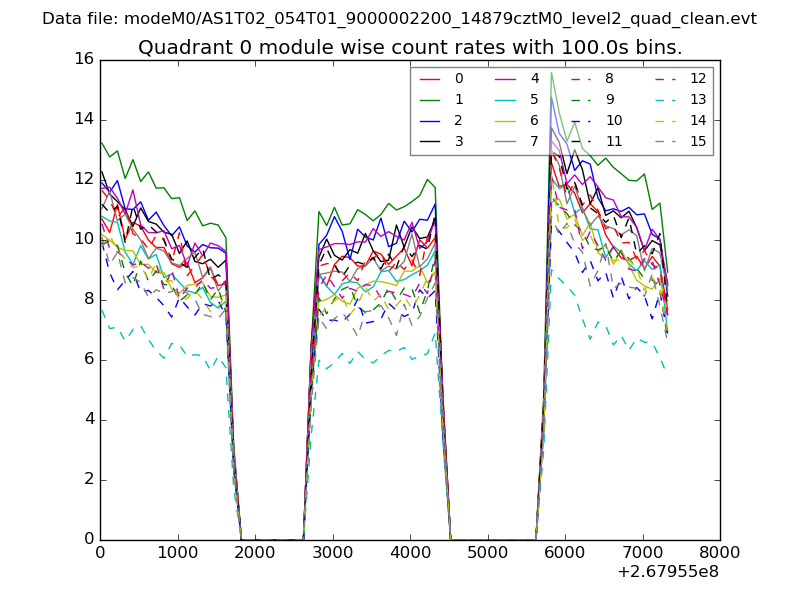 |
 |
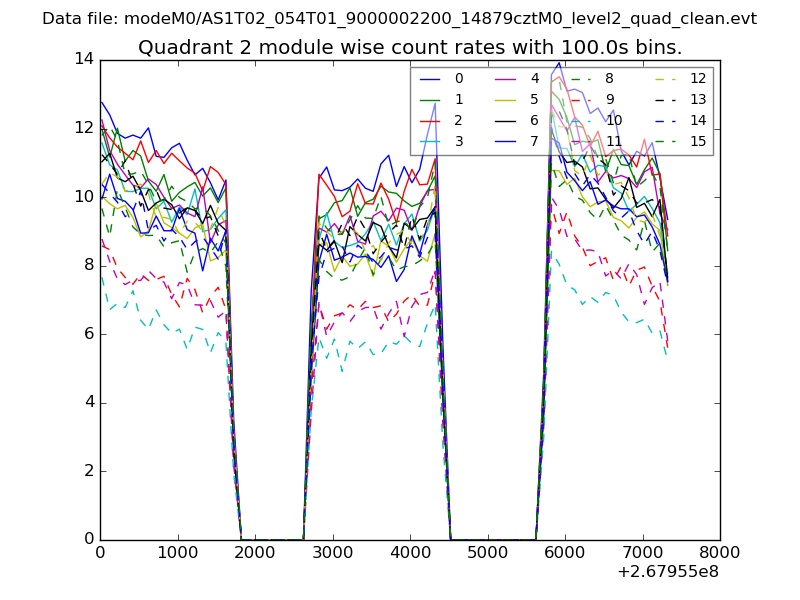
| Module-wise count rates for Quadrant B Data is divided into 100 sec bins |
 |
 |
| Module-wise count rates for Quadrant C Data is divided into 100 sec bins |
 |
 |
| Module-wise count rates for Quadrant D Data is divided into 100 sec bins |
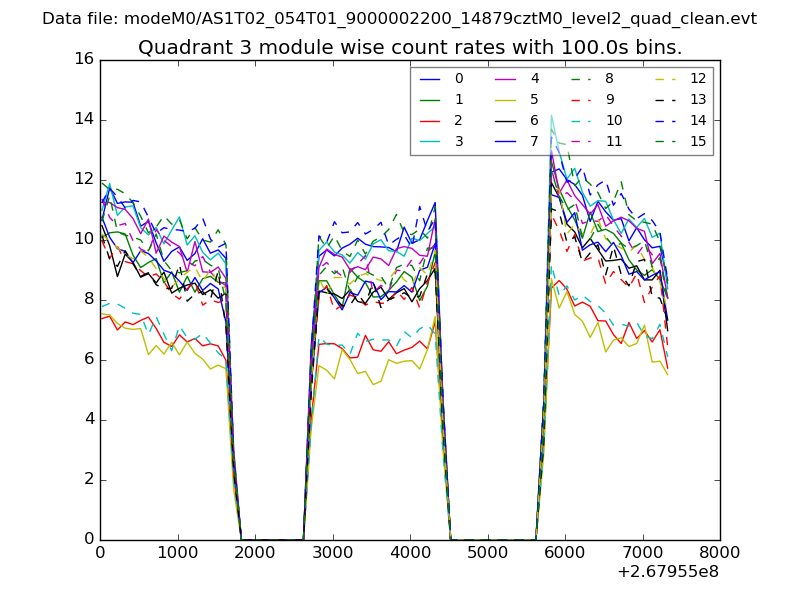 |
 |
| Parameter | Plot |
|---|---|
| CZT HV Monitor | 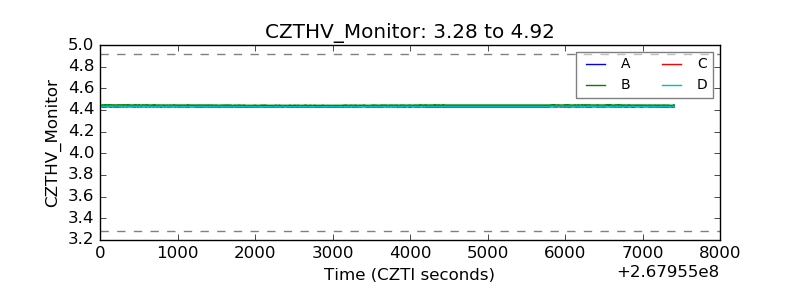 |
| D_VDD | 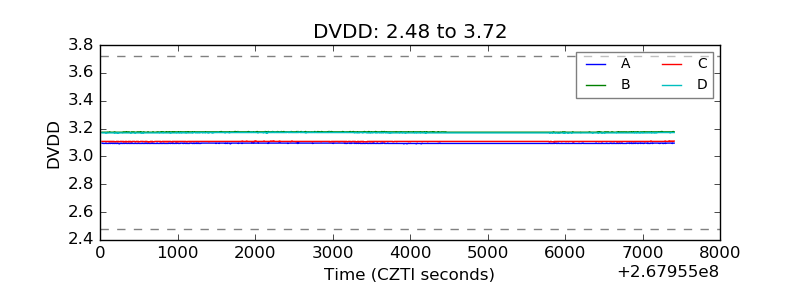 |
| Temperature 1 | 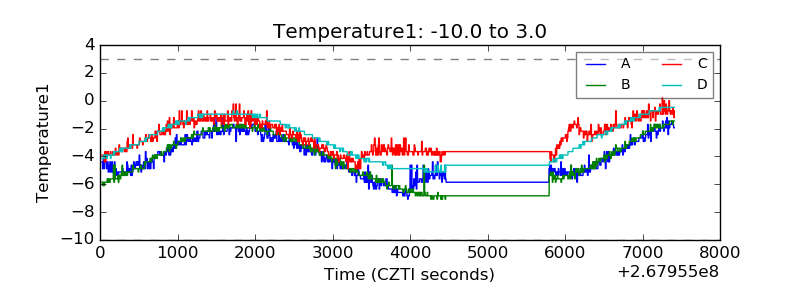 |
| Veto HV Monitor |  |
| Veto LLD |  |
| Alpha Counter |  |
| _CPM_Rate | 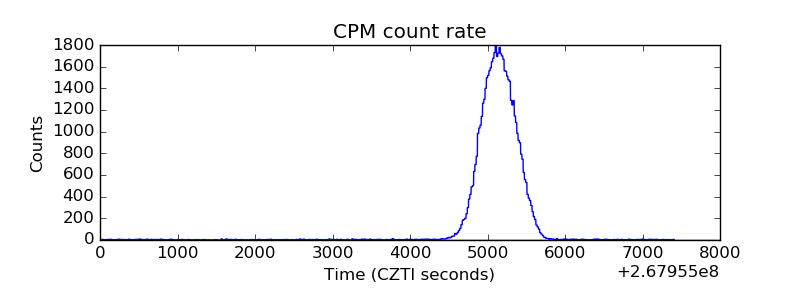 |
| CZT Counter | 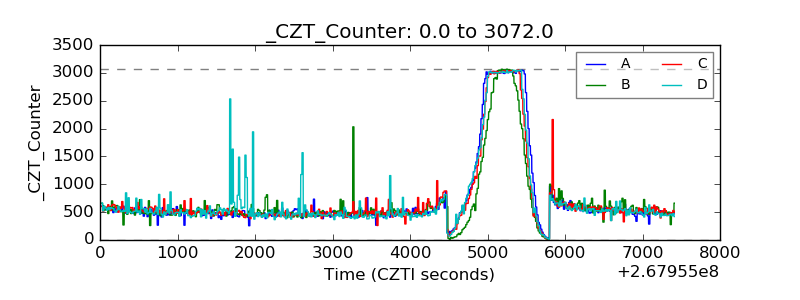 |
| +2.5 Volts monitor |  |
| +5 Volts monitor |  |
| _ROLL_ROT | 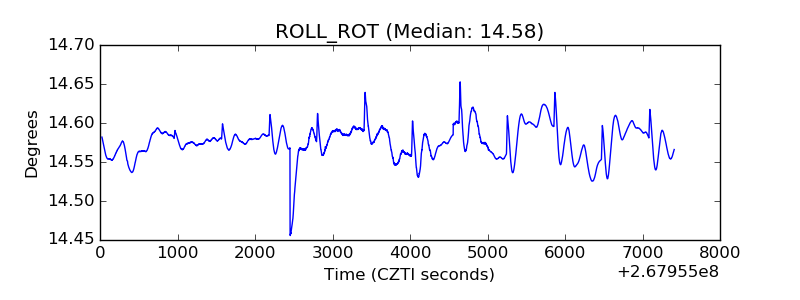 |
| _Roll_DEC | 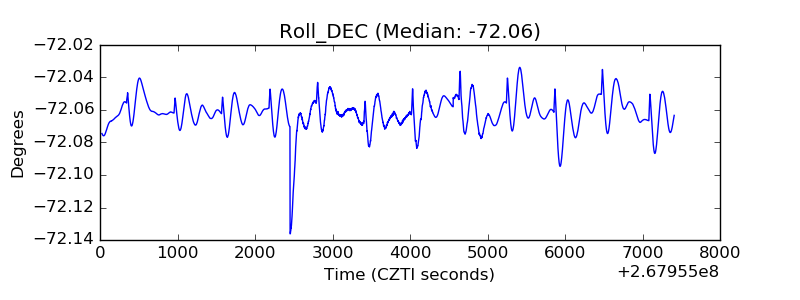 |
| _Roll_RA |  |
| Veto Counter | 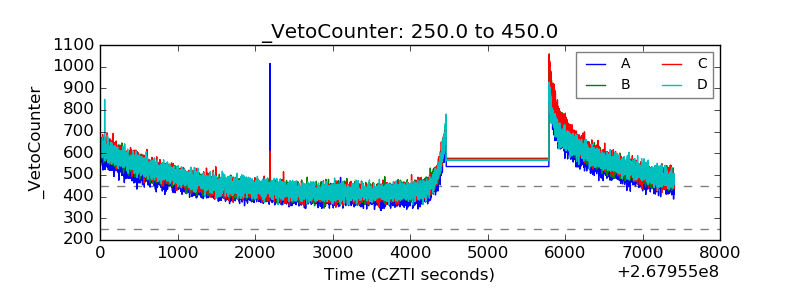 |