| Param | Original file | Final file |
|---|---|---|
| Filename | modeM0/AS1T02_054T01_9000002200_14880cztM0_level2.evt | modeM0/AS1T02_054T01_9000002200_14880cztM0_level2_quad_clean.evt |
| Size (bytes) | 447,160,320 | 108,861,120 |
| Size | 426.4 MB | 103.8 MB |
| Events in quadrant A | 3,187,882 | 725,024 |
| Events in quadrant B | 3,454,663 | 724,125 |
| Events in quadrant C | 3,137,509 | 718,347 |
| Events in quadrant D | 3,347,409 | 703,034 |
| Mode SS | |||
|---|---|---|---|
| Quadrant | BADHDUFLAG | Total packets | Discarded packets |
| A | 0 | 124 | 0 |
| B | 0 | 124 | 0 |
| C | 0 | 124 | 0 |
| D | 0 | 124 | 0 |
| Mode M9 | |||
|---|---|---|---|
| Quadrant | BADHDUFLAG | Total packets | Discarded packets |
| A | 0 | 13 | 0 |
| B | 0 | 13 | 0 |
| C | 0 | 13 | 0 |
| D | 0 | 13 | 0 |
| Mode M0 | |||
|---|---|---|---|
| Quadrant | BADHDUFLAG | Total packets | Discarded packets |
| A | 0 | 13076 | 2 |
| B | 0 | 13945 | 1 |
| C | 0 | 12921 | 1 |
| D | 0 | 13719 | 1 |
| Quadrant | Total seconds | Saturated seconds | Saturation percentage |
|---|---|---|---|
| A | 6109 | 81 | 1.325913% |
| B | 6109 | 92 | 1.505975% |
| C | 6109 | 32 | 0.523817% |
| D | 6109 | 87 | 1.424128% |
Noise dominated data is calculated using 1-second bins in cleaned event files. If a bin has >2000 counts, and if more than 50% of those come from <1% of pixels, then it is considered to be noise-dominated and hence unusable.
| Quadrant | # 1 sec bins | Bins with >0 counts | Bins with >2000 counts | High rate bins dominated by noise | Noise dominated (total time) | Noise dominated (detector-on time) | Marked lightcurve |
|---|---|---|---|---|---|---|---|
| A | 7425 | 6111 | 5 | 5 | 0.07% | 0.08% | 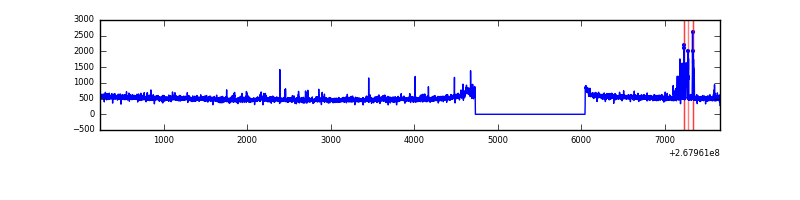 |
| B | 7425 | 6111 | 18 | 18 | 0.24% | 0.29% | 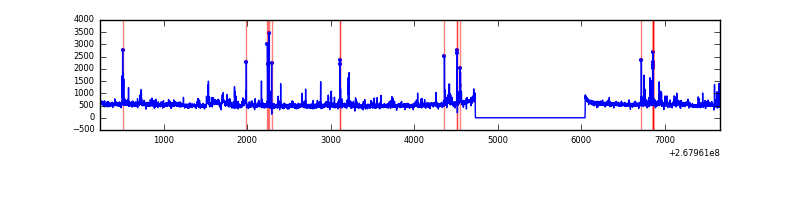 |
| C | 7425 | 6111 | 1 | 1 | 0.01% | 0.02% | 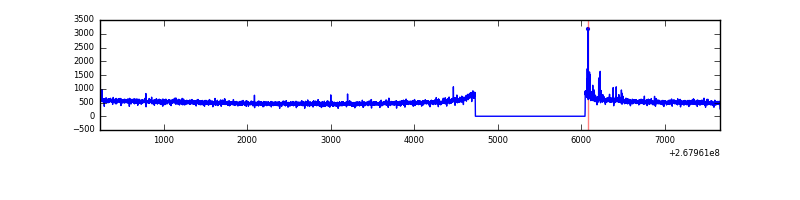 |
| D | 7425 | 6111 | 52 | 52 | 0.70% | 0.85% | 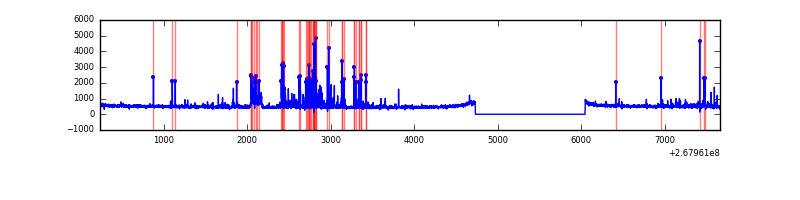 |
Top three noisy pixels from each quadrant. If the there are fewer than three noisy pixels in the level2.evt file, extra rows are filled as -1
| Pixel properties | Quadrant properties | ||||||
|---|---|---|---|---|---|---|---|
| Quadrant | DetID | PixID | Counts | Sigma | Mean | Median | Sigma |
| A | 15 | 31 | 77625 | 490.62 | 788 | 774 | 156.6 |
| A | 12 | 189 | 32289 | 201.19 | 788 | 774 | 156.6 |
| A | 15 | 239 | 29001 | 180.2 | 788 | 774 | 156.6 |
| B | 10 | 16 | 112746 | 786.99 | 772 | 753 | 142.3 |
| B | 3 | 64 | 105169 | 733.75 | 772 | 753 | 142.3 |
| B | 0 | 189 | 82338 | 573.31 | 772 | 753 | 142.3 |
| C | 3 | 233 | 156241 | 910.37 | 755 | 761 | 170.8 |
| C | 0 | 207 | 32396 | 185.23 | 755 | 761 | 170.8 |
| C | 13 | 61 | 5399 | 27.16 | 755 | 761 | 170.8 |
| D | 7 | 254 | 227978 | 1246.19 | 766 | 748 | 182.3 |
| D | 13 | 172 | 89655 | 487.59 | 766 | 748 | 182.3 |
| D | 7 | 38 | 45900 | 247.62 | 766 | 748 | 182.3 |
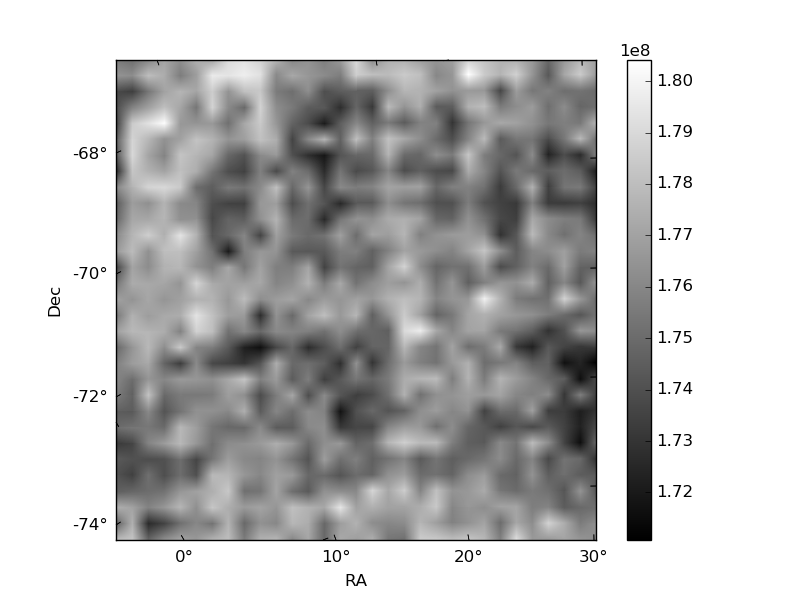
Histogram calculated using DETX and DETY for each event in the final _common_clean file
| Quadrant A |  |
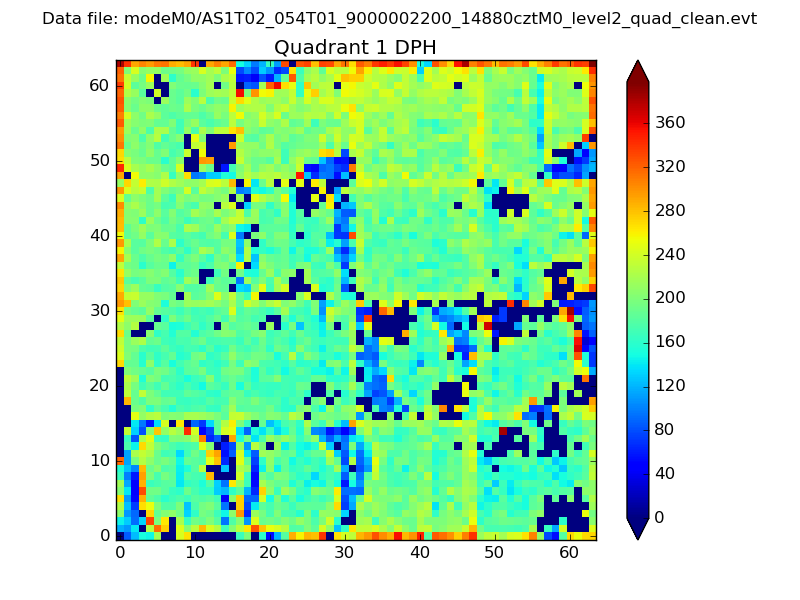 |
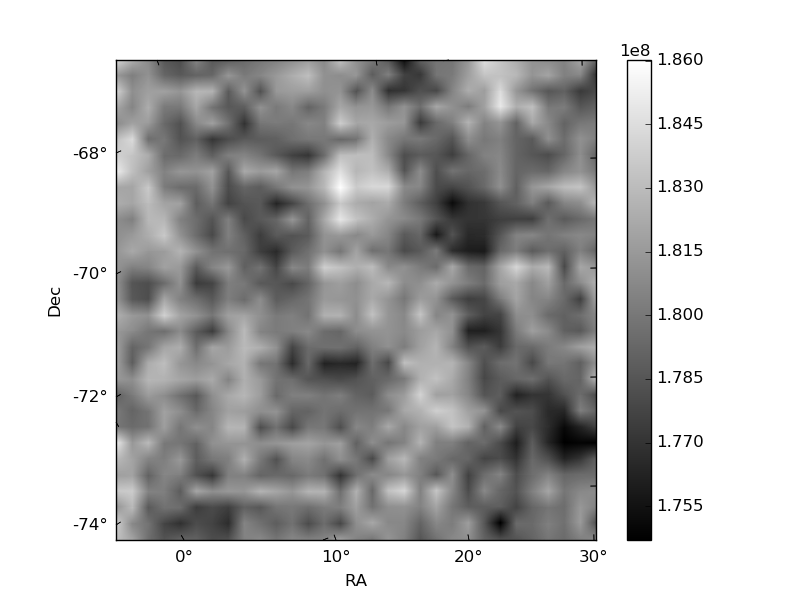
Quadrant B |
|---|---|---|---|
| Quadrant D |  |
 |
Quadrant C |
| Plot type | Count rate plots | Images |
|---|---|---|
| Comparison with Poisson distribution Blue bars denote a histogram of data divided into 1 sec bins. Red curve is a Poisson curve with rate = median count rate of data. |
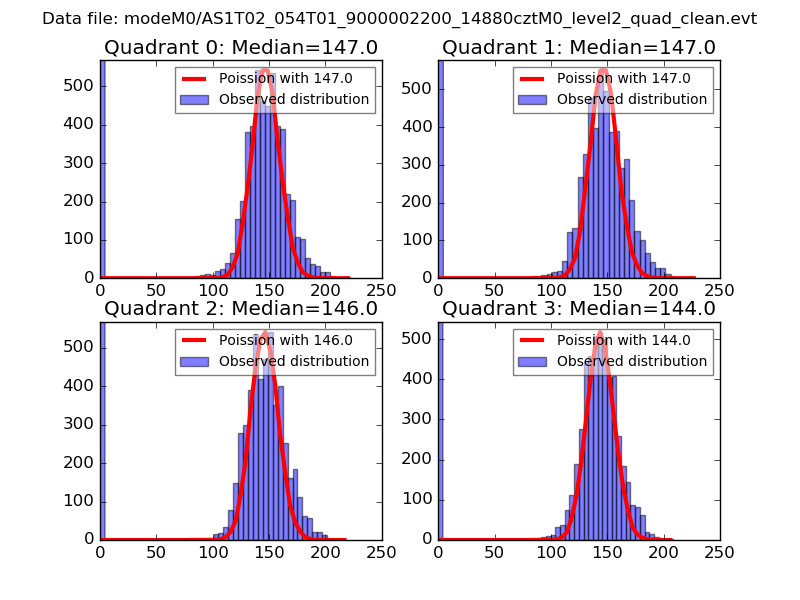 |
 |
| Quadrant-wise count rates Data is divided into 100 sec bins |
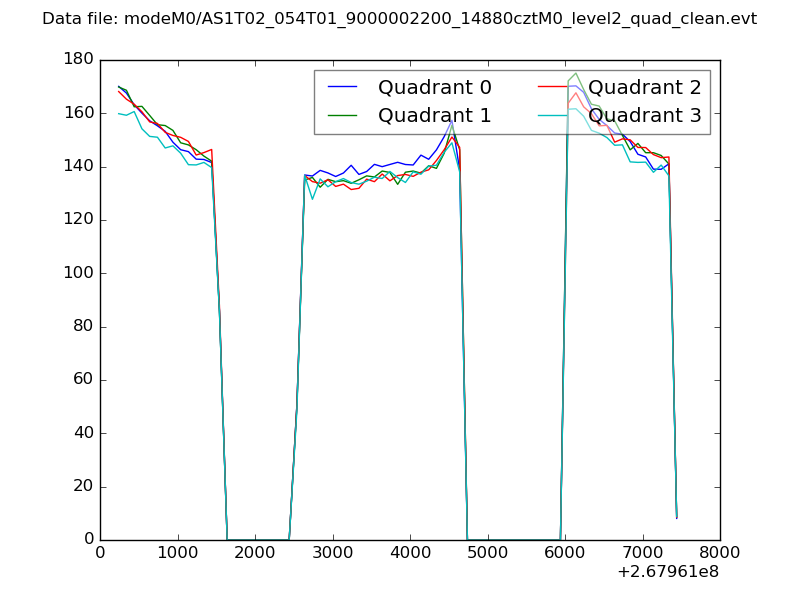 |
|
| Module-wise count rates for Quadrant A Data is divided into 100 sec bins |
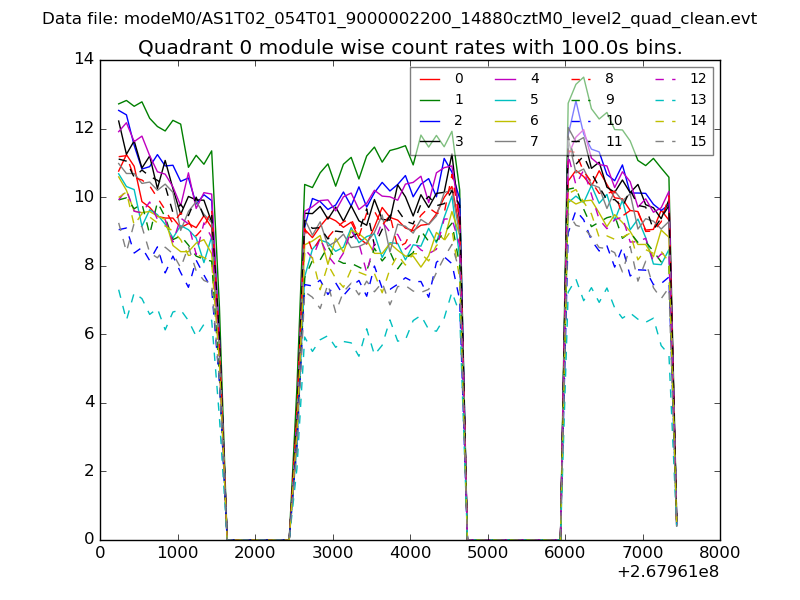 |
 |
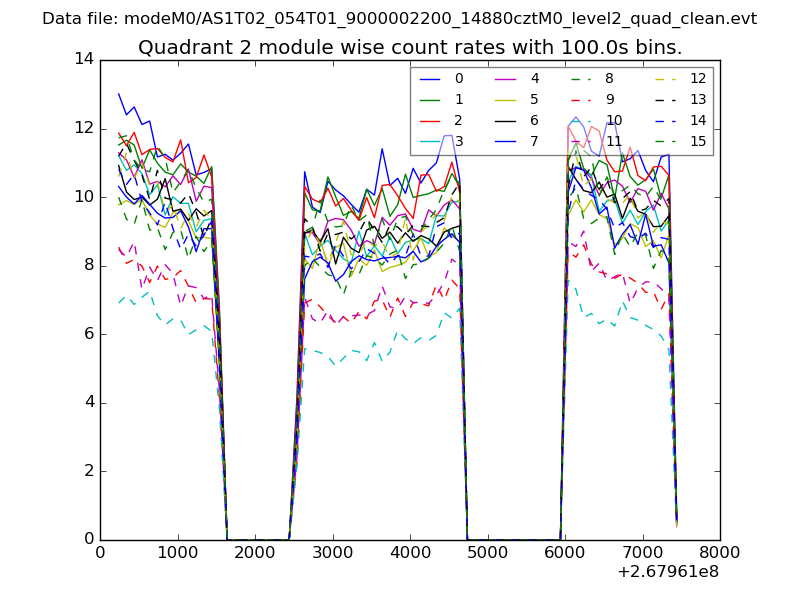
| Module-wise count rates for Quadrant B Data is divided into 100 sec bins |
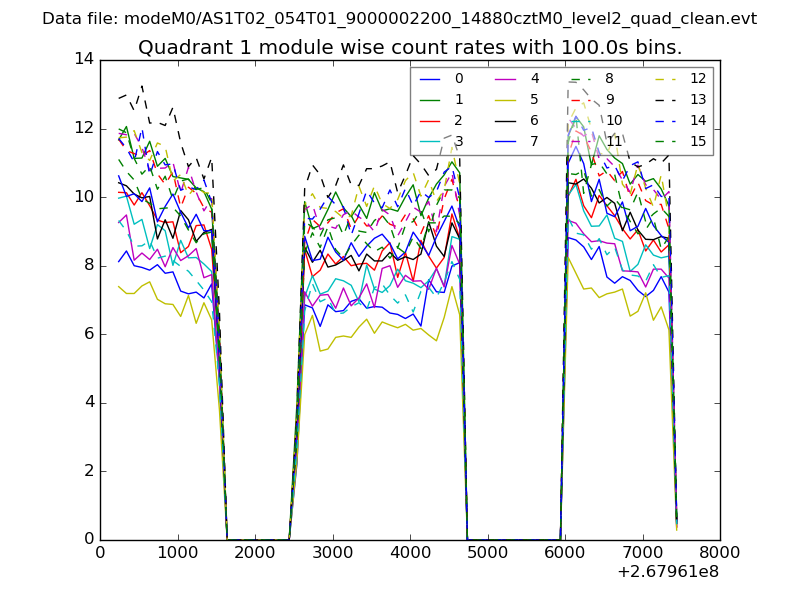 |
 |
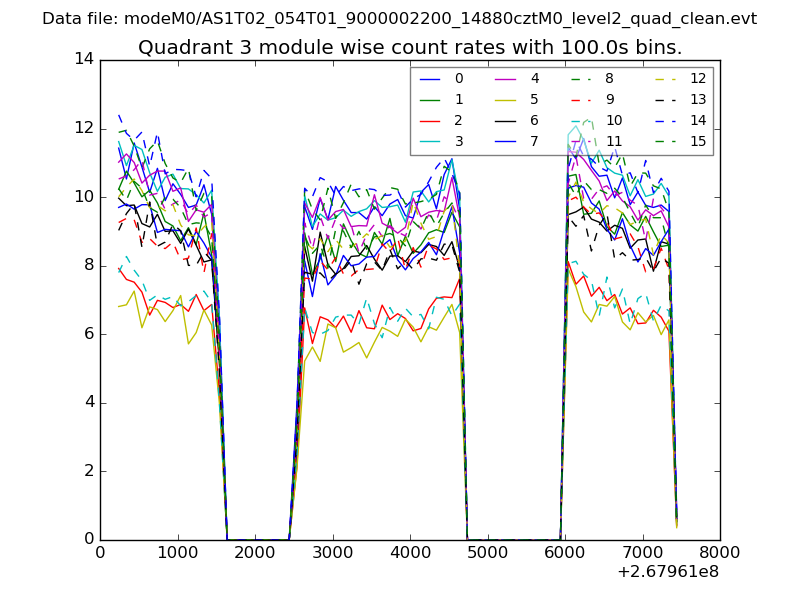
| Module-wise count rates for Quadrant C Data is divided into 100 sec bins |
 |
 |
| Module-wise count rates for Quadrant D Data is divided into 100 sec bins |
 |
 |
| Parameter | Plot |
|---|---|
| CZT HV Monitor | 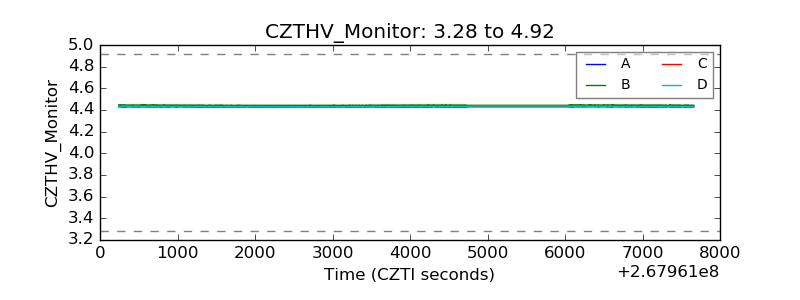 |
| D_VDD | 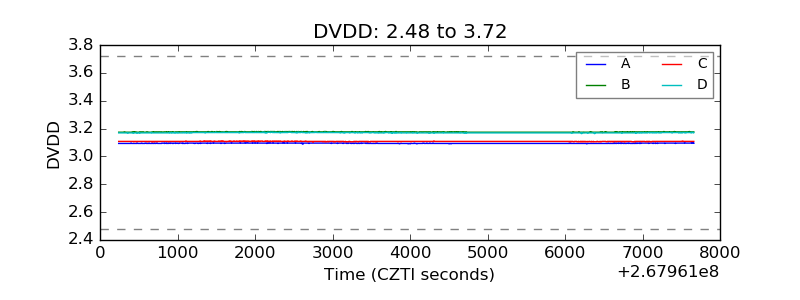 |
| Temperature 1 | 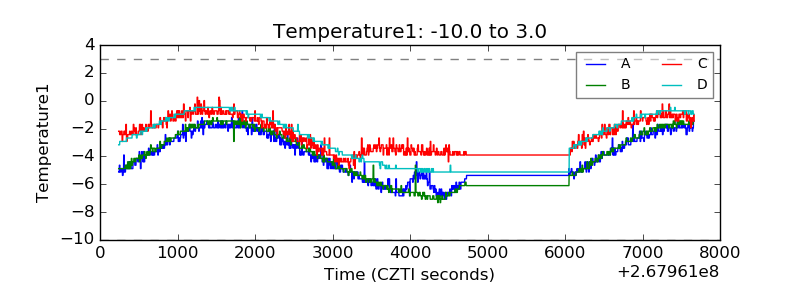 |
| Veto HV Monitor | 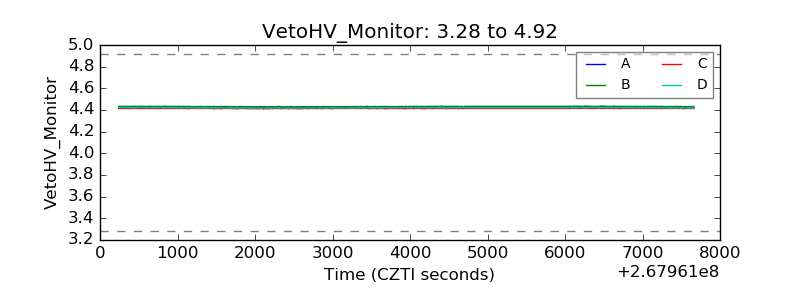 |
| Veto LLD | 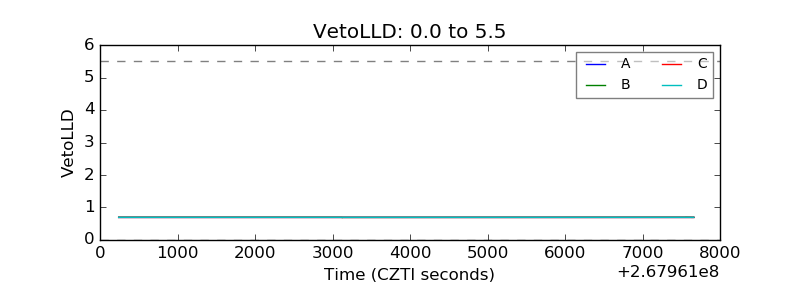 |
| Alpha Counter | 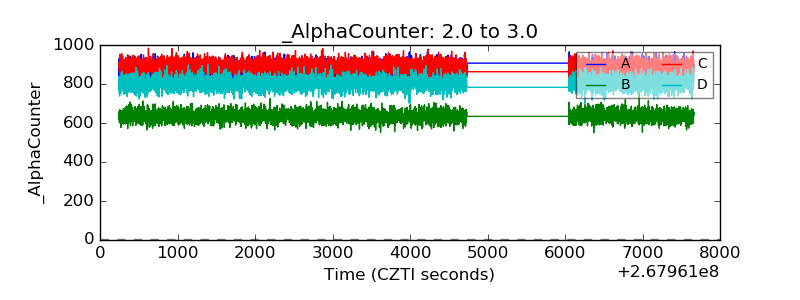 |
| _CPM_Rate | 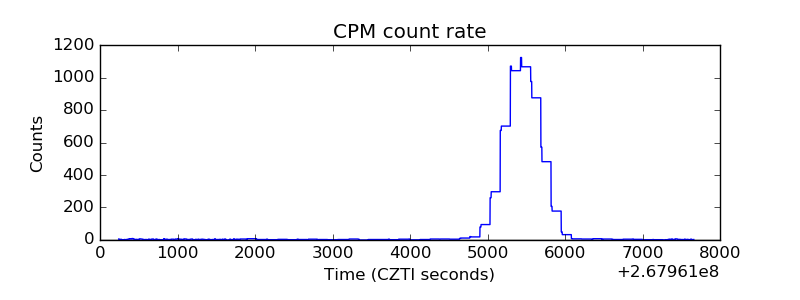 |
| CZT Counter |  |
| +2.5 Volts monitor |  |
| +5 Volts monitor |  |
| _ROLL_ROT | 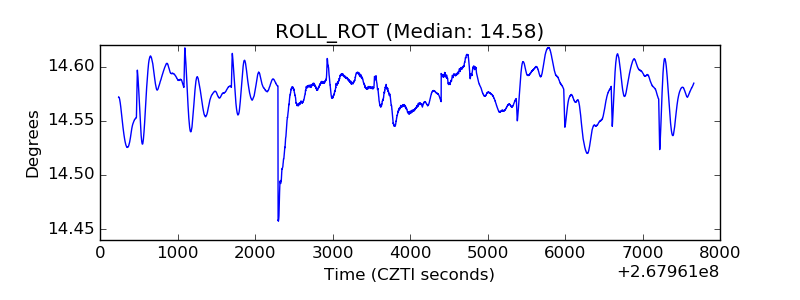 |
| _Roll_DEC | 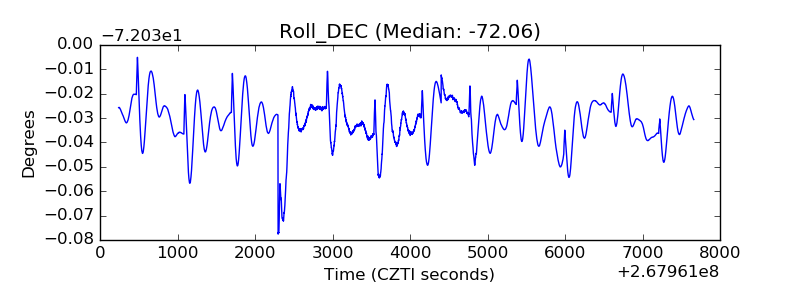 |
| _Roll_RA | 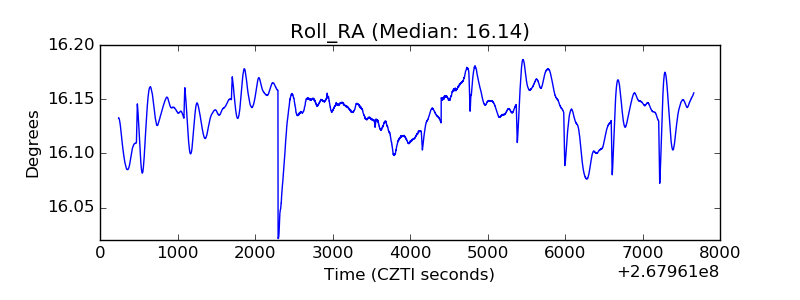 |
| Veto Counter | 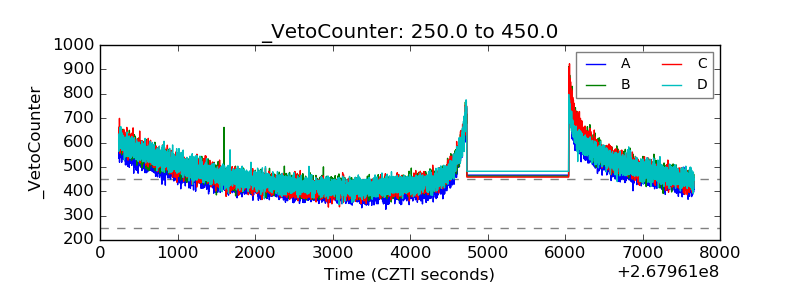 |