| Param | Original file | Final file |
|---|---|---|
| Filename | modeM0/AS1T02_054T01_9000002200_14881cztM0_level2.evt | modeM0/AS1T02_054T01_9000002200_14881cztM0_level2_quad_clean.evt |
| Size (bytes) | 488,309,760 | 94,800,960 |
| Size | 465.7 MB | 90.4 MB |
| Events in quadrant A | 3,172,730 | 630,703 |
| Events in quadrant B | 4,844,880 | 581,480 |
| Events in quadrant C | 2,989,477 | 623,568 |
| Events in quadrant D | 3,367,942 | 610,051 |
| Mode SS | |||
|---|---|---|---|
| Quadrant | BADHDUFLAG | Total packets | Discarded packets |
| A | 0 | 122 | 0 |
| B | 0 | 122 | 0 |
| C | 0 | 122 | 0 |
| D | 0 | 122 | 0 |
| Mode M9 | |||
|---|---|---|---|
| Quadrant | BADHDUFLAG | Total packets | Discarded packets |
| A | 0 | 12 | 0 |
| B | 0 | 12 | 0 |
| C | 0 | 12 | 0 |
| D | 0 | 12 | 0 |
| Mode M0 | |||
|---|---|---|---|
| Quadrant | BADHDUFLAG | Total packets | Discarded packets |
| A | 0 | 13032 | 2 |
| B | 0 | 18323 | 1 |
| C | 0 | 12578 | 1 |
| D | 0 | 13954 | 1 |
| Quadrant | Total seconds | Saturated seconds | Saturation percentage |
|---|---|---|---|
| A | 6092 | 68 | 1.116218% |
| B | 6092 | 772 | 12.672357% |
| C | 6092 | 36 | 0.590939% |
| D | 6092 | 143 | 2.347341% |
Noise dominated data is calculated using 1-second bins in cleaned event files. If a bin has >2000 counts, and if more than 50% of those come from <1% of pixels, then it is considered to be noise-dominated and hence unusable.
| Quadrant | # 1 sec bins | Bins with >0 counts | Bins with >2000 counts | High rate bins dominated by noise | Noise dominated (total time) | Noise dominated (detector-on time) | Marked lightcurve |
|---|---|---|---|---|---|---|---|
| A | 7293 | 6094 | 5 | 5 | 0.07% | 0.08% | 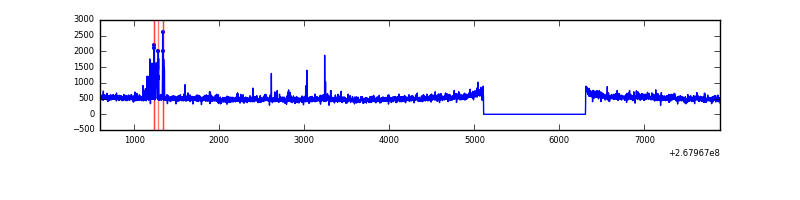 |
| B | 7293 | 6094 | 529 | 529 | 7.25% | 8.68% | 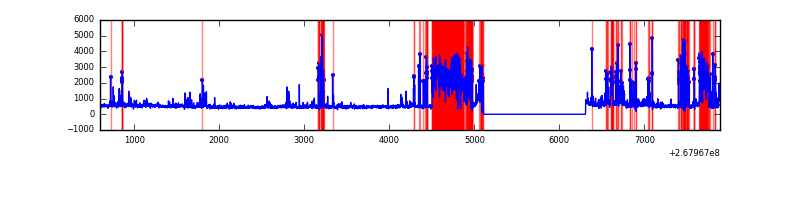 |
| C | 7293 | 6094 | 0 | 0 | 0.00% | 0.00% | 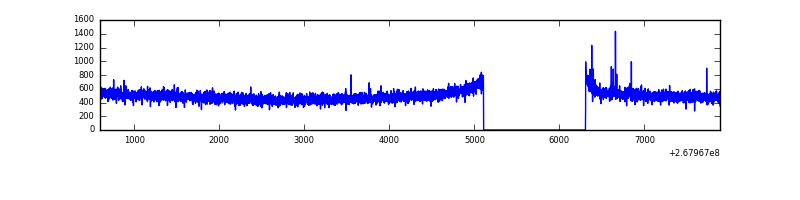 |
| D | 7293 | 6094 | 70 | 70 | 0.96% | 1.15% | 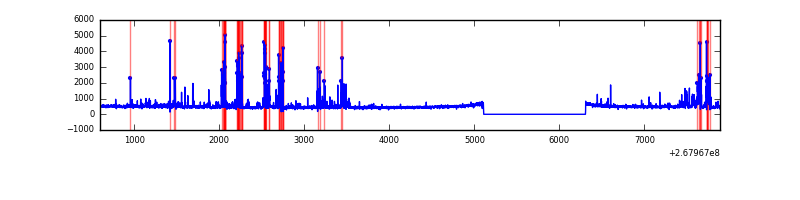 |
Top three noisy pixels from each quadrant. If the there are fewer than three noisy pixels in the level2.evt file, extra rows are filled as -1
| Pixel properties | Quadrant properties | ||||||
|---|---|---|---|---|---|---|---|
| Quadrant | DetID | PixID | Counts | Sigma | Mean | Median | Sigma |
| A | 15 | 239 | 128859 | 845.73 | 754 | 739 | 151.5 |
| A | 15 | 31 | 77753 | 508.38 | 754 | 739 | 151.5 |
| A | 12 | 189 | 47078 | 305.89 | 754 | 739 | 151.5 |
| B | 3 | 64 | 1341228 | 10348.54 | 696 | 680 | 129.5 |
| B | 10 | 16 | 512671 | 3952.38 | 696 | 680 | 129.5 |
| B | 0 | 189 | 121866 | 935.51 | 696 | 680 | 129.5 |
| C | 3 | 233 | 155046 | 934.31 | 723 | 725 | 165.2 |
| C | 0 | 207 | 12572 | 71.73 | 723 | 725 | 165.2 |
| C | 13 | 61 | 5225 | 27.24 | 723 | 725 | 165.2 |
| D | 7 | 254 | 456836 | 2655.74 | 724 | 705 | 171.8 |
| D | 13 | 104 | 83850 | 484.1 | 724 | 705 | 171.8 |
| D | 2 | 120 | 30049 | 170.85 | 724 | 705 | 171.8 |
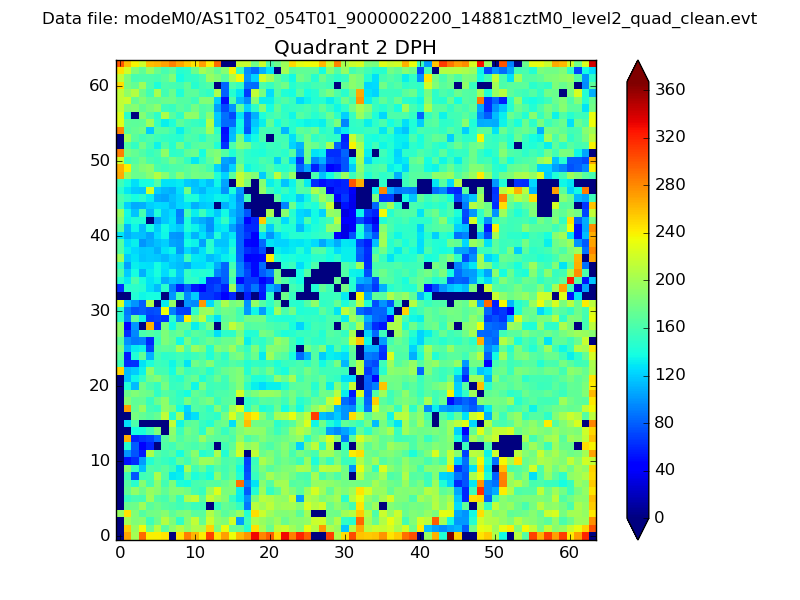
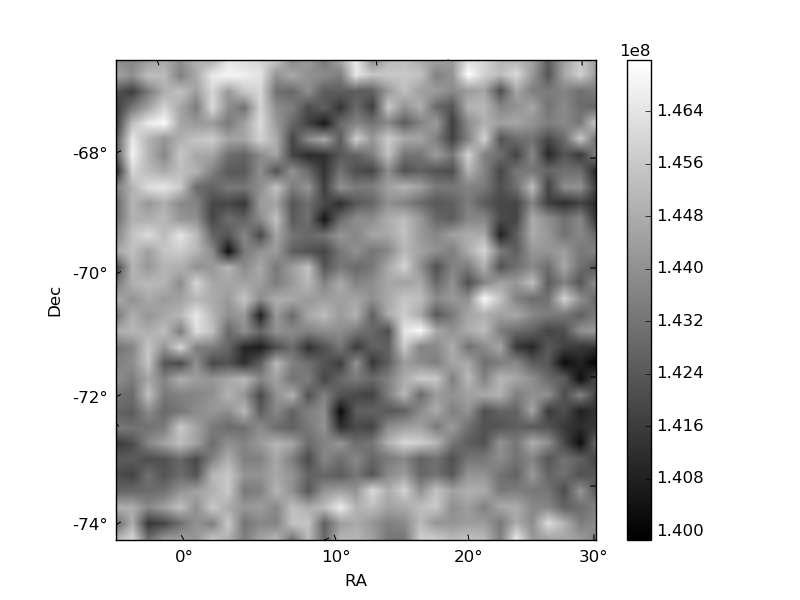
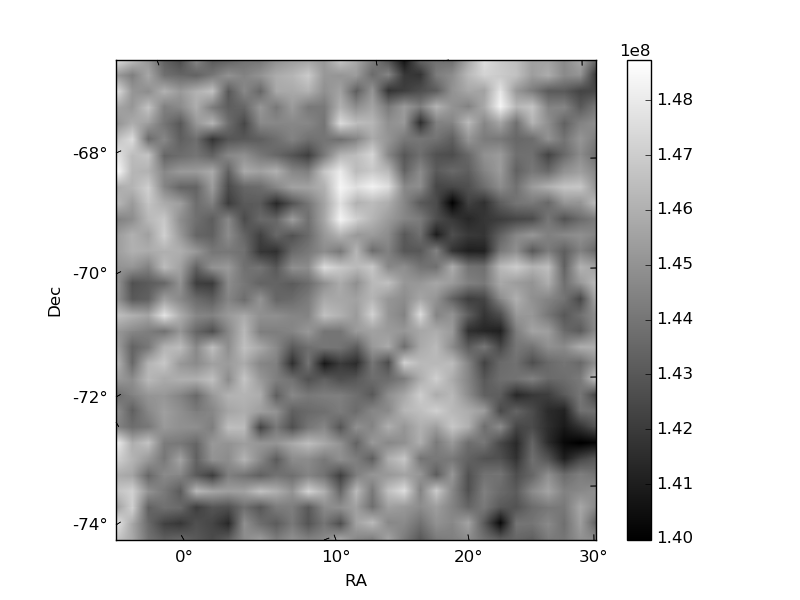
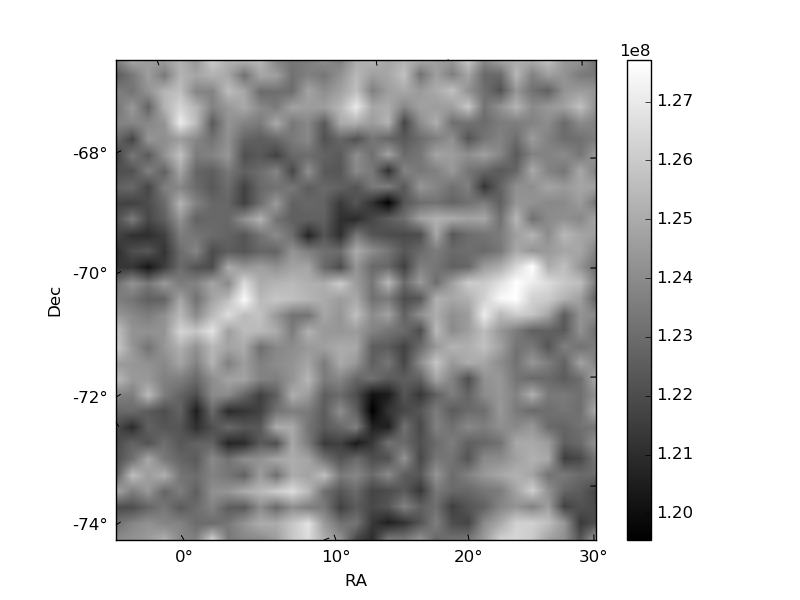
Histogram calculated using DETX and DETY for each event in the final _common_clean file
| Quadrant A |  |
 |
Quadrant B |
|---|---|---|---|
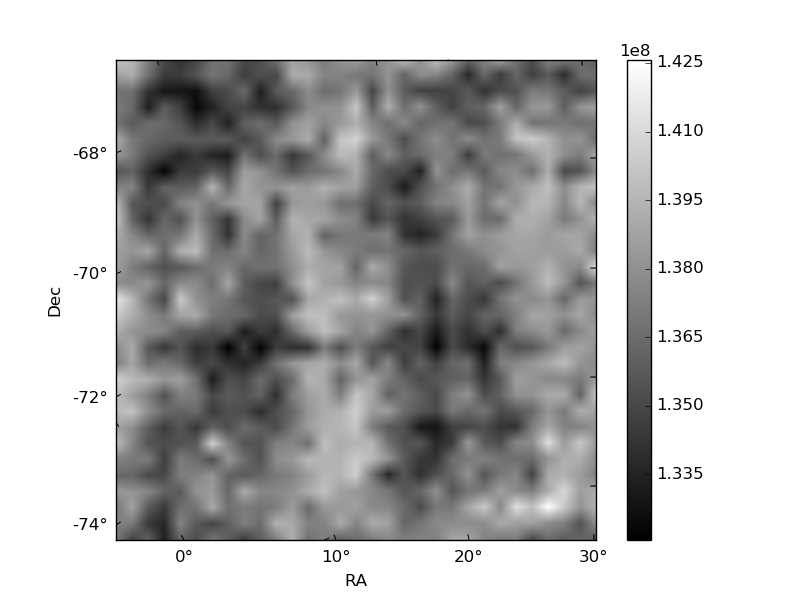
| Quadrant D | 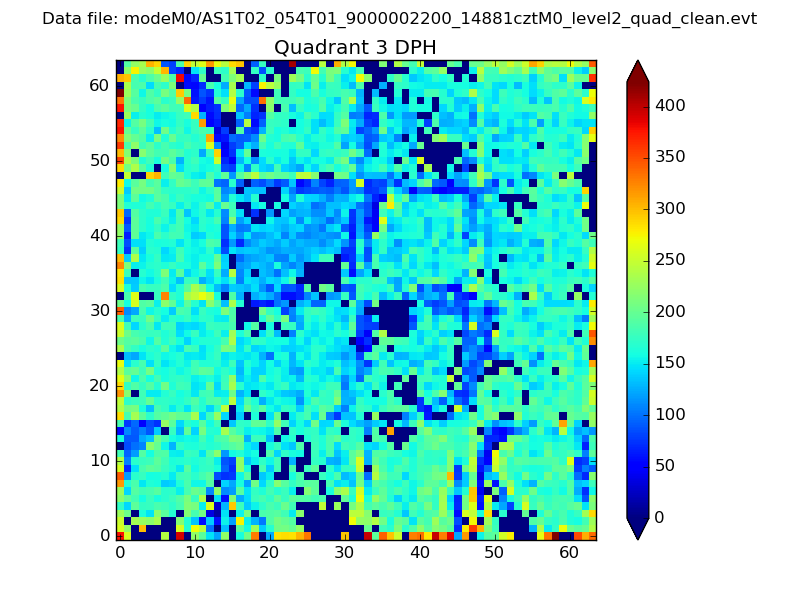 |
 |
Quadrant C |
| Plot type | Count rate plots | Images |
|---|---|---|
| Comparison with Poisson distribution Blue bars denote a histogram of data divided into 1 sec bins. Red curve is a Poisson curve with rate = median count rate of data. |
 |
 |
| Quadrant-wise count rates Data is divided into 100 sec bins |
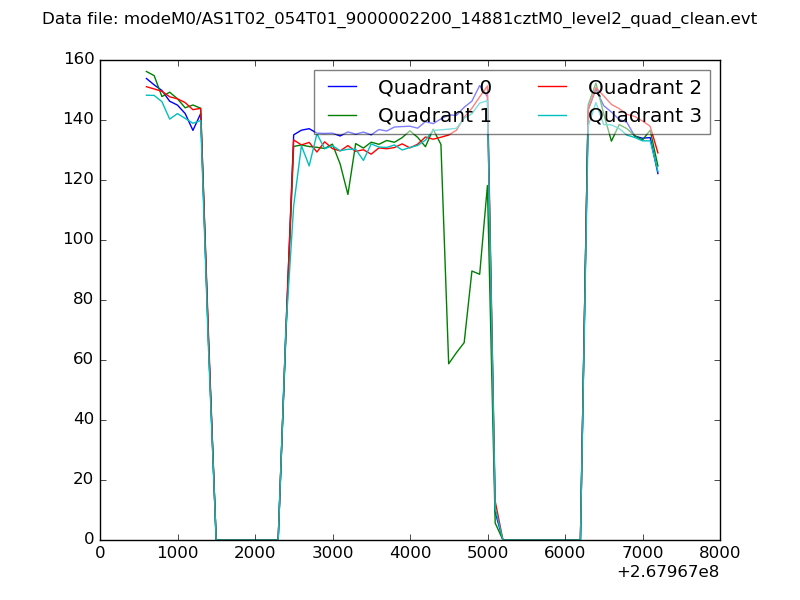 |
|
| Module-wise count rates for Quadrant A Data is divided into 100 sec bins |
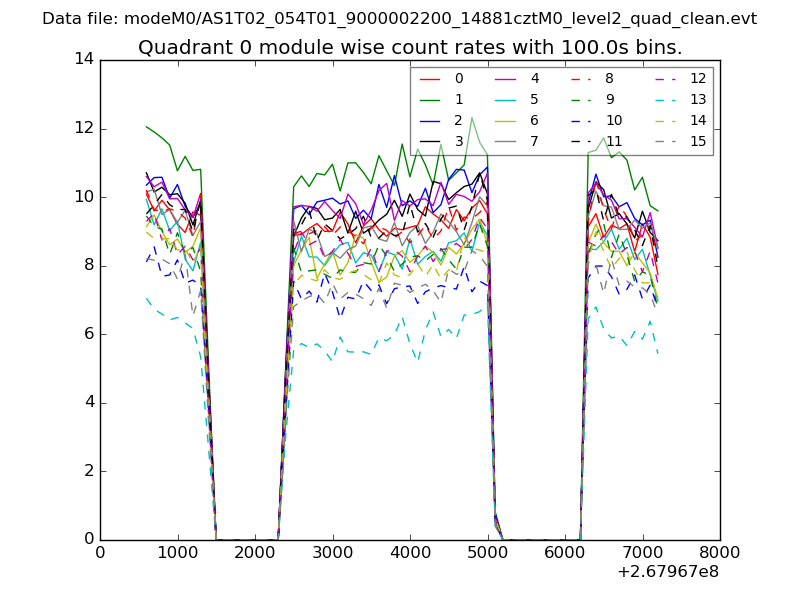 |
 |
| Module-wise count rates for Quadrant B Data is divided into 100 sec bins |
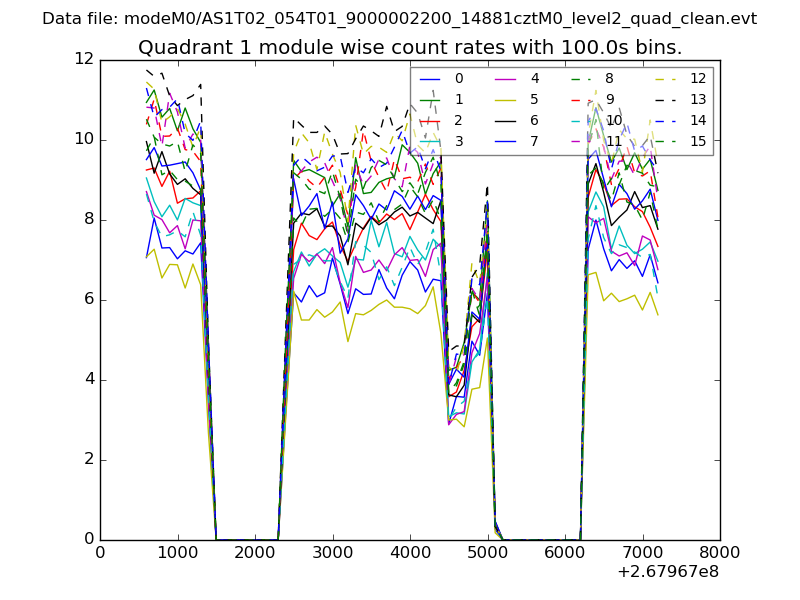 |
 |
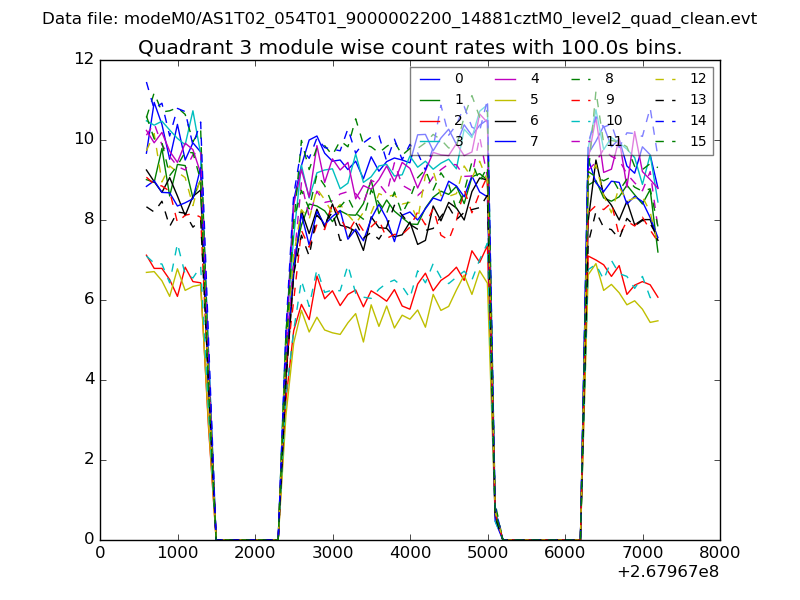
| Module-wise count rates for Quadrant C Data is divided into 100 sec bins |
 |
 |
| Module-wise count rates for Quadrant D Data is divided into 100 sec bins |
 |
 |
| Parameter | Plot |
|---|---|
| CZT HV Monitor |  |
| D_VDD | 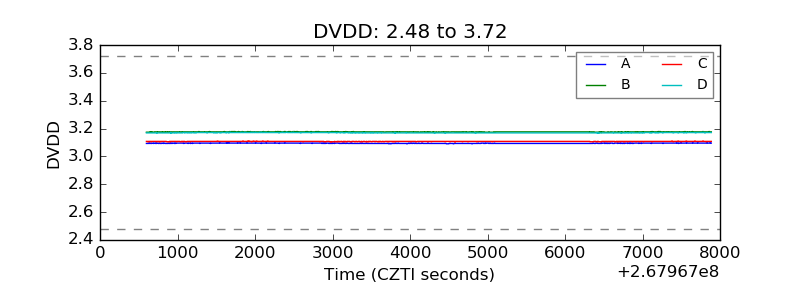 |
| Temperature 1 | 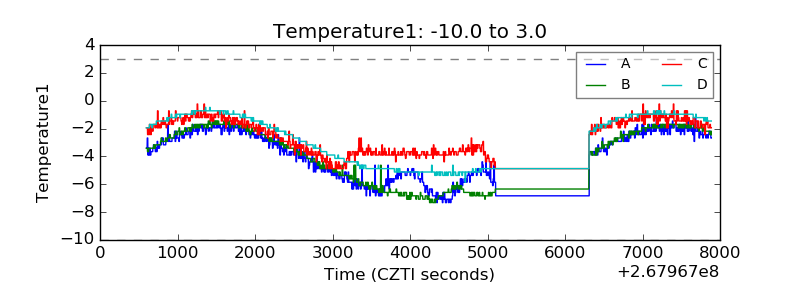 |
| Veto HV Monitor | 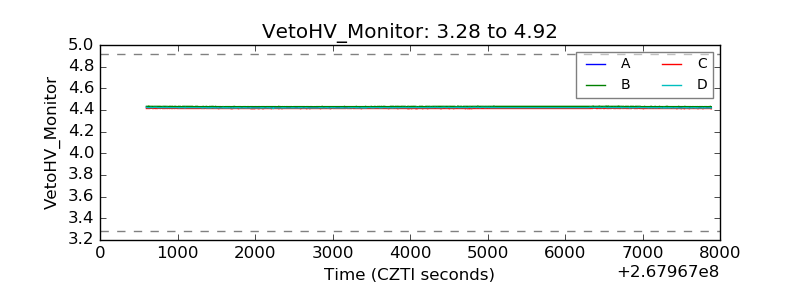 |
| Veto LLD | 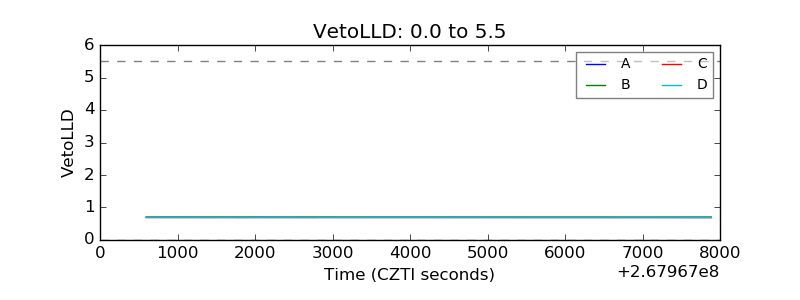 |
| Alpha Counter | 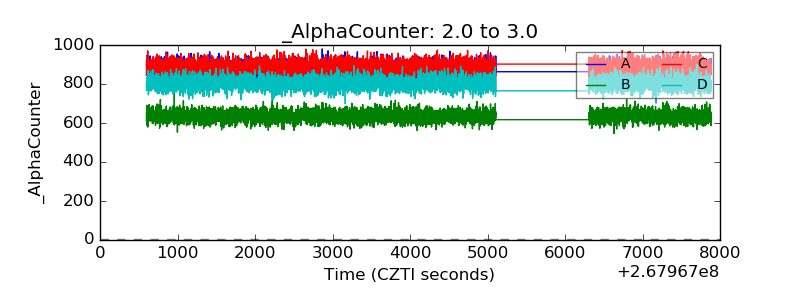 |
| _CPM_Rate | 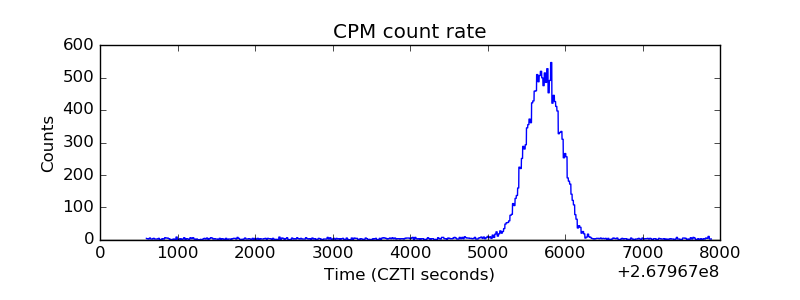 |
| CZT Counter | 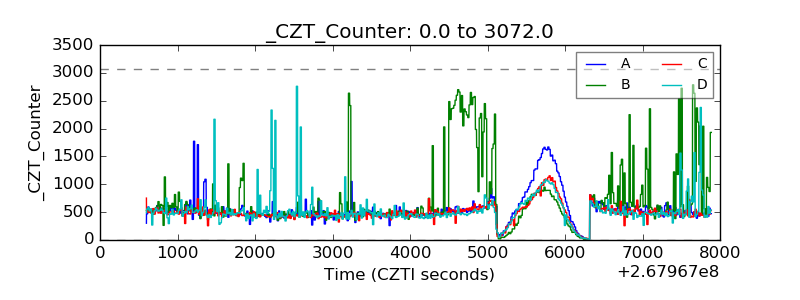 |
| +2.5 Volts monitor |  |
| +5 Volts monitor |  |
| _ROLL_ROT | 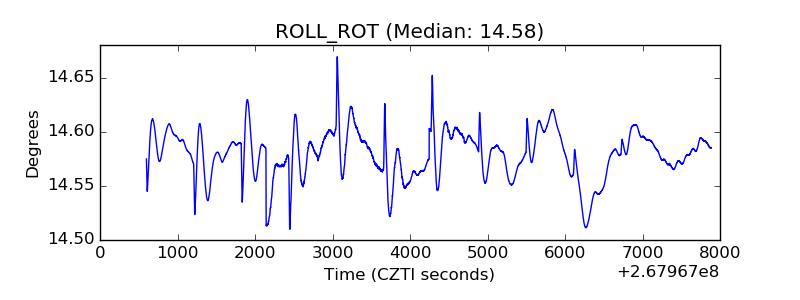 |
| _Roll_DEC | 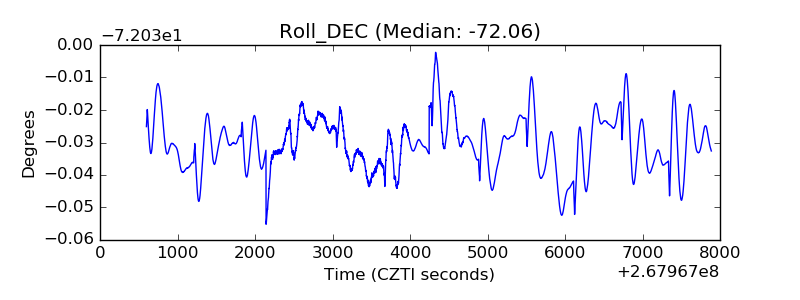 |
| _Roll_RA | 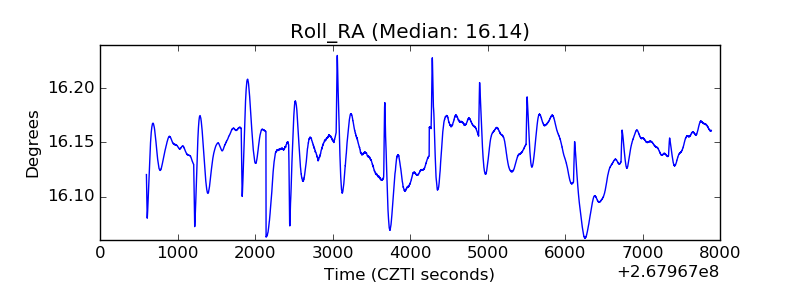 |
| Veto Counter | 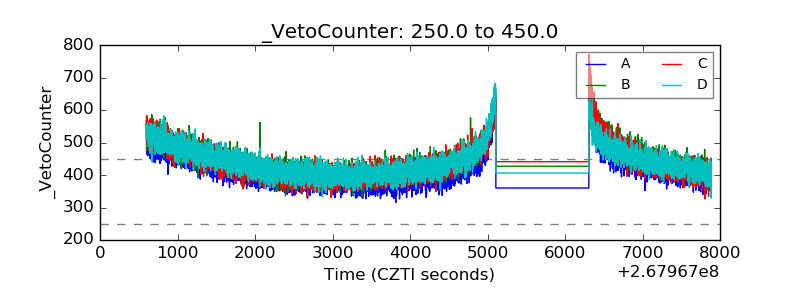 |