| Param | Original file | Final file |
|---|---|---|
| Filename | modeM0/AS1T02_054T01_9000002200_14882cztM0_level2.evt | modeM0/AS1T02_054T01_9000002200_14882cztM0_level2_quad_clean.evt |
| Size (bytes) | 564,200,640 | 88,580,160 |
| Size | 538.1 MB | 84.5 MB |
| Events in quadrant A | 3,115,685 | 582,216 |
| Events in quadrant B | 4,866,522 | 545,625 |
| Events in quadrant C | 3,025,791 | 578,512 |
| Events in quadrant D | 5,657,605 | 542,225 |
| Mode SS | |||
|---|---|---|---|
| Quadrant | BADHDUFLAG | Total packets | Discarded packets |
| A | 0 | 126 | 0 |
| B | 0 | 126 | 0 |
| C | 0 | 126 | 0 |
| D | 0 | 126 | 0 |
| Mode M9 | |||
|---|---|---|---|
| Quadrant | BADHDUFLAG | Total packets | Discarded packets |
| A | 0 | 9 | 0 |
| B | 0 | 9 | 0 |
| C | 0 | 9 | 0 |
| D | 0 | 9 | 0 |
| Mode M0 | |||
|---|---|---|---|
| Quadrant | BADHDUFLAG | Total packets | Discarded packets |
| A | 0 | 13083 | 0 |
| B | 0 | 18464 | 0 |
| C | 0 | 12788 | 0 |
| D | 0 | 20934 | 0 |
| Quadrant | Total seconds | Saturated seconds | Saturation percentage |
|---|---|---|---|
| A | 6212 | 88 | 1.416613% |
| B | 6212 | 670 | 10.785576% |
| C | 6212 | 60 | 0.965873% |
| D | 6212 | 936 | 15.067611% |
Noise dominated data is calculated using 1-second bins in cleaned event files. If a bin has >2000 counts, and if more than 50% of those come from <1% of pixels, then it is considered to be noise-dominated and hence unusable.
| Quadrant | # 1 sec bins | Bins with >0 counts | Bins with >2000 counts | High rate bins dominated by noise | Noise dominated (total time) | Noise dominated (detector-on time) | Marked lightcurve |
|---|---|---|---|---|---|---|---|
| A | 7082 | 6213 | 1 | 1 | 0.01% | 0.02% | 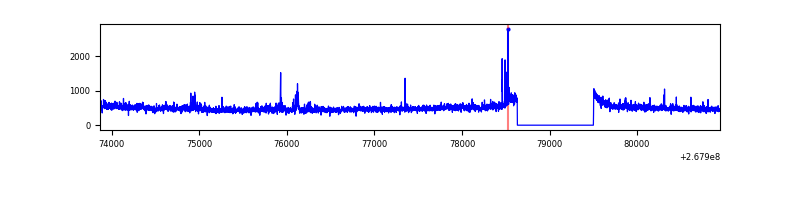 |
| B | 7082 | 6212 | 384 | 384 | 5.42% | 6.18% | 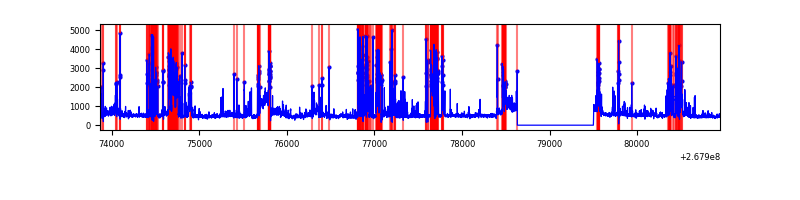 |
| C | 7082 | 6213 | 1 | 1 | 0.01% | 0.02% | 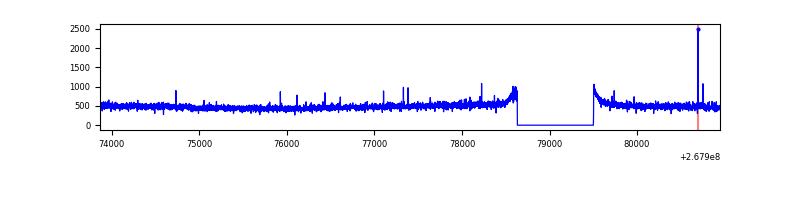 |
| D | 7082 | 6213 | 914 | 914 | 12.91% | 14.71% | 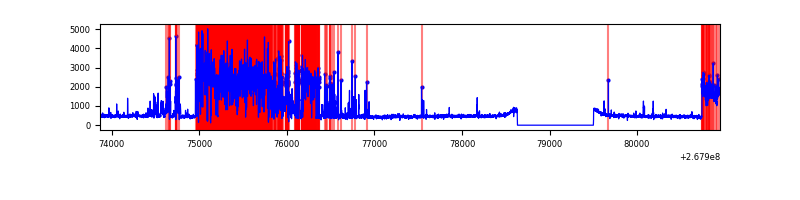 |
Top three noisy pixels from each quadrant. If the there are fewer than three noisy pixels in the level2.evt file, extra rows are filled as -1
| Pixel properties | Quadrant properties | ||||||
|---|---|---|---|---|---|---|---|
| Quadrant | DetID | PixID | Counts | Sigma | Mean | Median | Sigma |
| A | 15 | 239 | 135649 | 905.92 | 745 | 731 | 148.9 |
| A | 12 | 189 | 50143 | 331.78 | 745 | 731 | 148.9 |
| A | 14 | 237 | 22971 | 149.33 | 745 | 731 | 148.9 |
| B | 10 | 16 | 1622046 | 12202.16 | 702 | 684 | 132.9 |
| B | 3 | 64 | 316596 | 2377.51 | 702 | 684 | 132.9 |
| B | 0 | 189 | 93405 | 697.81 | 702 | 684 | 132.9 |
| C | 3 | 233 | 192483 | 1168.25 | 719 | 721 | 164.1 |
| C | 0 | 207 | 25087 | 148.44 | 719 | 721 | 164.1 |
| C | 13 | 61 | 5331 | 28.08 | 719 | 721 | 164.1 |
| D | 7 | 254 | 2962094 | 18042.78 | 691 | 674 | 164.1 |
| D | 2 | 234 | 28005 | 166.52 | 691 | 674 | 164.1 |
| D | 7 | 38 | 15812 | 92.23 | 691 | 674 | 164.1 |
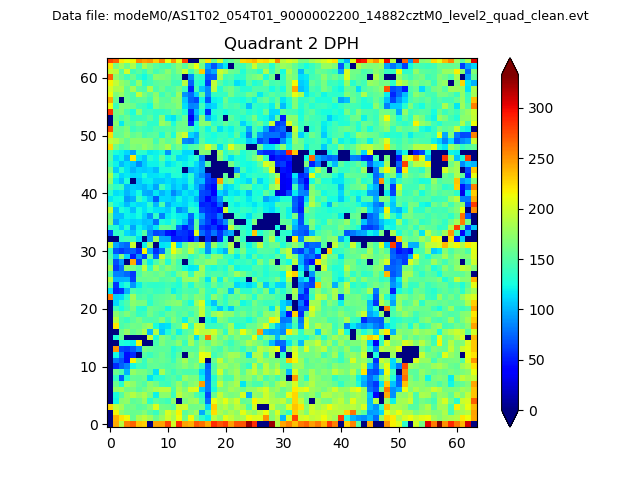
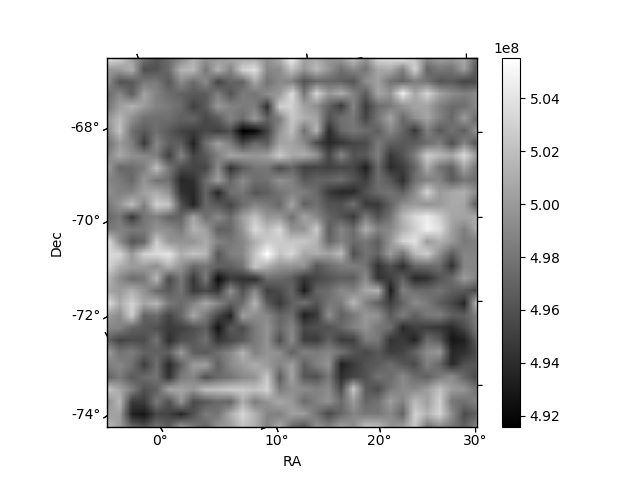
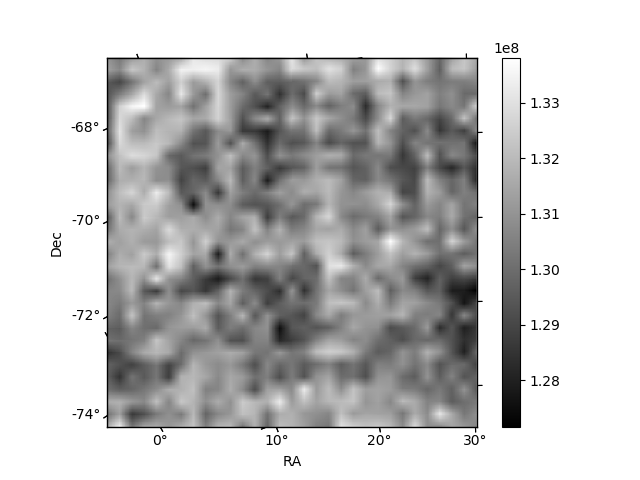
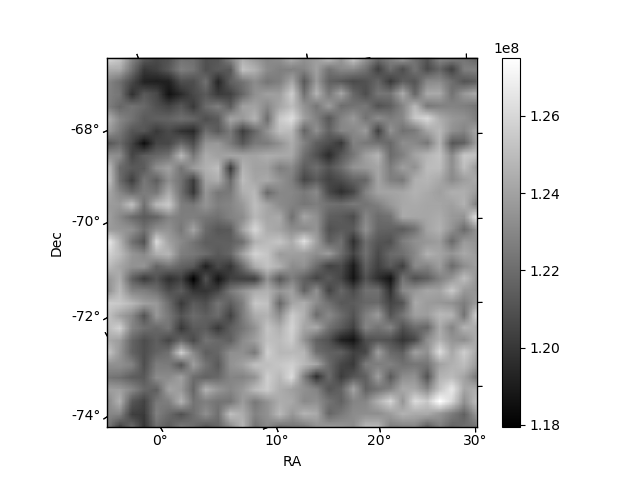
Histogram calculated using DETX and DETY for each event in the final _common_clean file
| Quadrant A | 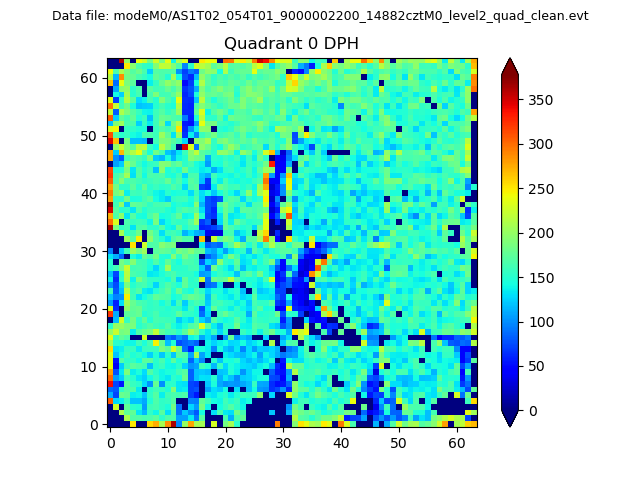 |
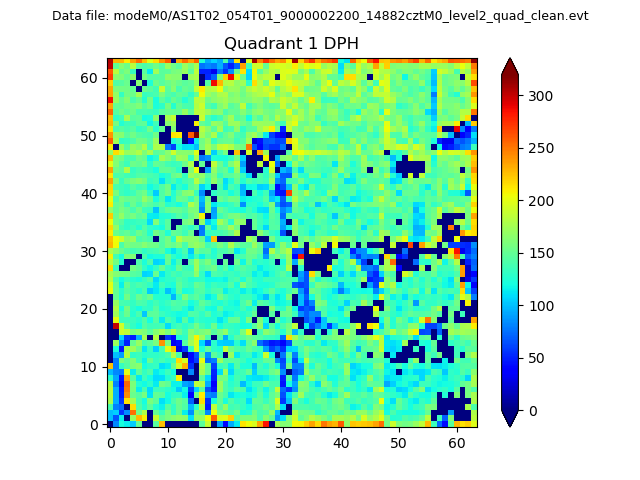 |
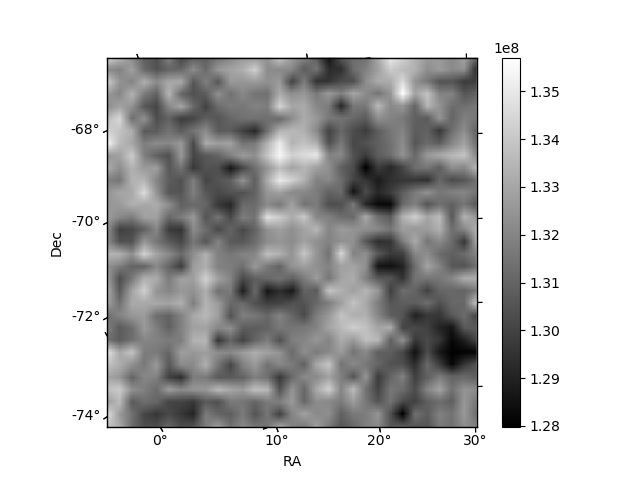
Quadrant B |
|---|---|---|---|
| Quadrant D | 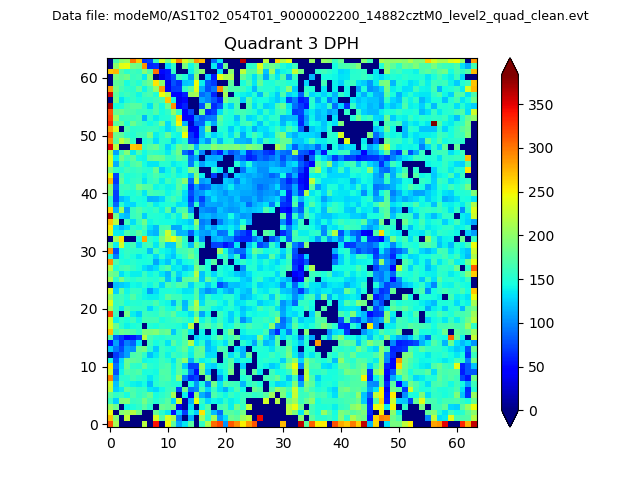 |
 |
Quadrant C |
| Plot type | Count rate plots | Images |
|---|---|---|
| Comparison with Poisson distribution Blue bars denote a histogram of data divided into 1 sec bins. Red curve is a Poisson curve with rate = median count rate of data. |
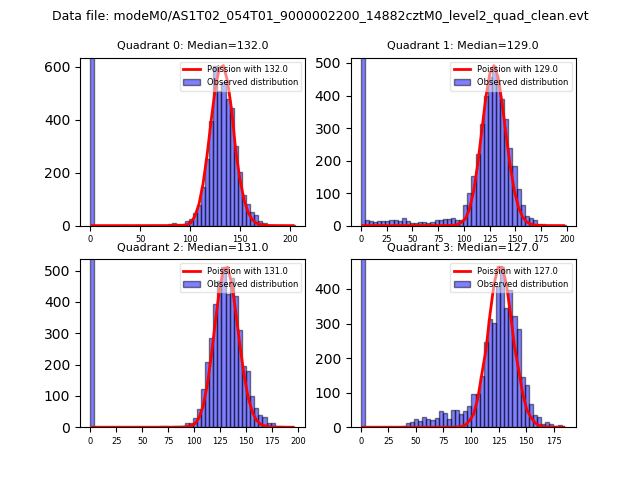 |
 |
| Quadrant-wise count rates Data is divided into 100 sec bins |
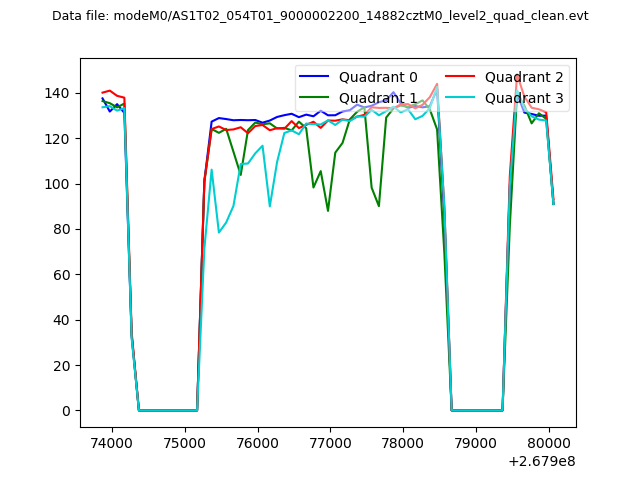 |
|
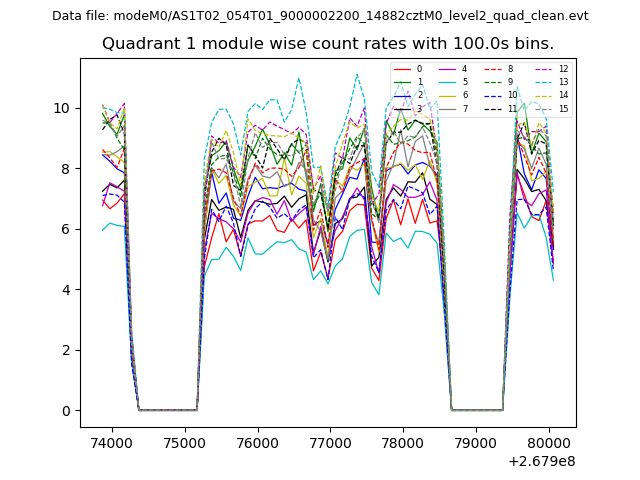
| Module-wise count rates for Quadrant A Data is divided into 100 sec bins |
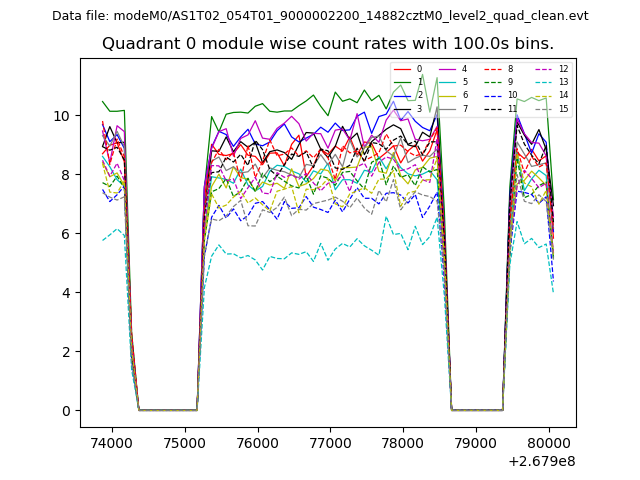 |
 |
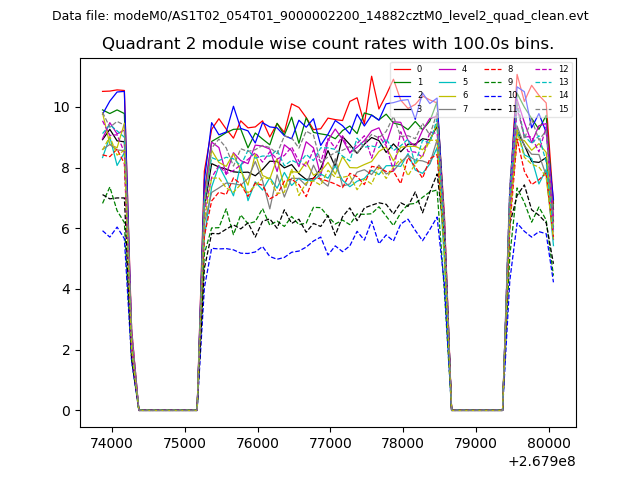
| Module-wise count rates for Quadrant B Data is divided into 100 sec bins |
 |
 |
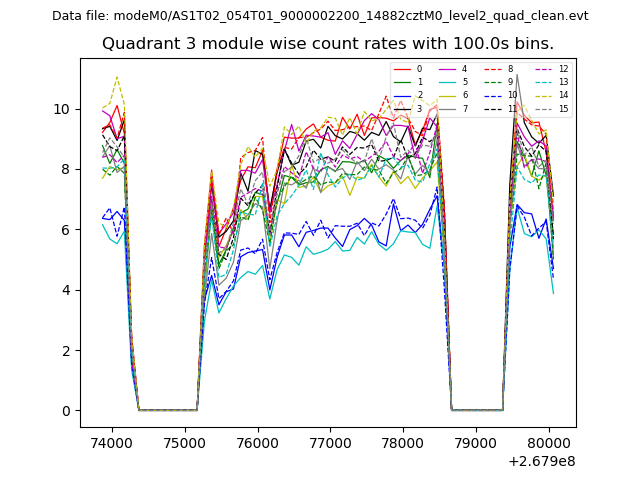
| Module-wise count rates for Quadrant C Data is divided into 100 sec bins |
 |
 |
| Module-wise count rates for Quadrant D Data is divided into 100 sec bins |
 |
 |
| Parameter | Plot |
|---|---|
| CZT HV Monitor | 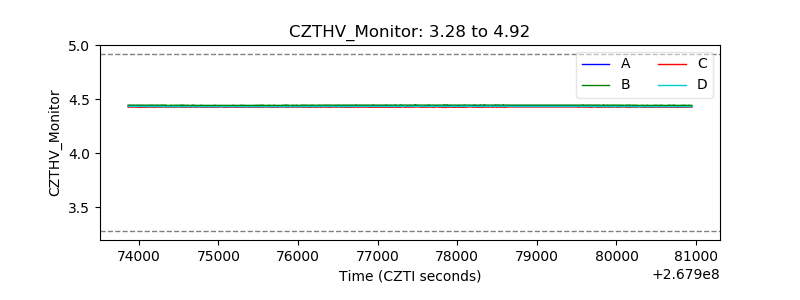 |
| D_VDD | 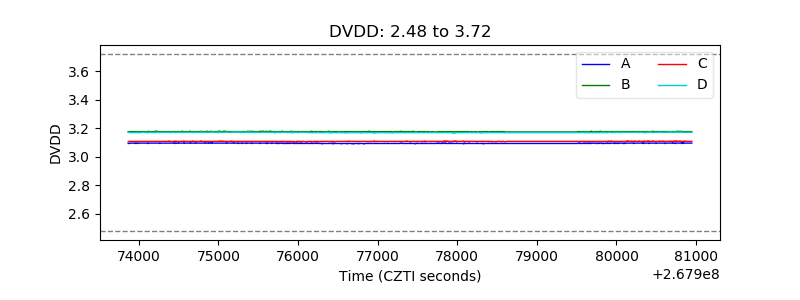 |
| Temperature 1 | 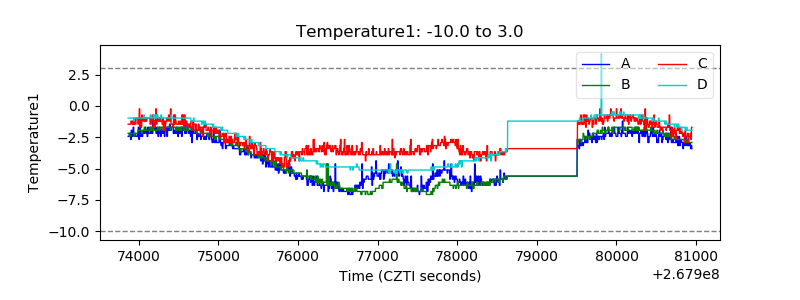 |
| Veto HV Monitor |  |
| Veto LLD | 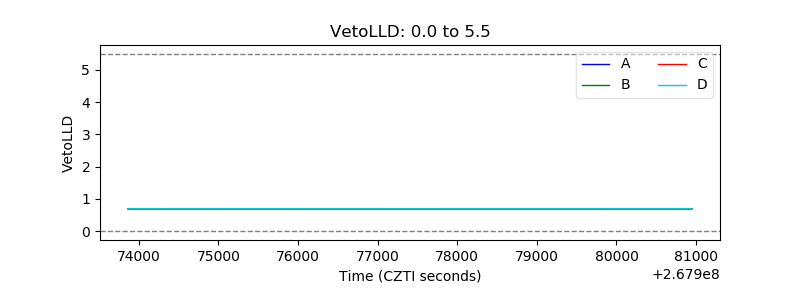 |
| Alpha Counter | 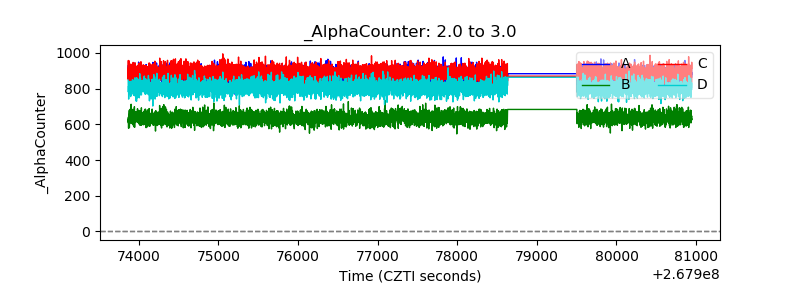 |
| _CPM_Rate | 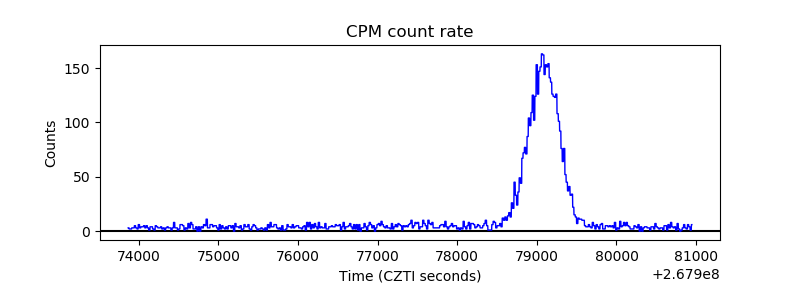 |
| CZT Counter | 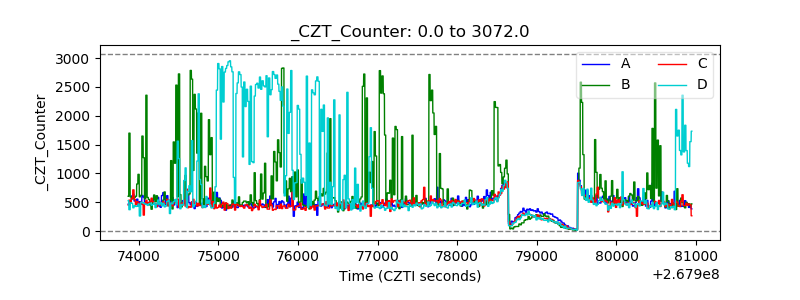 |
| +2.5 Volts monitor |  |
| +5 Volts monitor |  |
| _ROLL_ROT | 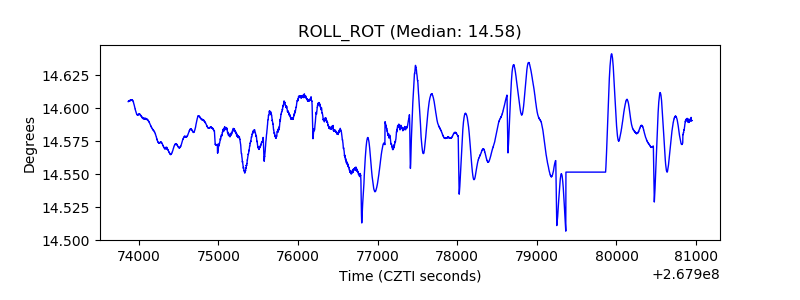 |
| _Roll_DEC |  |
| _Roll_RA | 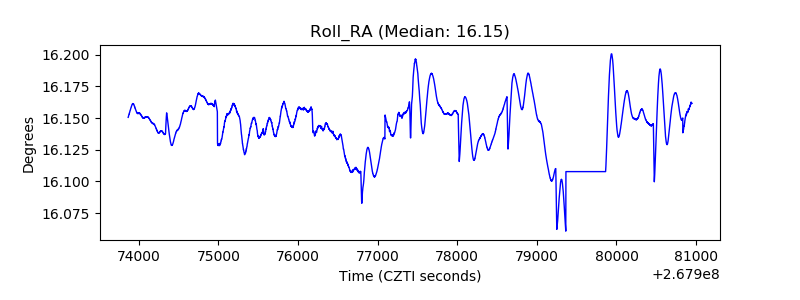 |
| Veto Counter | 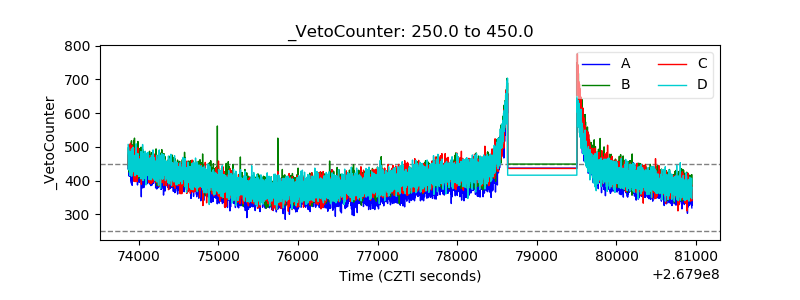 |