| Param | Original file | Final file |
|---|---|---|
| Filename | modeM0/AS1T02_054T01_9000002200_14884cztM0_level2.evt | modeM0/AS1T02_054T01_9000002200_14884cztM0_level2_quad_clean.evt |
| Size (bytes) | 589,835,520 | 104,129,280 |
| Size | 562.5 MB | 99.3 MB |
| Events in quadrant A | 3,499,749 | 686,577 |
| Events in quadrant B | 3,907,676 | 676,443 |
| Events in quadrant C | 3,659,724 | 682,374 |
| Events in quadrant D | 6,295,098 | 594,027 |
| Mode SS | |||
|---|---|---|---|
| Quadrant | BADHDUFLAG | Total packets | Discarded packets |
| A | 0 | 150 | 0 |
| B | 0 | 150 | 0 |
| C | 0 | 150 | 0 |
| D | 0 | 150 | 0 |
| Mode M9 | |||
|---|---|---|---|
| Quadrant | BADHDUFLAG | Total packets | Discarded packets |
| A | 0 | 2 | 0 |
| B | 0 | 2 | 0 |
| C | 0 | 2 | 0 |
| D | 0 | 2 | 0 |
| Mode M0 | |||
|---|---|---|---|
| Quadrant | BADHDUFLAG | Total packets | Discarded packets |
| A | 0 | 15330 | 2 |
| B | 0 | 16423 | 1 |
| C | 0 | 15503 | 1 |
| D | 0 | 23822 | 1 |
| Quadrant | Total seconds | Saturated seconds | Saturation percentage |
|---|---|---|---|
| A | 7381 | 142 | 1.923859% |
| B | 7381 | 246 | 3.332882% |
| C | 7381 | 64 | 0.867091% |
| D | 7381 | 1110 | 15.038613% |
Noise dominated data is calculated using 1-second bins in cleaned event files. If a bin has >2000 counts, and if more than 50% of those come from <1% of pixels, then it is considered to be noise-dominated and hence unusable.
| Quadrant | # 1 sec bins | Bins with >0 counts | Bins with >2000 counts | High rate bins dominated by noise | Noise dominated (total time) | Noise dominated (detector-on time) | Marked lightcurve |
|---|---|---|---|---|---|---|---|
| A | 7567 | 7383 | 1 | 1 | 0.01% | 0.01% | 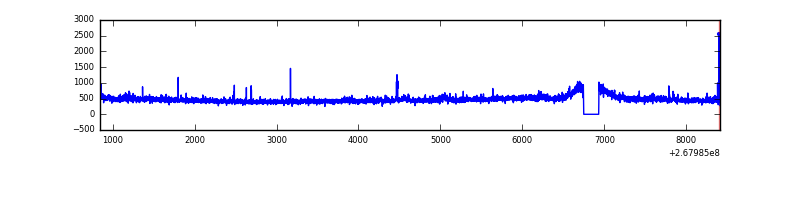 |
| B | 7567 | 7383 | 46 | 46 | 0.61% | 0.62% | 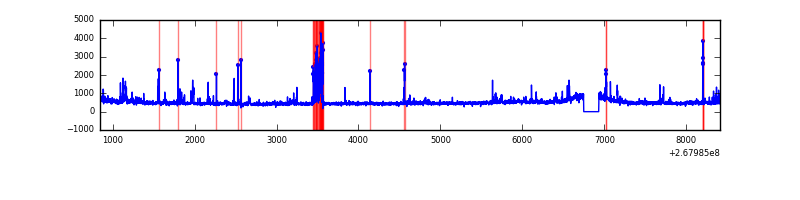 |
| C | 7567 | 7383 | 5 | 5 | 0.07% | 0.07% | 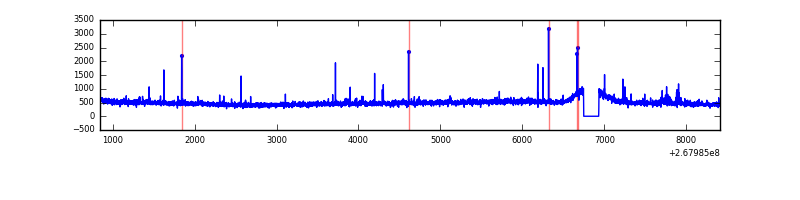 |
| D | 7567 | 7383 | 924 | 924 | 12.21% | 12.52% | 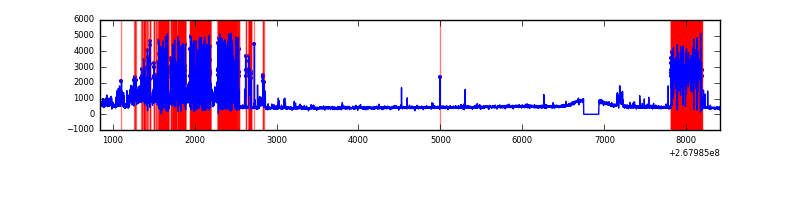 |
Top three noisy pixels from each quadrant. If the there are fewer than three noisy pixels in the level2.evt file, extra rows are filled as -1
| Pixel properties | Quadrant properties | ||||||
|---|---|---|---|---|---|---|---|
| Quadrant | DetID | PixID | Counts | Sigma | Mean | Median | Sigma |
| A | 12 | 189 | 43963 | 241.58 | 881 | 861 | 178.4 |
| A | 3 | 1 | 27525 | 149.45 | 881 | 861 | 178.4 |
| A | 9 | 143 | 20693 | 111.16 | 881 | 861 | 178.4 |
| B | 3 | 64 | 183706 | 1106.34 | 869 | 846 | 165.3 |
| B | 0 | 219 | 86344 | 517.28 | 869 | 846 | 165.3 |
| B | 0 | 189 | 61095 | 364.52 | 869 | 846 | 165.3 |
| C | 3 | 233 | 188427 | 956.85 | 849 | 852 | 196.0 |
| C | 0 | 207 | 140275 | 711.22 | 849 | 852 | 196.0 |
| C | 8 | 128 | 11715 | 55.41 | 849 | 852 | 196.0 |
| D | 7 | 254 | 3216024 | 17296.34 | 776 | 755 | 185.9 |
| D | 13 | 172 | 40293 | 212.69 | 776 | 755 | 185.9 |
| D | 7 | 38 | 26872 | 140.49 | 776 | 755 | 185.9 |
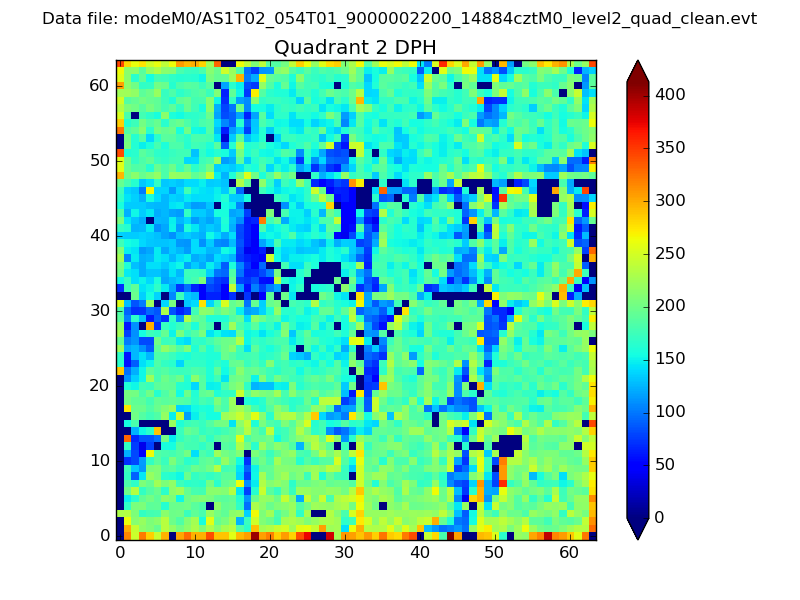
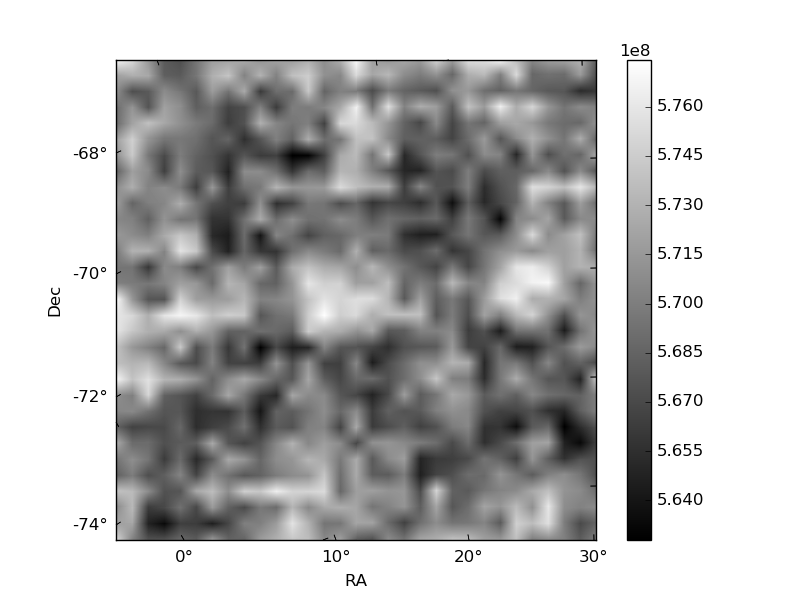
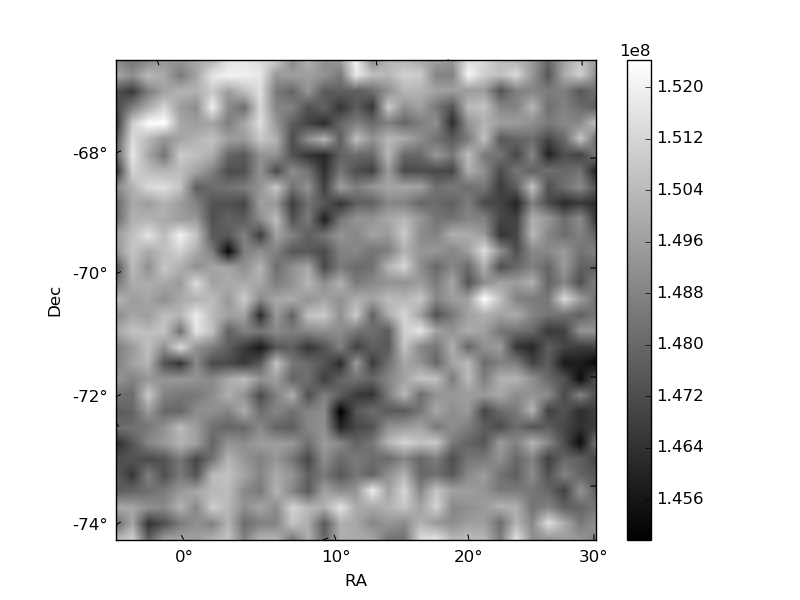
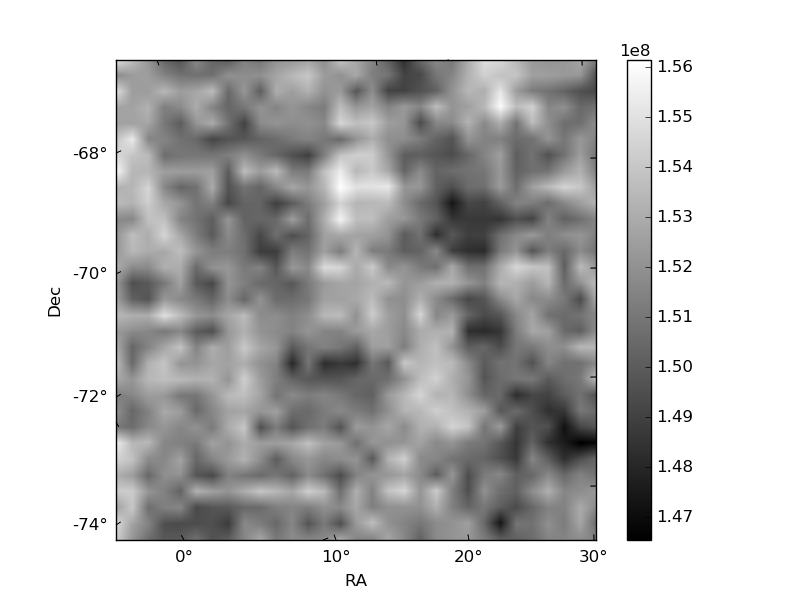
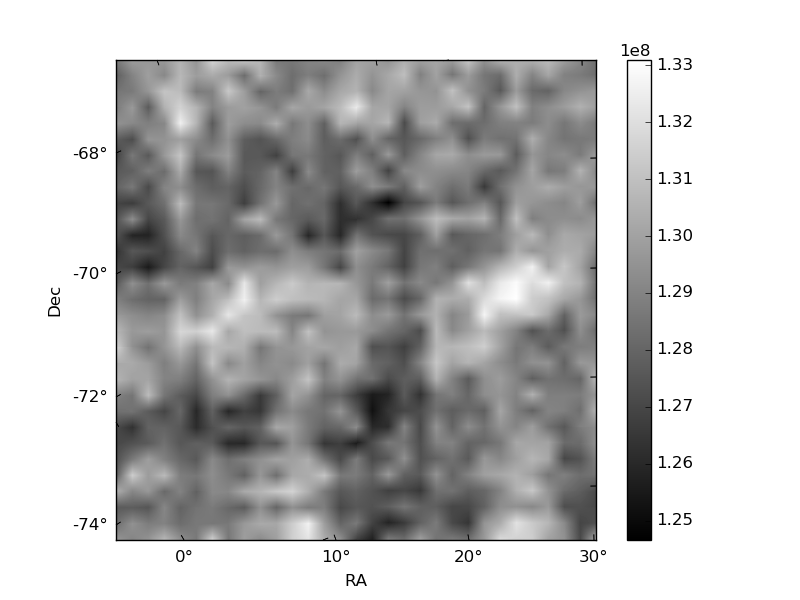
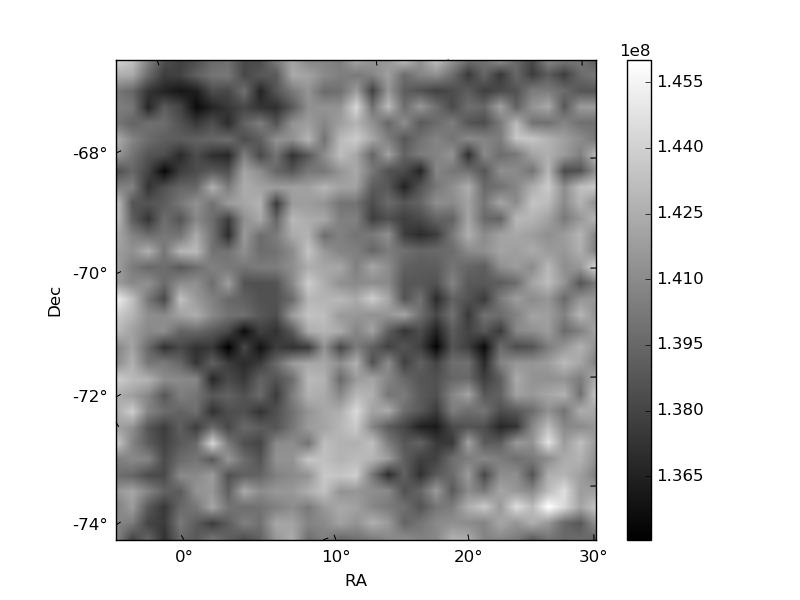
Histogram calculated using DETX and DETY for each event in the final _common_clean file
| Quadrant A | 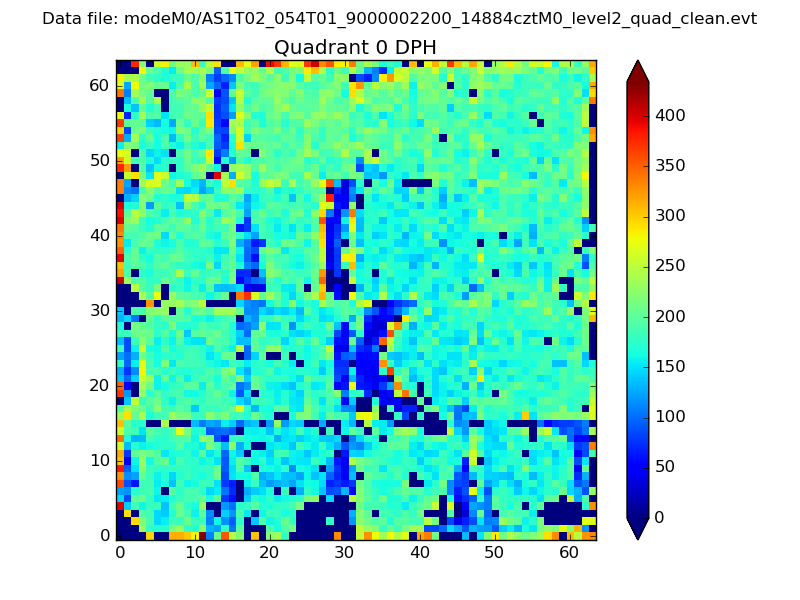 |
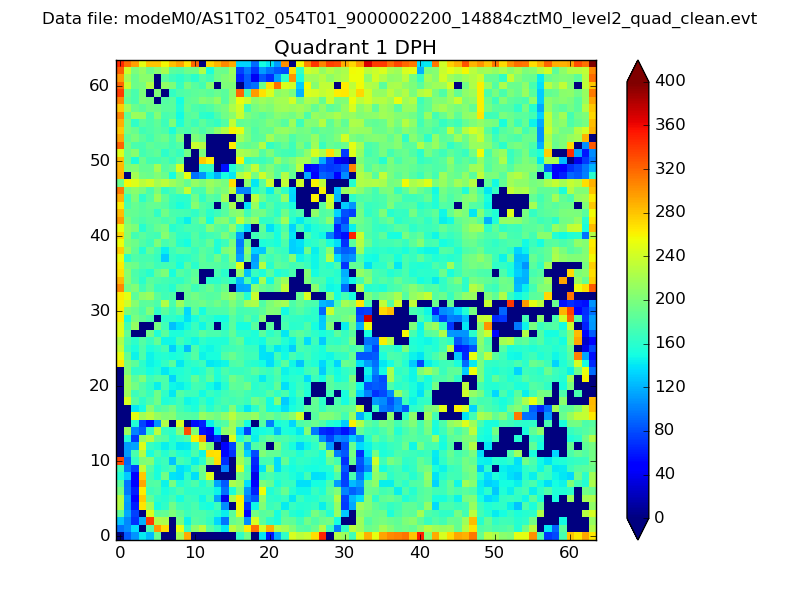 |
Quadrant B |
|---|---|---|---|
| Quadrant D | 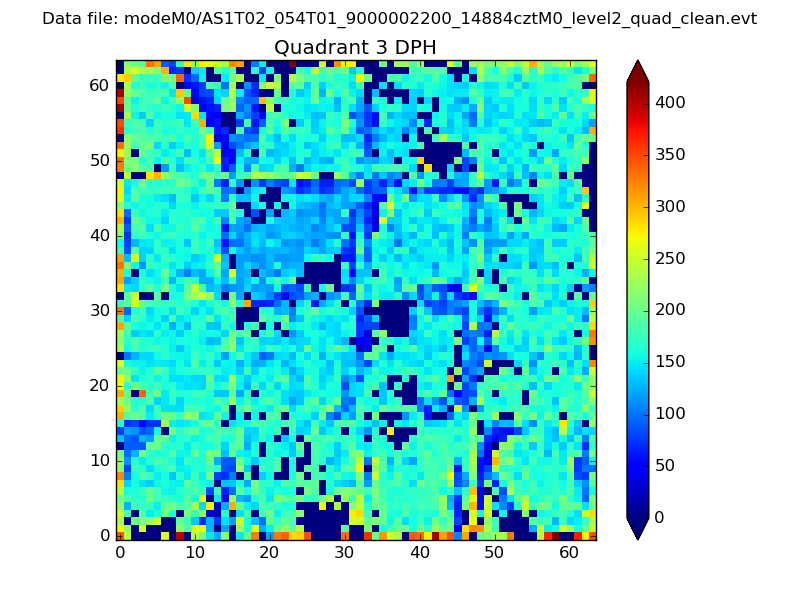 |
 |
Quadrant C |
| Plot type | Count rate plots | Images |
|---|---|---|
| Comparison with Poisson distribution Blue bars denote a histogram of data divided into 1 sec bins. Red curve is a Poisson curve with rate = median count rate of data. |
 |
 |
| Quadrant-wise count rates Data is divided into 100 sec bins |
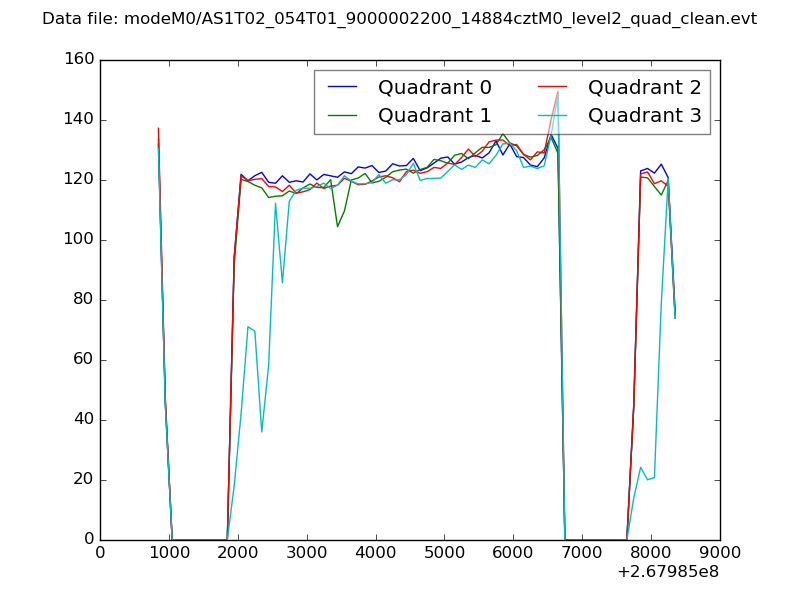 |
|
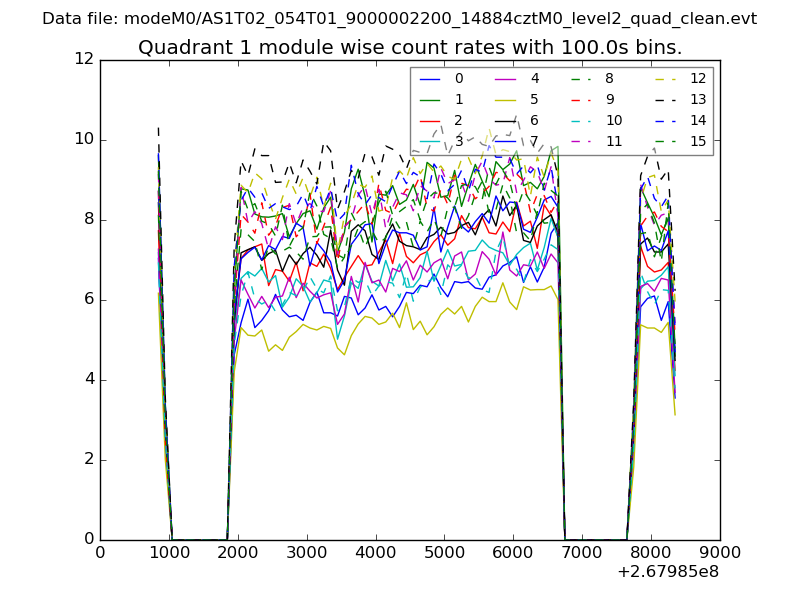
| Module-wise count rates for Quadrant A Data is divided into 100 sec bins |
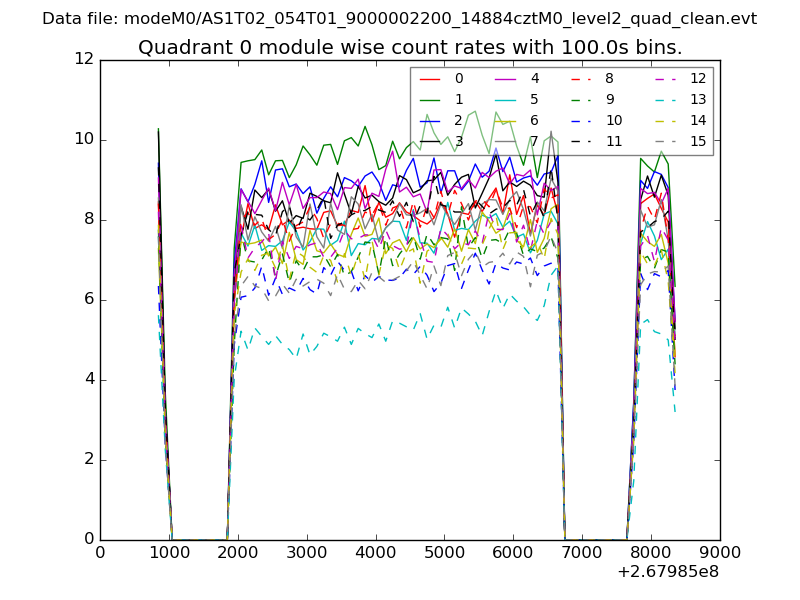 |
 |
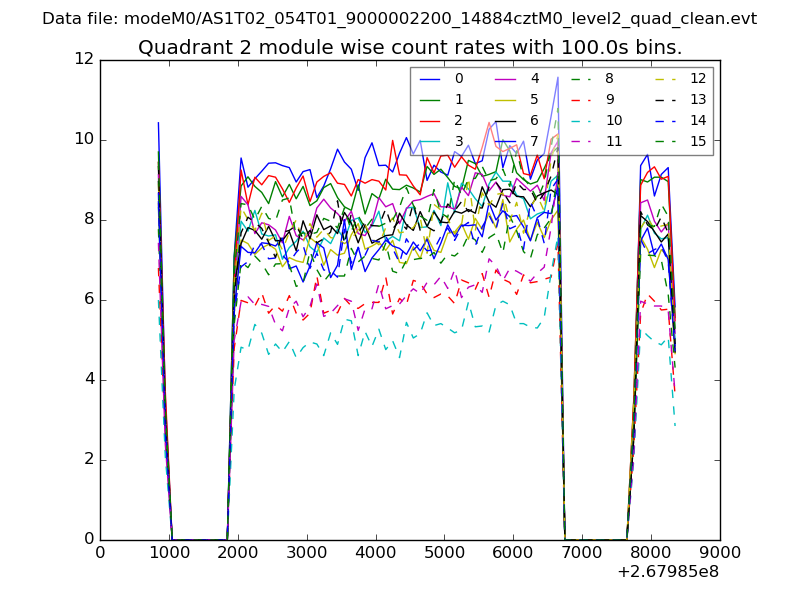
| Module-wise count rates for Quadrant B Data is divided into 100 sec bins |
 |
 |
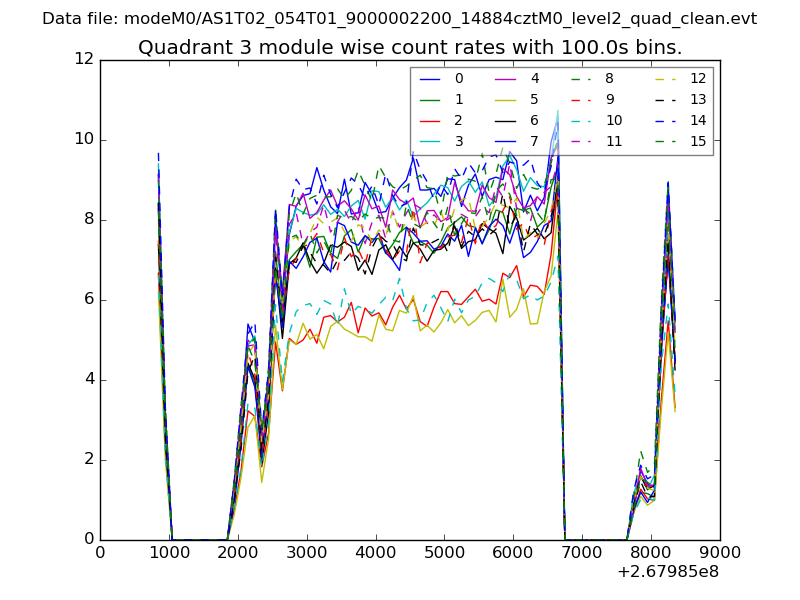
| Module-wise count rates for Quadrant C Data is divided into 100 sec bins |
 |
 |
| Module-wise count rates for Quadrant D Data is divided into 100 sec bins |
 |
 |
| Parameter | Plot |
|---|---|
| CZT HV Monitor | 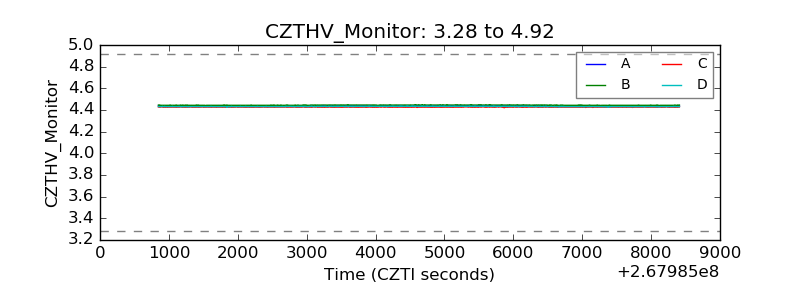 |
| D_VDD | 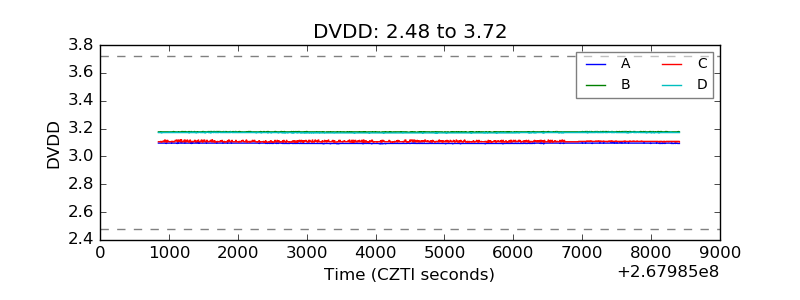 |
| Temperature 1 | 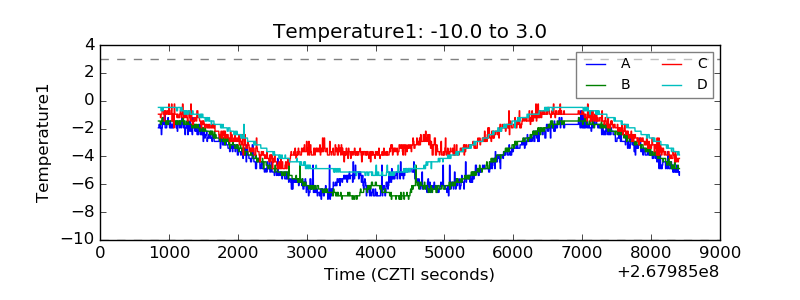 |
| Veto HV Monitor |  |
| Veto LLD | 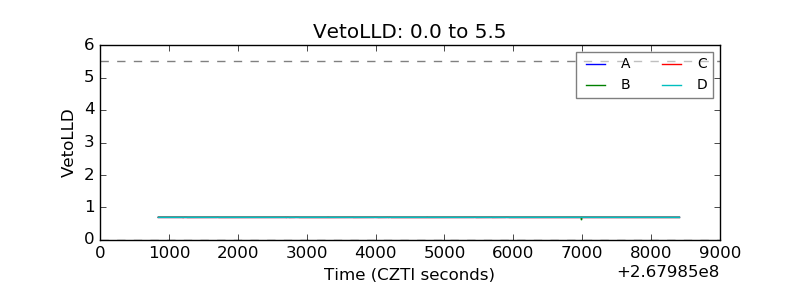 |
| Alpha Counter | 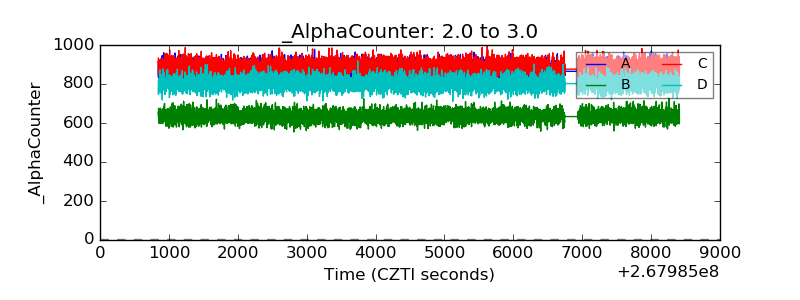 |
| _CPM_Rate | 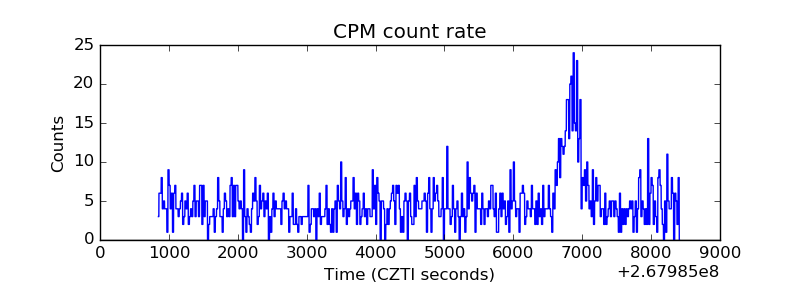 |
| CZT Counter | 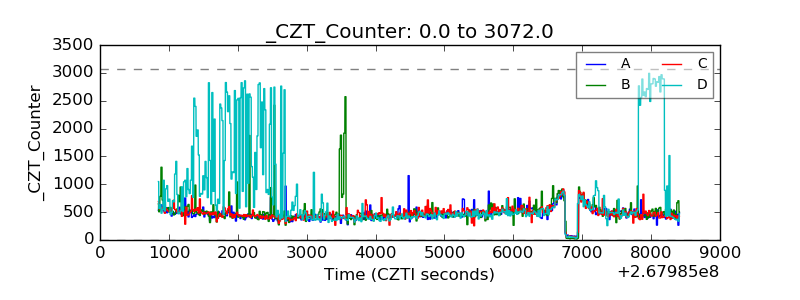 |
| +2.5 Volts monitor |  |
| +5 Volts monitor | 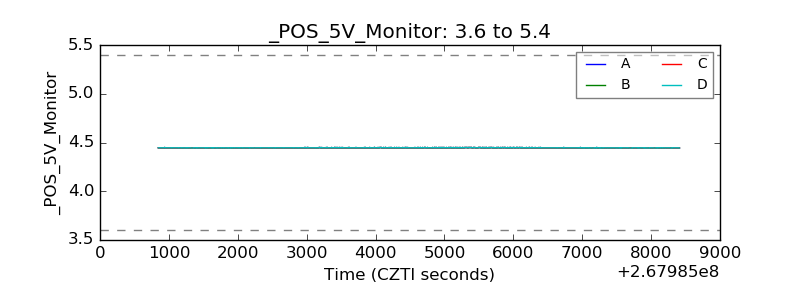 |
| _ROLL_ROT |  |
| _Roll_DEC | 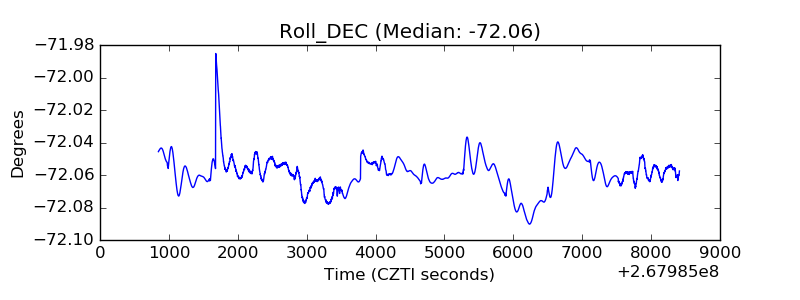 |
| _Roll_RA | 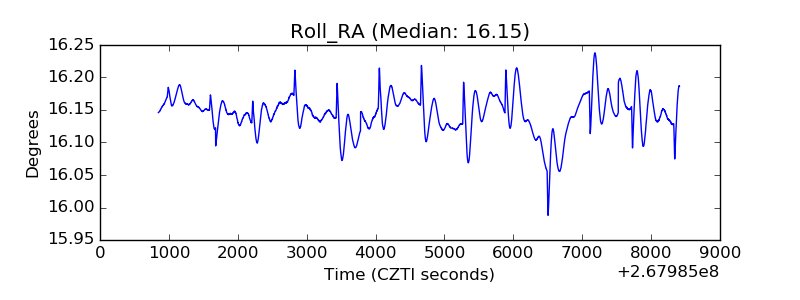 |
| Veto Counter | 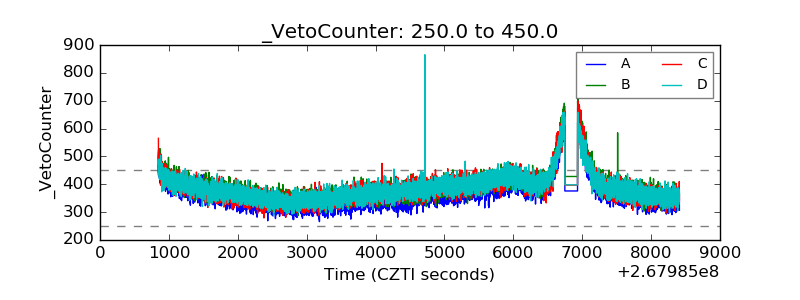 |