| Param | Original file | Final file |
|---|---|---|
| Filename | modeM0/AS1T02_054T01_9000002200_14887cztM0_level2.evt | modeM0/AS1T02_054T01_9000002200_14887cztM0_level2_quad_clean.evt |
| Size (bytes) | 1,030,610,880 | 200,465,280 |
| Size | 982.9 MB | 191.2 MB |
| Events in quadrant A | 5,992,803 | 1,346,584 |
| Events in quadrant B | 9,052,727 | 1,244,775 |
| Events in quadrant C | 6,043,741 | 1,332,856 |
| Events in quadrant D | 9,249,022 | 1,254,346 |
| Mode SS | |||
|---|---|---|---|
| Quadrant | BADHDUFLAG | Total packets | Discarded packets |
| A | 0 | 264 | 0 |
| B | 0 | 264 | 0 |
| C | 0 | 264 | 0 |
| D | 0 | 264 | 0 |
| Mode M9 | |||
|---|---|---|---|
| Quadrant | BADHDUFLAG | Total packets | Discarded packets |
| A | 0 | 15 | 0 |
| B | 0 | 15 | 0 |
| C | 0 | 15 | 0 |
| D | 0 | 15 | 0 |
| Mode M0 | |||
|---|---|---|---|
| Quadrant | BADHDUFLAG | Total packets | Discarded packets |
| A | 0 | 26600 | 0 |
| B | 0 | 35383 | 0 |
| C | 0 | 26294 | 0 |
| D | 0 | 36630 | 0 |
| Quadrant | Total seconds | Saturated seconds | Saturation percentage |
|---|---|---|---|
| A | 12917 | 92 | 0.712240% |
| B | 12918 | 1322 | 10.233782% |
| C | 12918 | 44 | 0.340610% |
| D | 12918 | 1124 | 8.701037% |
Noise dominated data is calculated using 1-second bins in cleaned event files. If a bin has >2000 counts, and if more than 50% of those come from <1% of pixels, then it is considered to be noise-dominated and hence unusable.
| Quadrant | # 1 sec bins | Bins with >0 counts | Bins with >2000 counts | High rate bins dominated by noise | Noise dominated (total time) | Noise dominated (detector-on time) | Marked lightcurve |
|---|---|---|---|---|---|---|---|
| A | 14462 | 12921 | 2 | 2 | 0.01% | 0.02% | 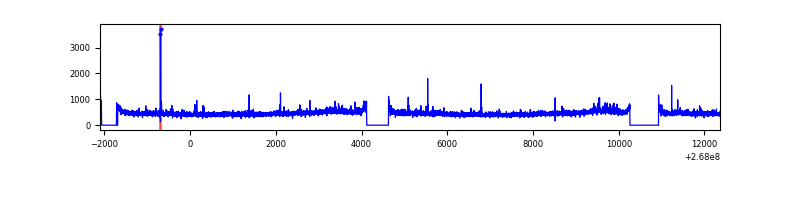 |
| B | 14463 | 12922 | 1058 | 1058 | 7.32% | 8.19% | 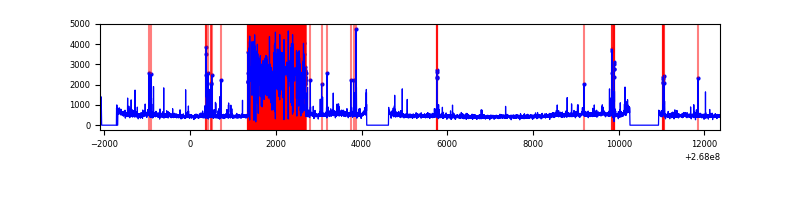 |
| C | 14463 | 12922 | 2 | 2 | 0.01% | 0.02% | 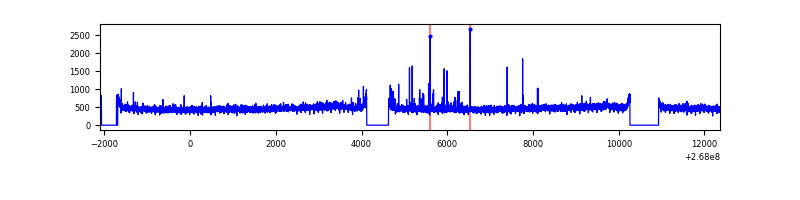 |
| D | 14463 | 12922 | 900 | 900 | 6.22% | 6.96% | 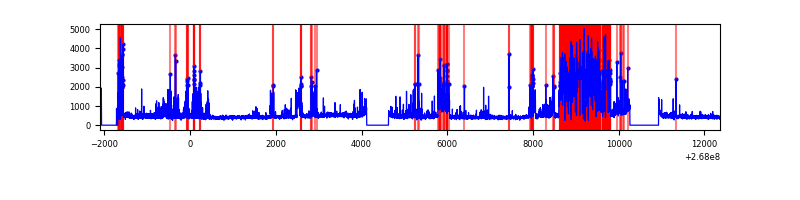 |
Top three noisy pixels from each quadrant. If the there are fewer than three noisy pixels in the level2.evt file, extra rows are filled as -1
| Pixel properties | Quadrant properties | ||||||
|---|---|---|---|---|---|---|---|
| Quadrant | DetID | PixID | Counts | Sigma | Mean | Median | Sigma |
| A | 12 | 189 | 145870 | 480.16 | 1503 | 1474 | 300.7 |
| A | 3 | 1 | 45628 | 146.83 | 1503 | 1474 | 300.7 |
| A | 4 | 2 | 14360 | 42.85 | 1503 | 1474 | 300.7 |
| B | 3 | 64 | 3093387 | 11410.87 | 1421 | 1381 | 271.0 |
| B | 0 | 189 | 94934 | 345.25 | 1421 | 1381 | 271.0 |
| B | 0 | 230 | 52373 | 188.18 | 1421 | 1381 | 271.0 |
| C | 3 | 233 | 305109 | 901.57 | 1462 | 1468 | 336.8 |
| C | 0 | 207 | 39074 | 111.66 | 1462 | 1468 | 336.8 |
| C | 13 | 61 | 10567 | 27.02 | 1462 | 1468 | 336.8 |
| D | 7 | 254 | 3787394 | 11309.0 | 1389 | 1351 | 334.8 |
| D | 2 | 120 | 56695 | 165.31 | 1389 | 1351 | 334.8 |
| D | 2 | 234 | 48097 | 139.63 | 1389 | 1351 | 334.8 |
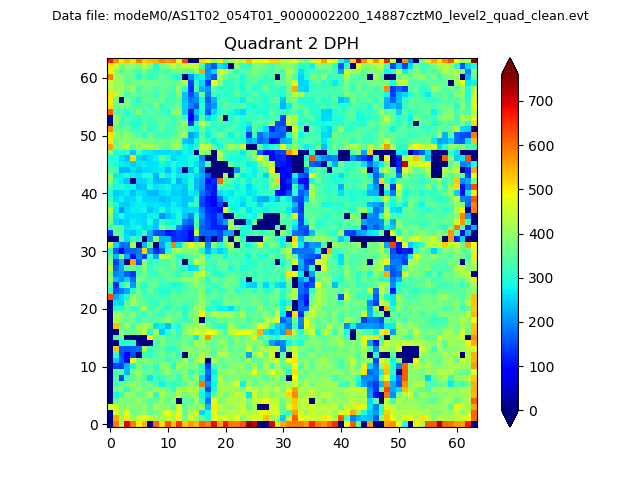
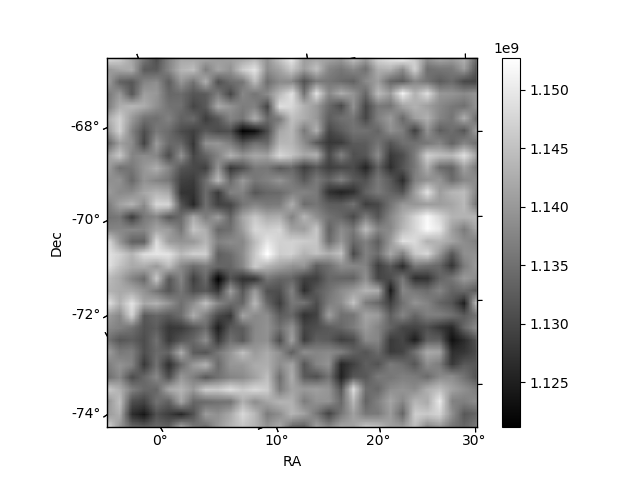
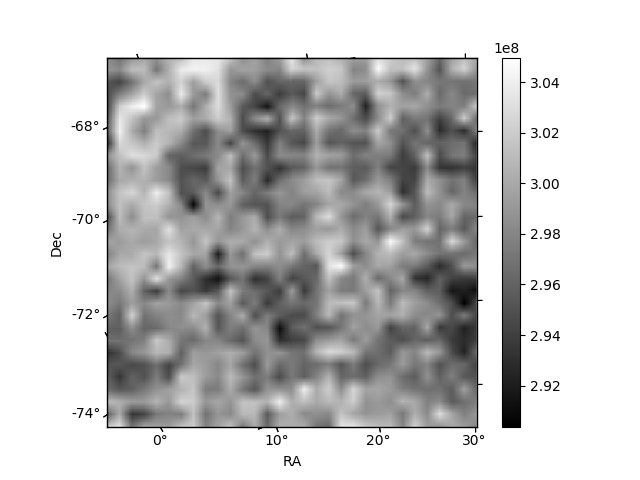
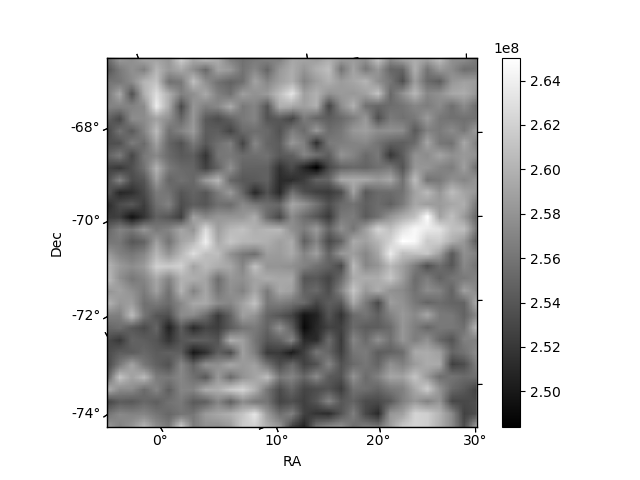
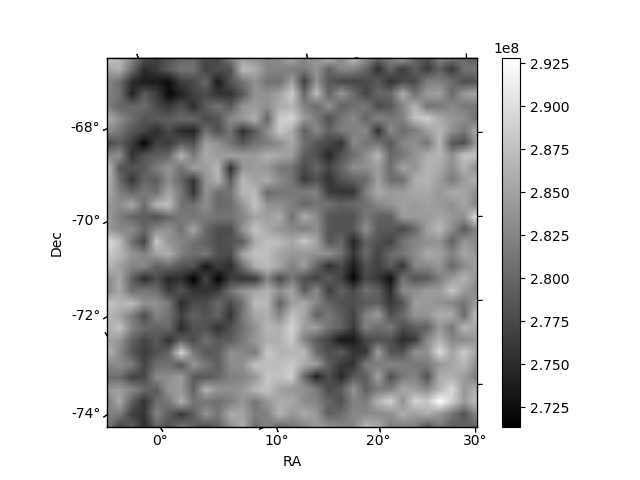
Histogram calculated using DETX and DETY for each event in the final _common_clean file
| Quadrant A | 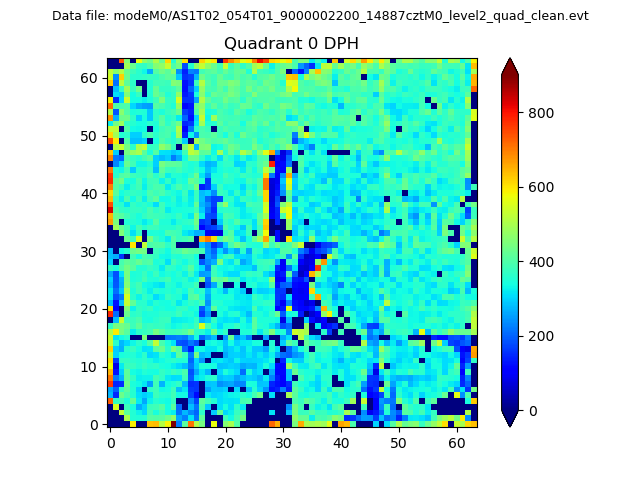 |
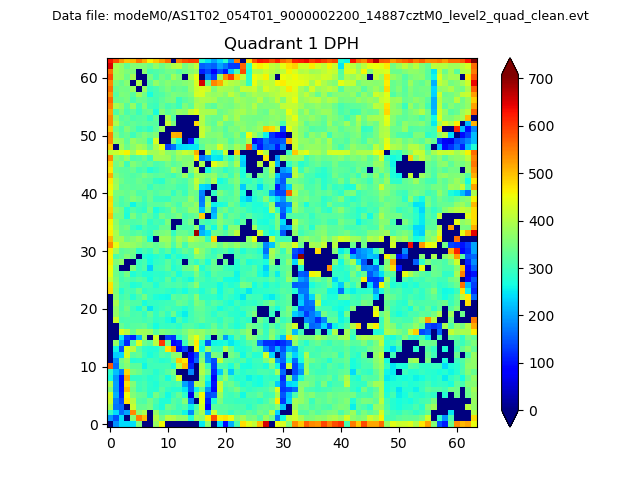 |
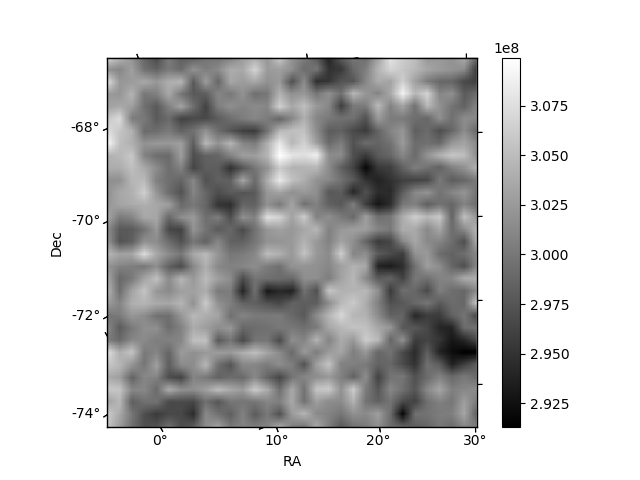
Quadrant B |
|---|---|---|---|
| Quadrant D | 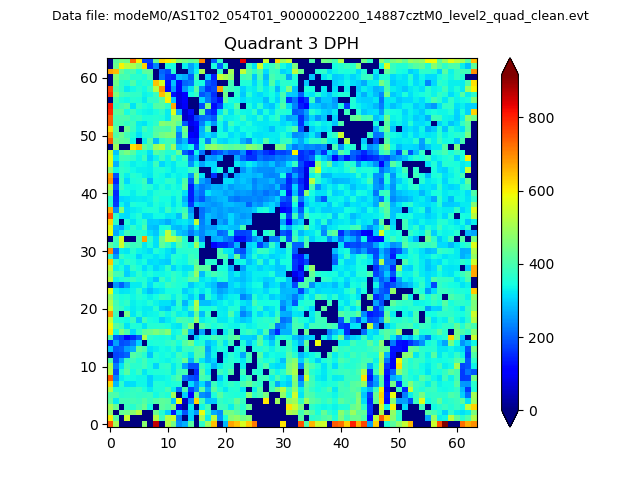 |
 |
Quadrant C |
| Plot type | Count rate plots | Images |
|---|---|---|
| Comparison with Poisson distribution Blue bars denote a histogram of data divided into 1 sec bins. Red curve is a Poisson curve with rate = median count rate of data. |
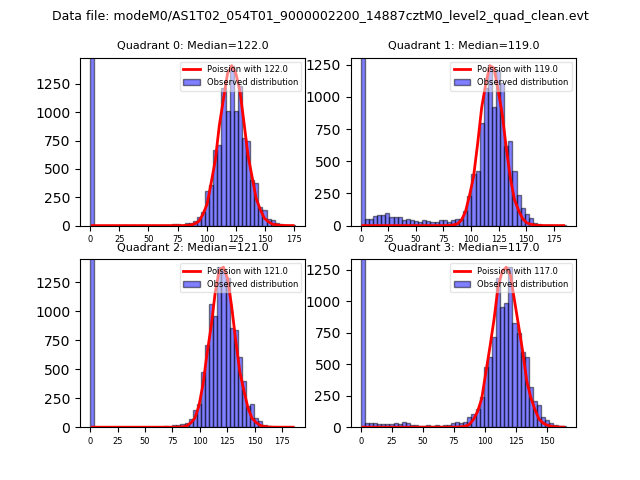 |
 |
| Quadrant-wise count rates Data is divided into 100 sec bins |
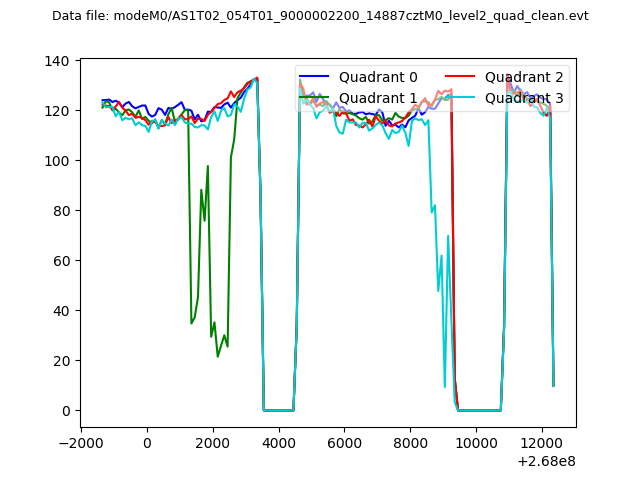 |
|
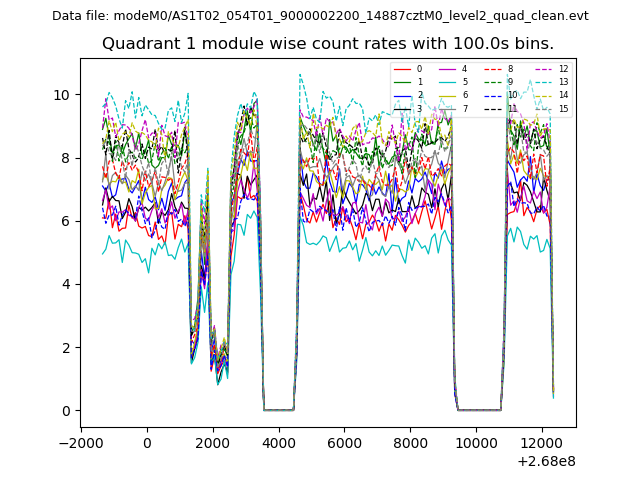
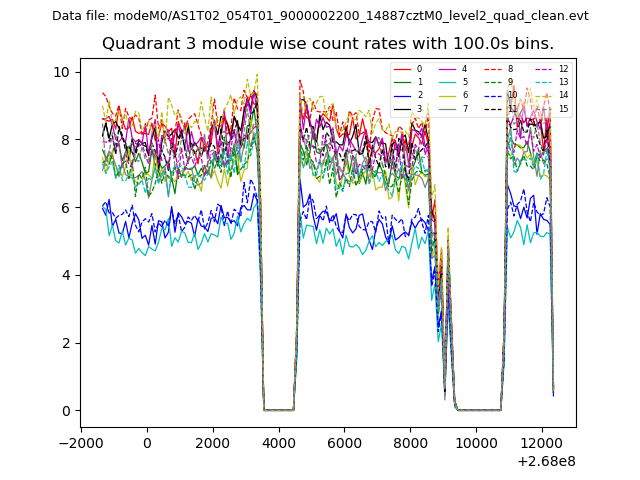
| Module-wise count rates for Quadrant A Data is divided into 100 sec bins |
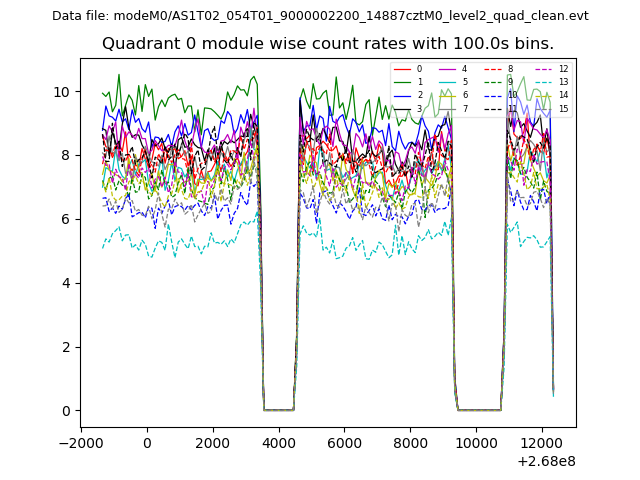 |
 |
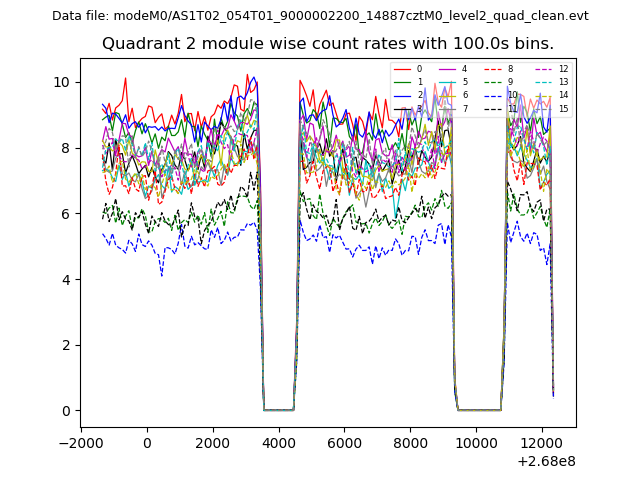
| Module-wise count rates for Quadrant B Data is divided into 100 sec bins |
 |
 |
| Module-wise count rates for Quadrant C Data is divided into 100 sec bins |
 |
 |
| Module-wise count rates for Quadrant D Data is divided into 100 sec bins |
 |
 |
| Parameter | Plot |
|---|---|
| CZT HV Monitor | 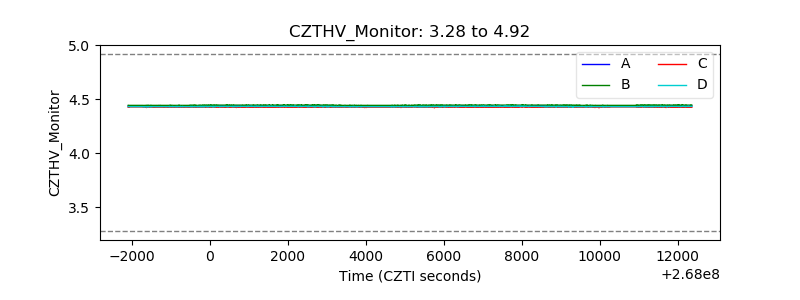 |
| D_VDD | 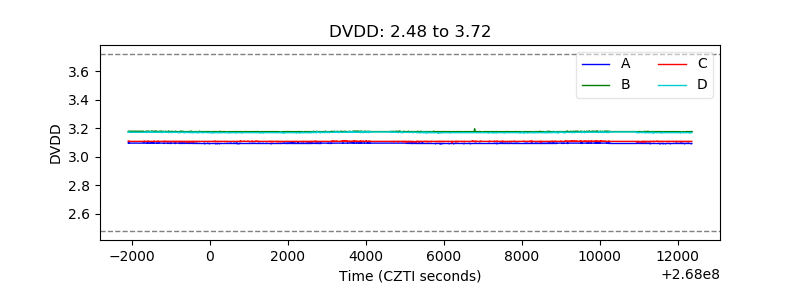 |
| Temperature 1 | 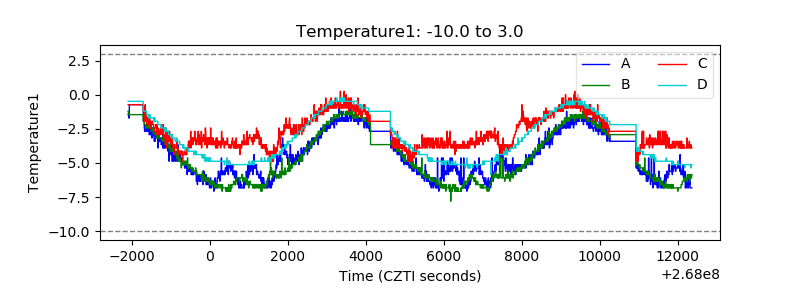 |
| Veto HV Monitor | 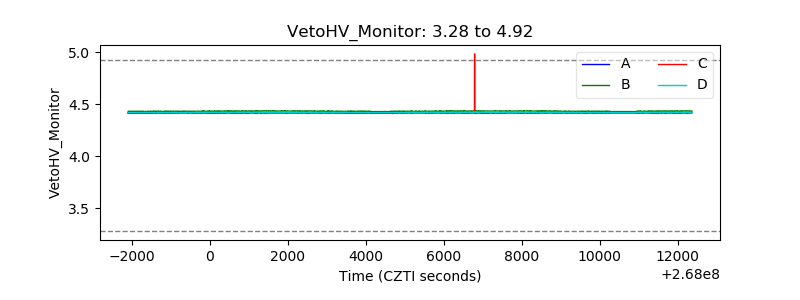 |
| Veto LLD | 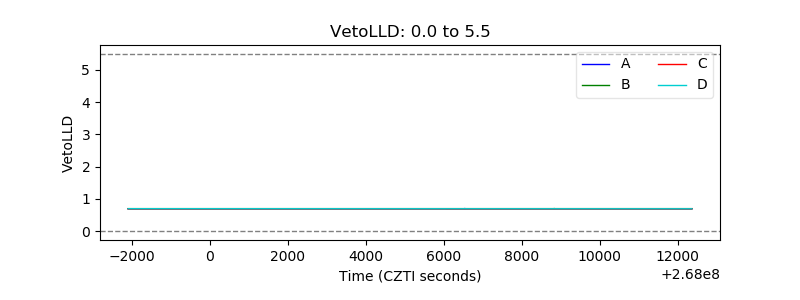 |
| Alpha Counter | 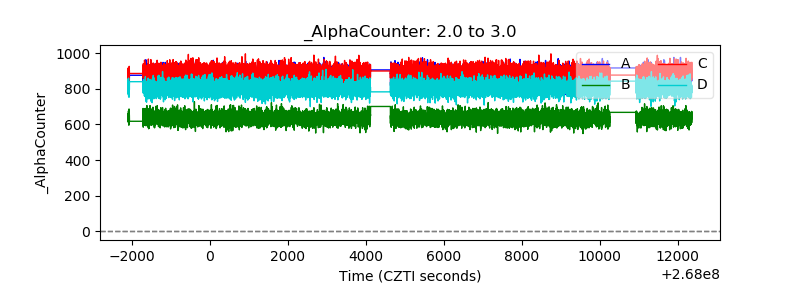 |
| _CPM_Rate | 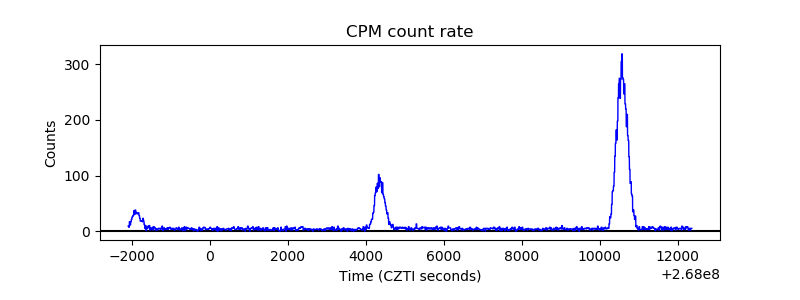 |
| CZT Counter | 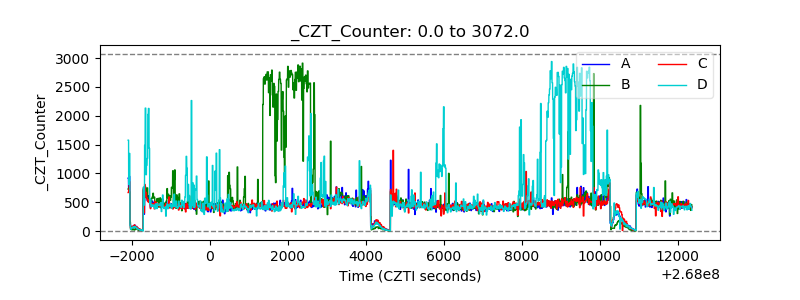 |
| +2.5 Volts monitor |  |
| +5 Volts monitor | 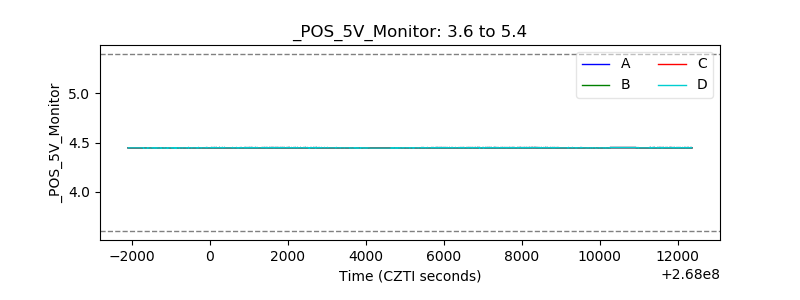 |
| _ROLL_ROT | 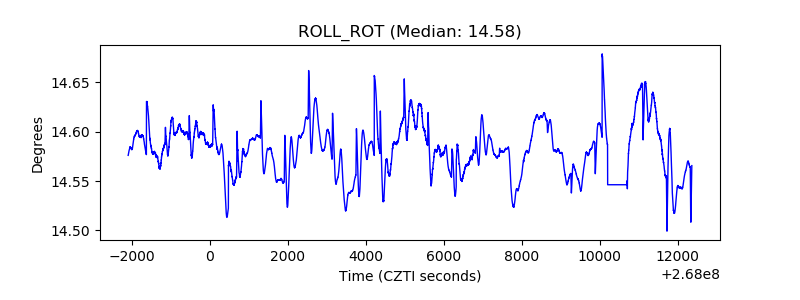 |
| _Roll_DEC | 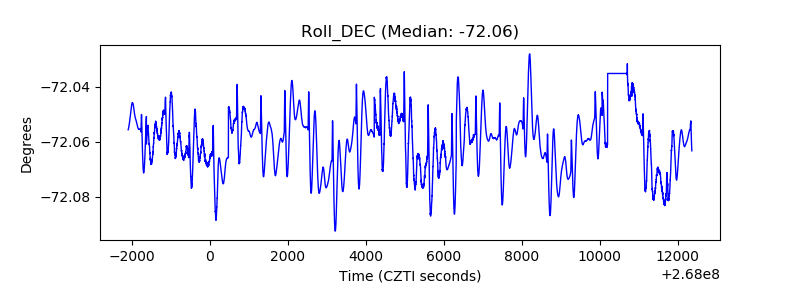 |
| _Roll_RA | 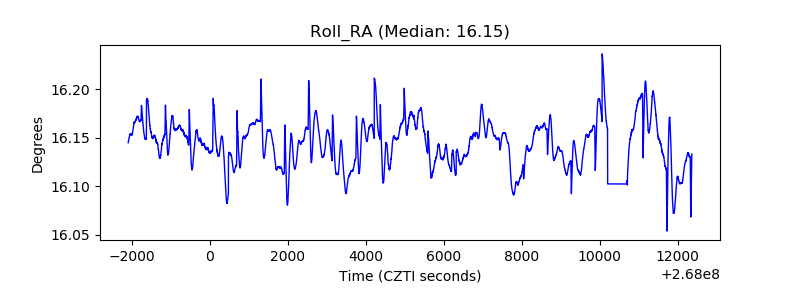 |
| Veto Counter | 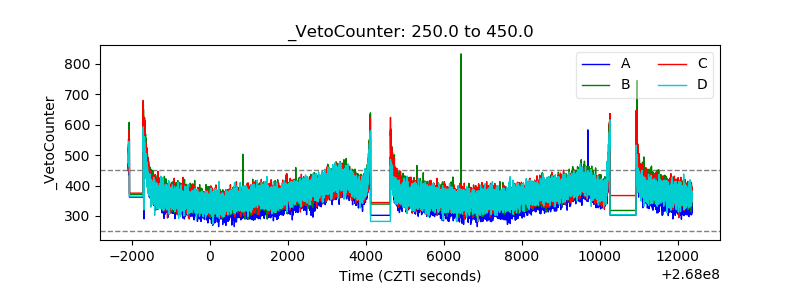 |