| Param | Original file | Final file |
|---|---|---|
| Filename | modeM0/AS1T02_054T01_9000002200_14888cztM0_level2.evt | modeM0/AS1T02_054T01_9000002200_14888cztM0_level2_quad_clean.evt |
| Size (bytes) | 500,875,200 | 111,830,400 |
| Size | 477.7 MB | 106.6 MB |
| Events in quadrant A | 3,386,461 | 727,470 |
| Events in quadrant B | 3,879,047 | 724,749 |
| Events in quadrant C | 3,432,747 | 727,386 |
| Events in quadrant D | 3,981,947 | 706,355 |
| Mode SS | |||
|---|---|---|---|
| Quadrant | BADHDUFLAG | Total packets | Discarded packets |
| A | 0 | 148 | 0 |
| B | 0 | 148 | 0 |
| C | 0 | 148 | 0 |
| D | 0 | 148 | 0 |
| Mode M9 | |||
|---|---|---|---|
| Quadrant | BADHDUFLAG | Total packets | Discarded packets |
| A | 0 | 15 | 0 |
| B | 0 | 15 | 0 |
| C | 0 | 15 | 0 |
| D | 0 | 15 | 0 |
| Mode M0 | |||
|---|---|---|---|
| Quadrant | BADHDUFLAG | Total packets | Discarded packets |
| A | 0 | 14812 | 0 |
| B | 0 | 16243 | 0 |
| C | 0 | 14618 | 0 |
| D | 0 | 16960 | 0 |
| Quadrant | Total seconds | Saturated seconds | Saturation percentage |
|---|---|---|---|
| A | 7194 | 52 | 0.722825% |
| B | 7195 | 149 | 2.070883% |
| C | 7195 | 51 | 0.708826% |
| D | 7195 | 177 | 2.460042% |
Noise dominated data is calculated using 1-second bins in cleaned event files. If a bin has >2000 counts, and if more than 50% of those come from <1% of pixels, then it is considered to be noise-dominated and hence unusable.
| Quadrant | # 1 sec bins | Bins with >0 counts | Bins with >2000 counts | High rate bins dominated by noise | Noise dominated (total time) | Noise dominated (detector-on time) | Marked lightcurve |
|---|---|---|---|---|---|---|---|
| A | 8699 | 7196 | 4 | 4 | 0.05% | 0.06% | 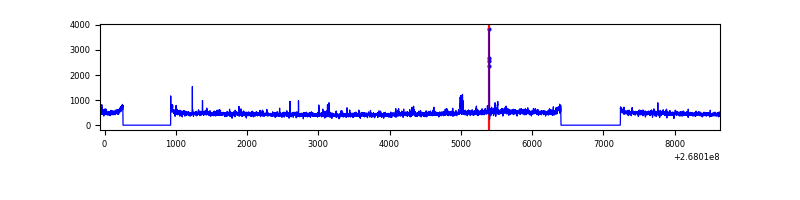 |
| B | 8700 | 7197 | 57 | 57 | 0.66% | 0.79% | 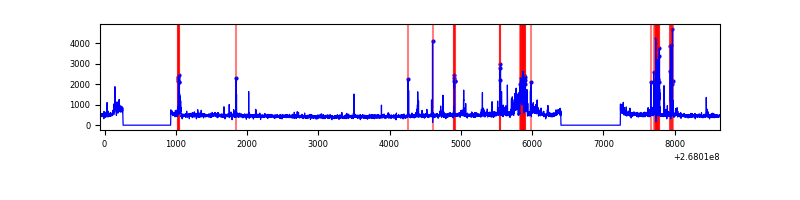 |
| C | 8700 | 7197 | 0 | 0 | 0.00% | 0.00% | 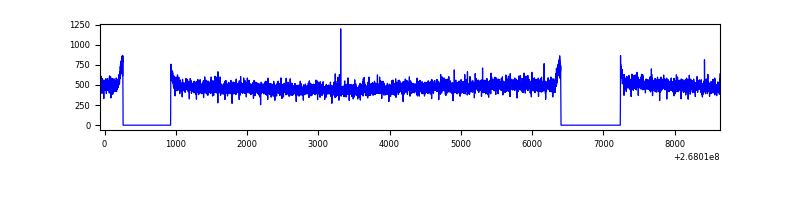 |
| D | 8700 | 7197 | 81 | 81 | 0.93% | 1.13% | 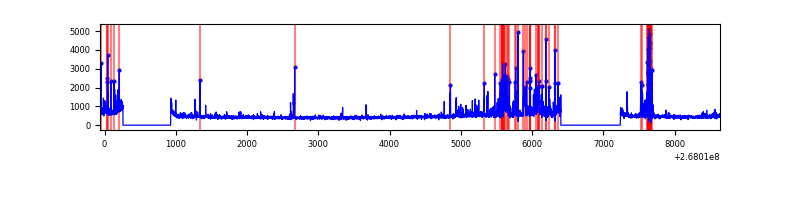 |
Top three noisy pixels from each quadrant. If the there are fewer than three noisy pixels in the level2.evt file, extra rows are filled as -1
| Pixel properties | Quadrant properties | ||||||
|---|---|---|---|---|---|---|---|
| Quadrant | DetID | PixID | Counts | Sigma | Mean | Median | Sigma |
| A | 12 | 189 | 102968 | 594.39 | 844 | 824 | 171.8 |
| A | 3 | 1 | 17577 | 97.49 | 844 | 824 | 171.8 |
| A | 15 | 69 | 11426 | 61.69 | 844 | 824 | 171.8 |
| B | 3 | 64 | 213731 | 1334.56 | 841 | 820 | 159.5 |
| B | 3 | 209 | 173095 | 1079.85 | 841 | 820 | 159.5 |
| B | 0 | 230 | 53275 | 328.8 | 841 | 820 | 159.5 |
| C | 3 | 233 | 202499 | 1051.78 | 827 | 830 | 191.7 |
| C | 13 | 61 | 6038 | 27.16 | 827 | 830 | 191.7 |
| C | 3 | 232 | 4440 | 18.83 | 827 | 830 | 191.7 |
| D | 7 | 254 | 813630 | 4176.07 | 814 | 795 | 194.6 |
| D | 2 | 234 | 25117 | 124.96 | 814 | 795 | 194.6 |
| D | 10 | 70 | 23433 | 116.3 | 814 | 795 | 194.6 |
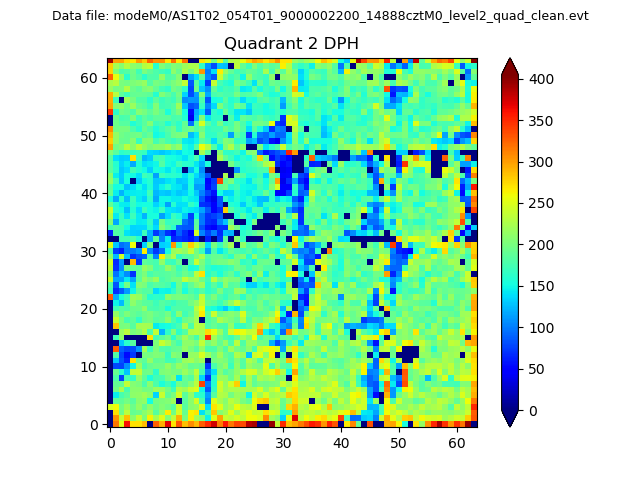
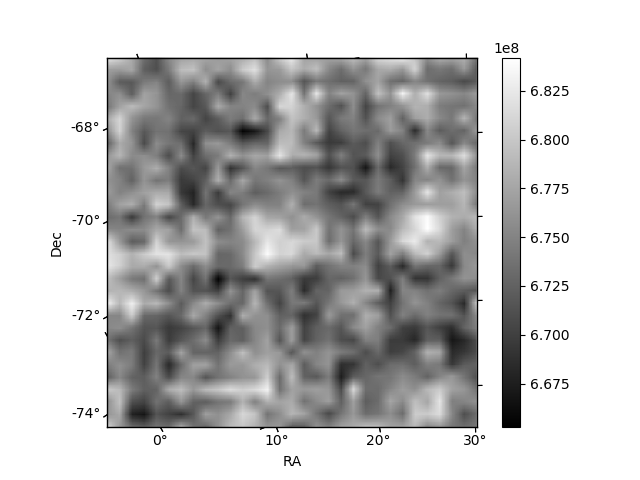
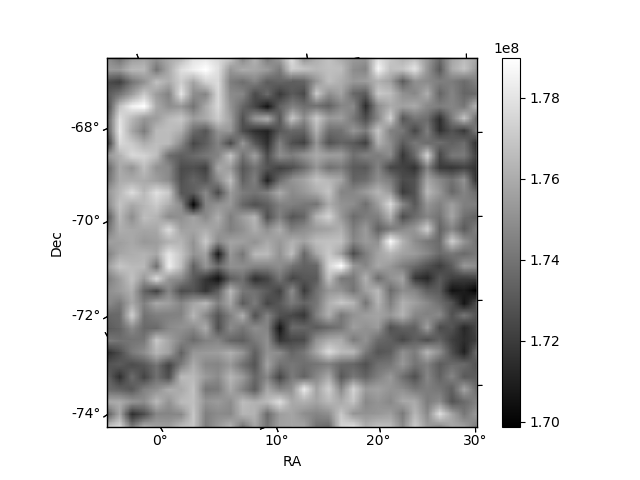
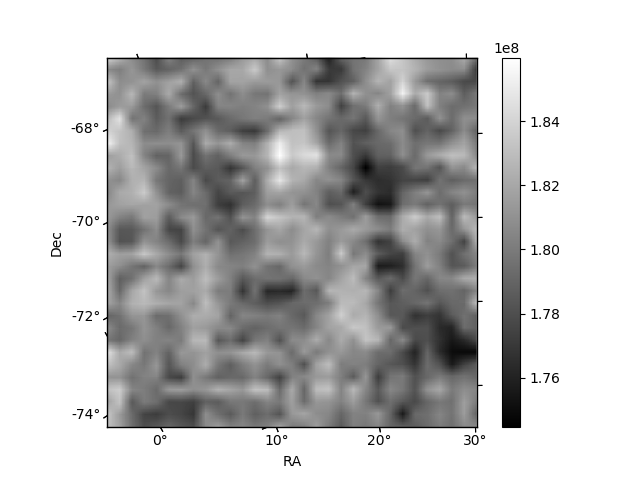
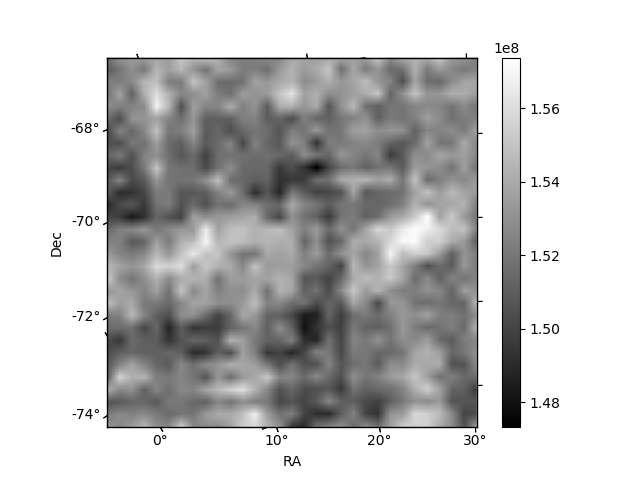
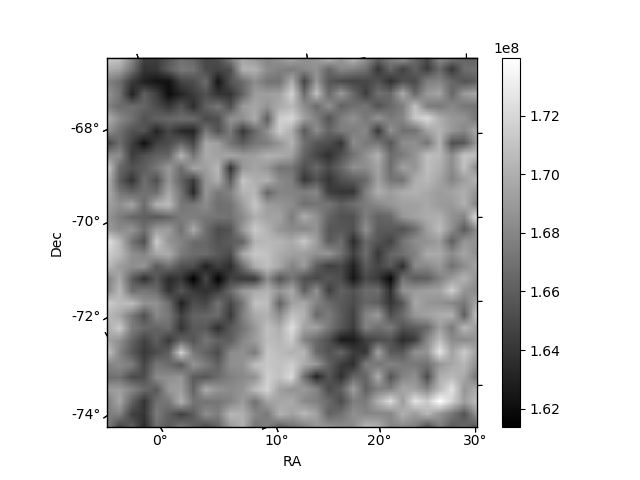
Histogram calculated using DETX and DETY for each event in the final _common_clean file
| Quadrant A | 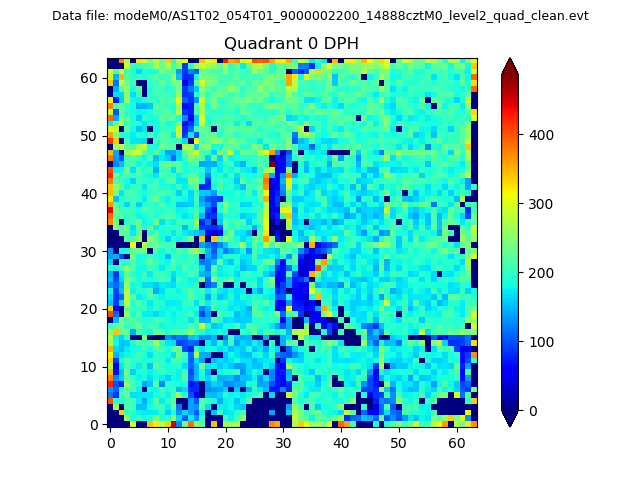 |
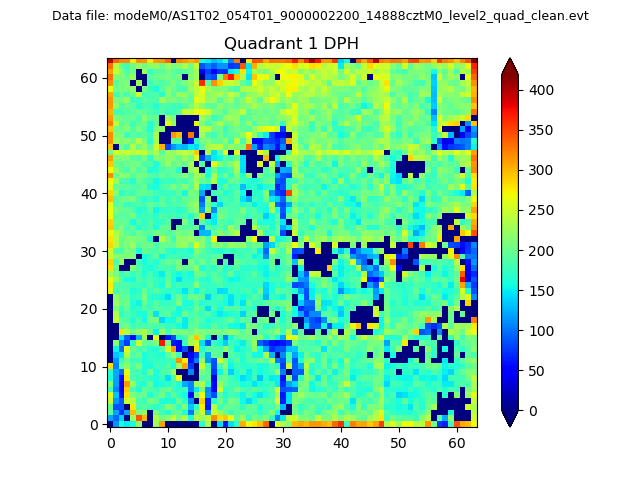 |
Quadrant B |
|---|---|---|---|
| Quadrant D | 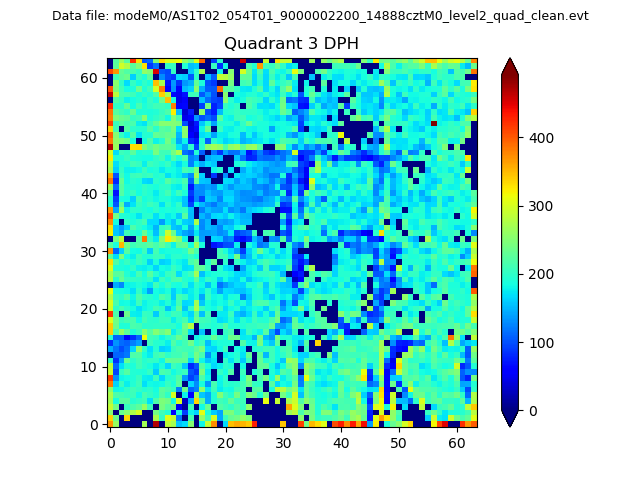 |
 |
Quadrant C |
| Plot type | Count rate plots | Images |
|---|---|---|
| Comparison with Poisson distribution Blue bars denote a histogram of data divided into 1 sec bins. Red curve is a Poisson curve with rate = median count rate of data. |
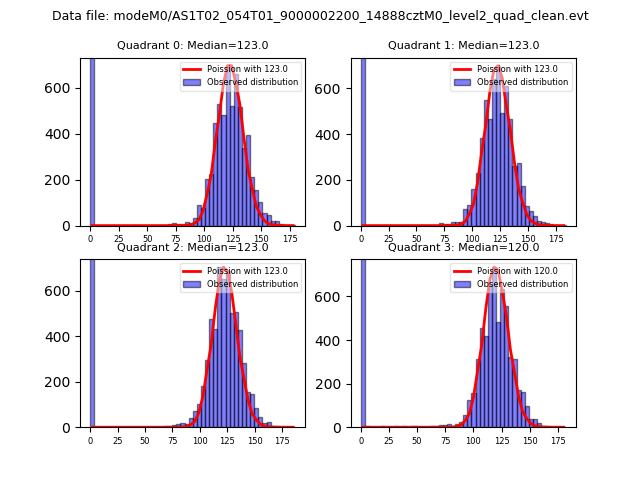 |
 |
| Quadrant-wise count rates Data is divided into 100 sec bins |
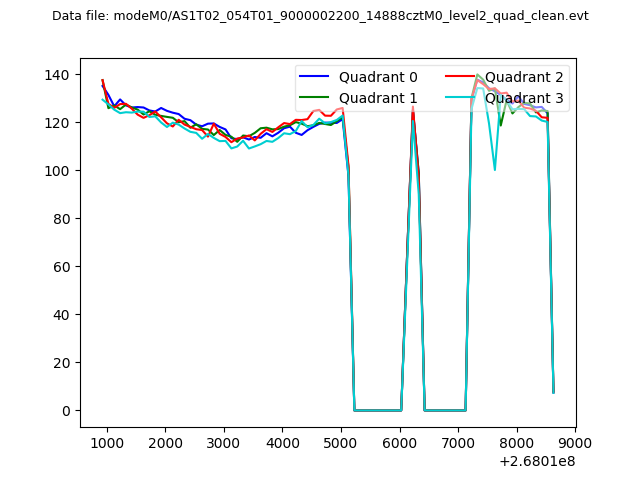 |
|
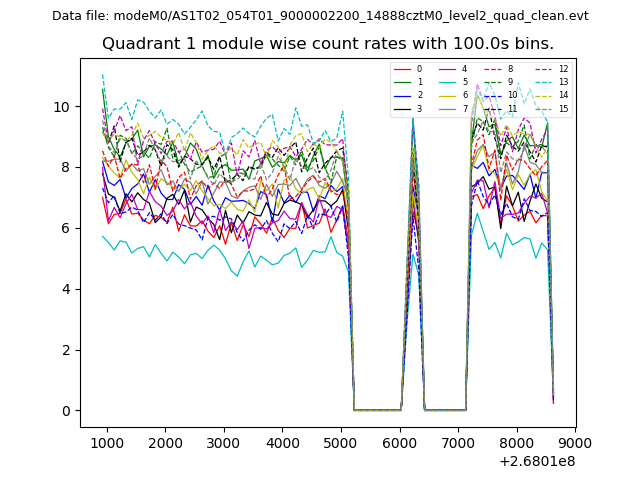
| Module-wise count rates for Quadrant A Data is divided into 100 sec bins |
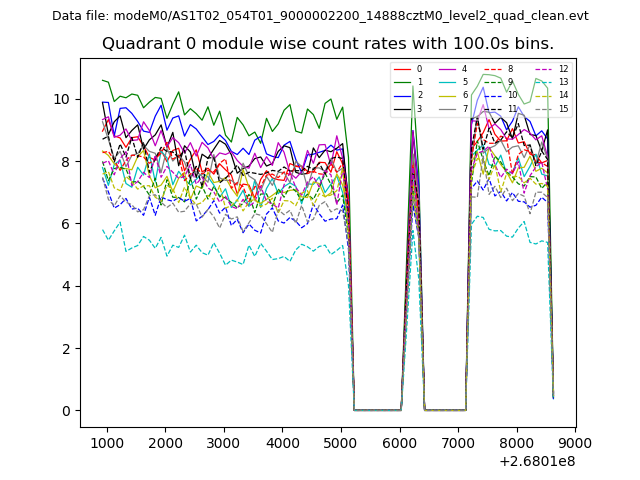 |
 |
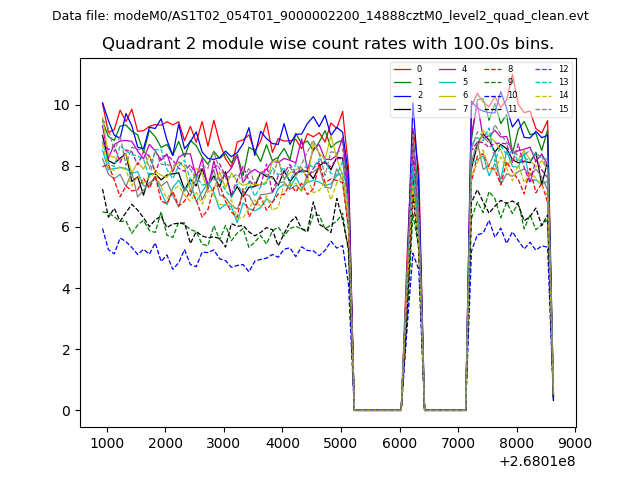
| Module-wise count rates for Quadrant B Data is divided into 100 sec bins |
 |
 |
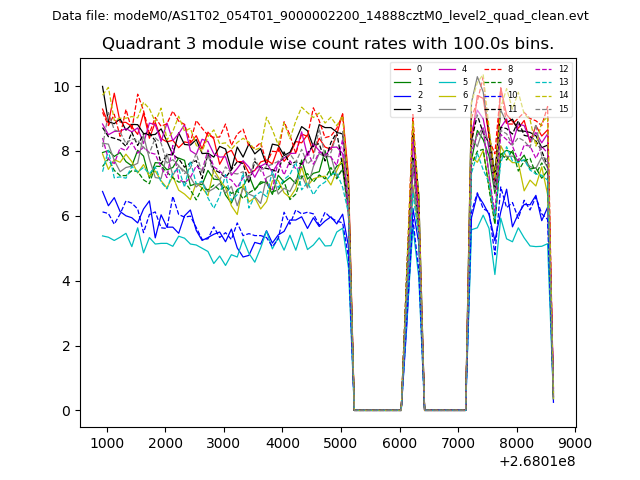
| Module-wise count rates for Quadrant C Data is divided into 100 sec bins |
 |
 |
| Module-wise count rates for Quadrant D Data is divided into 100 sec bins |
 |
 |
| Parameter | Plot |
|---|---|
| CZT HV Monitor | 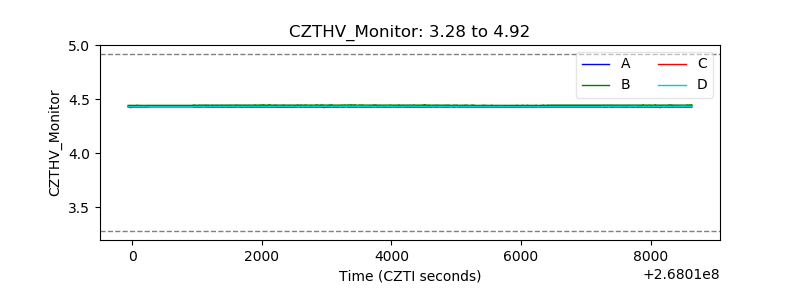 |
| D_VDD | 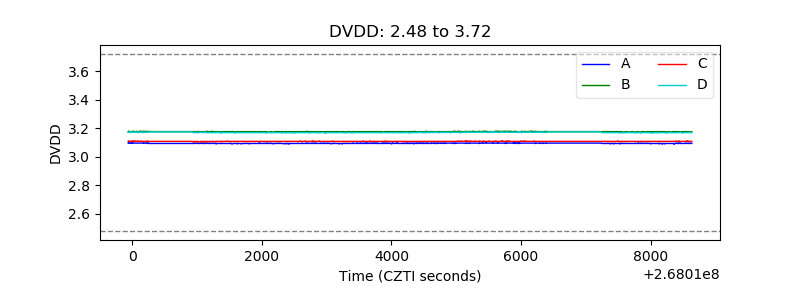 |
| Temperature 1 | 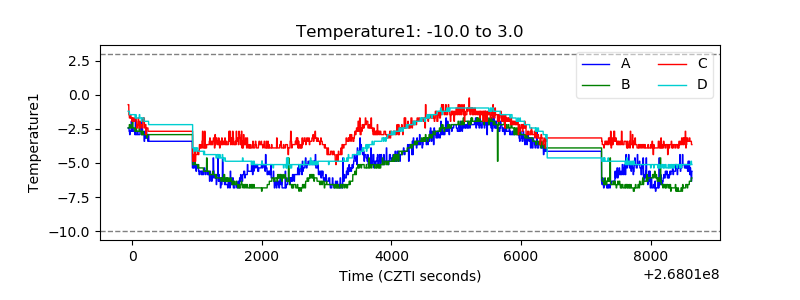 |
| Veto HV Monitor | 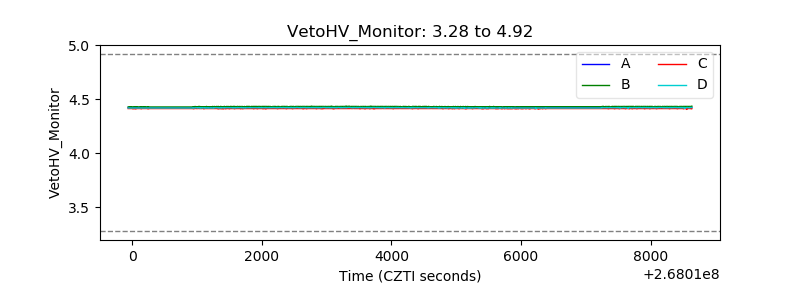 |
| Veto LLD | 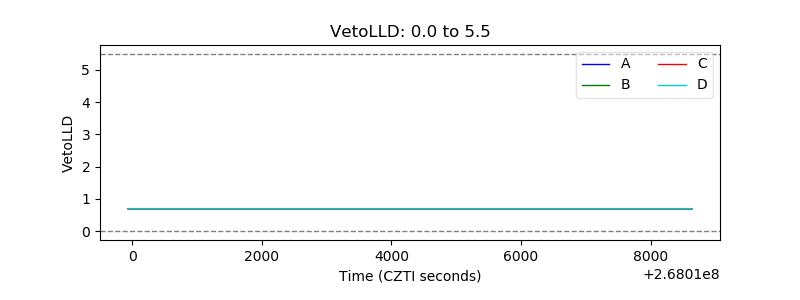 |
| Alpha Counter | 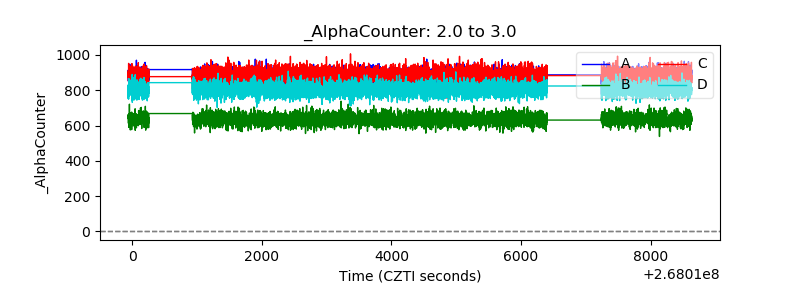 |
| _CPM_Rate | 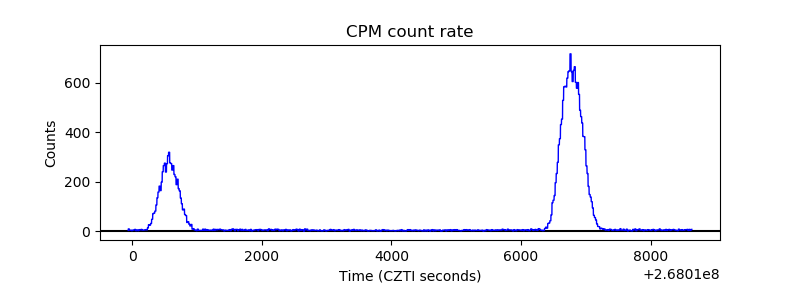 |
| CZT Counter | 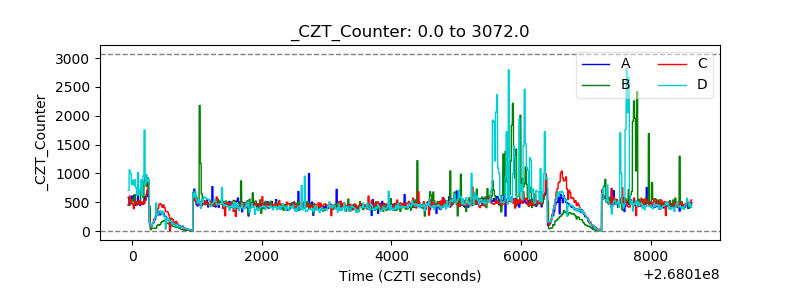 |
| +2.5 Volts monitor |  |
| +5 Volts monitor |  |
| _ROLL_ROT | 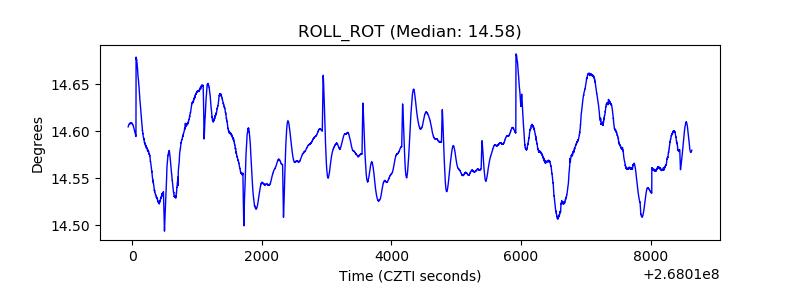 |
| _Roll_DEC | 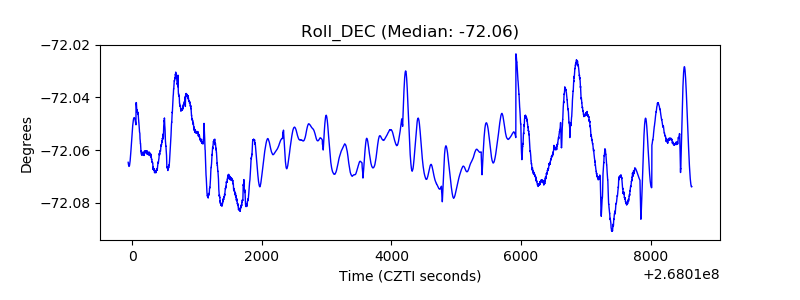 |
| _Roll_RA | 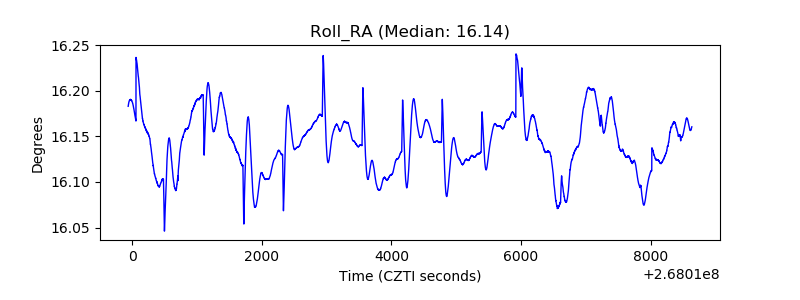 |
| Veto Counter | 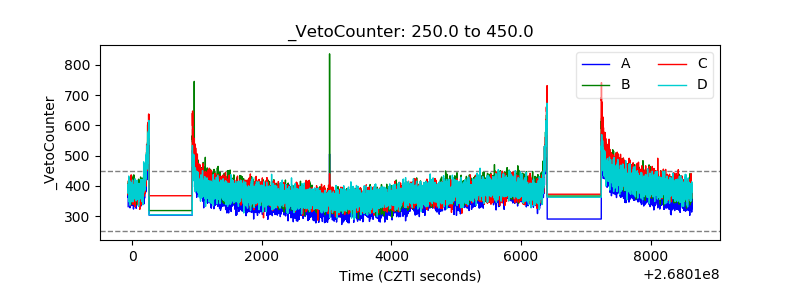 |