| Param | Original file | Final file |
|---|---|---|
| Filename | modeM0/AS1T02_054T01_9000002200_14889cztM0_level2.evt | modeM0/AS1T02_054T01_9000002200_14889cztM0_level2_quad_clean.evt |
| Size (bytes) | 490,138,560 | 110,954,880 |
| Size | 467.4 MB | 105.8 MB |
| Events in quadrant A | 3,075,612 | 731,083 |
| Events in quadrant B | 3,813,057 | 718,679 |
| Events in quadrant C | 3,239,227 | 734,266 |
| Events in quadrant D | 4,260,793 | 709,255 |
| Mode SS | |||
|---|---|---|---|
| Quadrant | BADHDUFLAG | Total packets | Discarded packets |
| A | 0 | 140 | 0 |
| B | 0 | 140 | 0 |
| C | 0 | 140 | 0 |
| D | 0 | 140 | 0 |
| Mode M9 | |||
|---|---|---|---|
| Quadrant | BADHDUFLAG | Total packets | Discarded packets |
| A | 0 | 18 | 0 |
| B | 0 | 18 | 0 |
| C | 0 | 18 | 0 |
| D | 0 | 18 | 0 |
| Mode M0 | |||
|---|---|---|---|
| Quadrant | BADHDUFLAG | Total packets | Discarded packets |
| A | 0 | 13568 | 0 |
| B | 0 | 15614 | 0 |
| C | 0 | 13692 | 0 |
| D | 0 | 17297 | 0 |
| Quadrant | Total seconds | Saturated seconds | Saturation percentage |
|---|---|---|---|
| A | 6695 | 29 | 0.433159% |
| B | 6696 | 238 | 3.554361% |
| C | 6696 | 43 | 0.642174% |
| D | 6696 | 189 | 2.822581% |
Noise dominated data is calculated using 1-second bins in cleaned event files. If a bin has >2000 counts, and if more than 50% of those come from <1% of pixels, then it is considered to be noise-dominated and hence unusable.
| Quadrant | # 1 sec bins | Bins with >0 counts | Bins with >2000 counts | High rate bins dominated by noise | Noise dominated (total time) | Noise dominated (detector-on time) | Marked lightcurve |
|---|---|---|---|---|---|---|---|
| A | 8545 | 6697 | 0 | 0 | 0.00% | 0.00% | 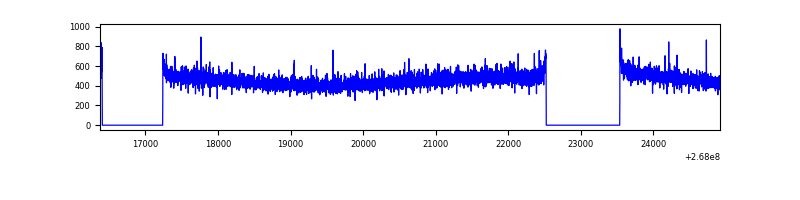 |
| B | 8546 | 6698 | 144 | 144 | 1.68% | 2.15% | 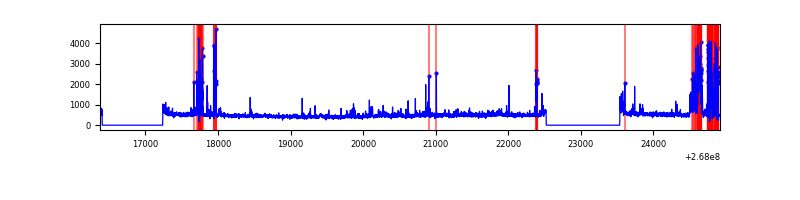 |
| C | 8546 | 6698 | 0 | 0 | 0.00% | 0.00% | 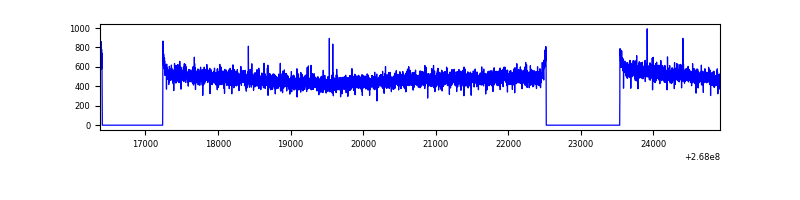 |
| D | 8546 | 6698 | 109 | 109 | 1.28% | 1.63% | 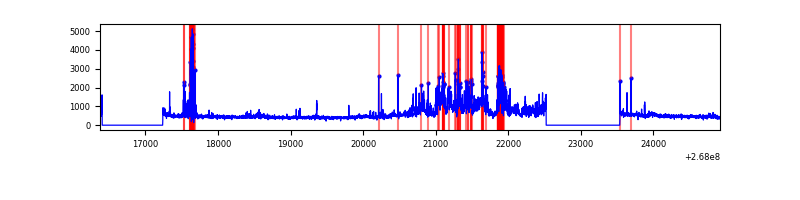 |
Top three noisy pixels from each quadrant. If the there are fewer than three noisy pixels in the level2.evt file, extra rows are filled as -1
| Pixel properties | Quadrant properties | ||||||
|---|---|---|---|---|---|---|---|
| Quadrant | DetID | PixID | Counts | Sigma | Mean | Median | Sigma |
| A | 12 | 189 | 13430 | 78.27 | 793 | 773 | 161.7 |
| A | 3 | 1 | 13320 | 77.59 | 793 | 773 | 161.7 |
| A | 0 | 226 | 7069 | 38.93 | 793 | 773 | 161.7 |
| B | 3 | 64 | 583844 | 3934.81 | 781 | 759 | 148.2 |
| B | 0 | 189 | 91583 | 612.9 | 781 | 759 | 148.2 |
| B | 10 | 16 | 24145 | 157.81 | 781 | 759 | 148.2 |
| C | 3 | 233 | 171328 | 939.76 | 784 | 789 | 181.5 |
| C | 3 | 232 | 6729 | 32.73 | 784 | 789 | 181.5 |
| C | 13 | 61 | 5583 | 26.42 | 784 | 789 | 181.5 |
| D | 7 | 254 | 1141890 | 6233.77 | 771 | 753 | 183.1 |
| D | 13 | 104 | 152687 | 829.98 | 771 | 753 | 183.1 |
| D | 2 | 120 | 26167 | 138.83 | 771 | 753 | 183.1 |
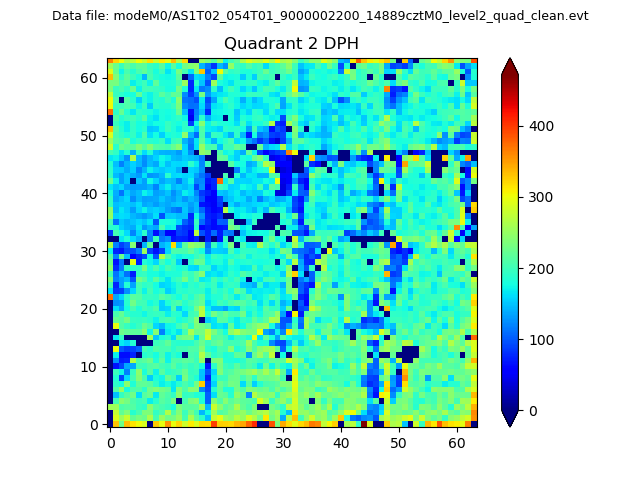
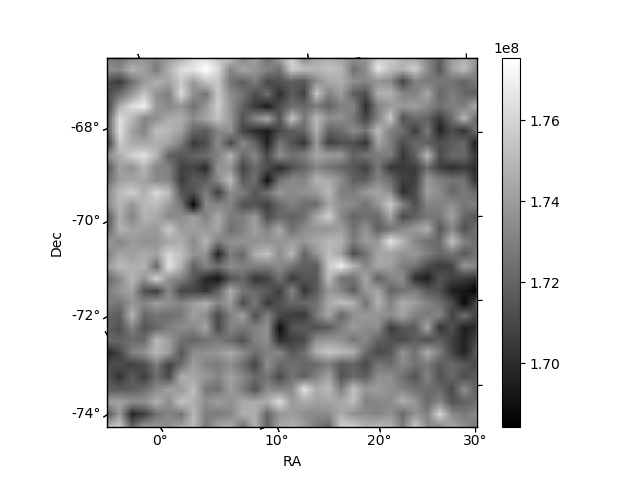
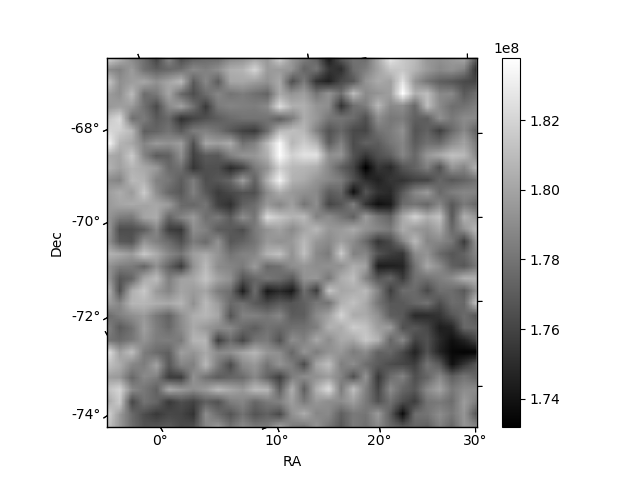
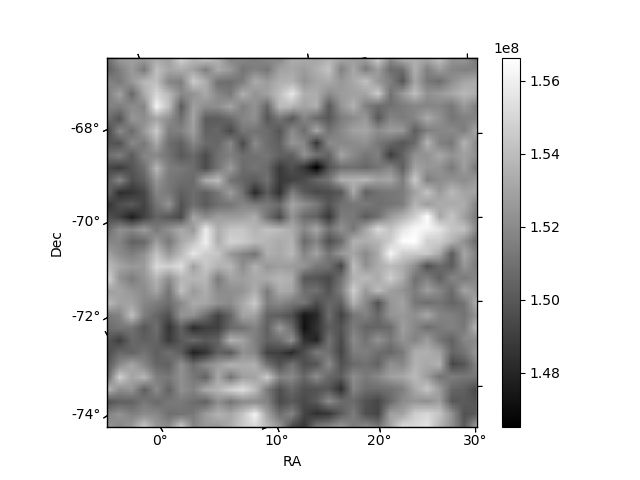
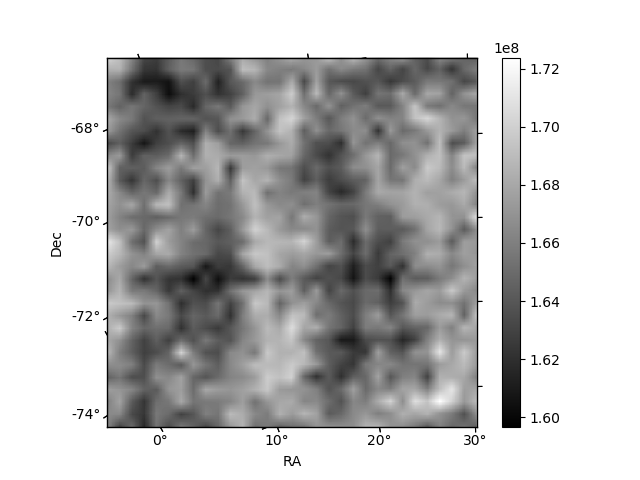
Histogram calculated using DETX and DETY for each event in the final _common_clean file
| Quadrant A | 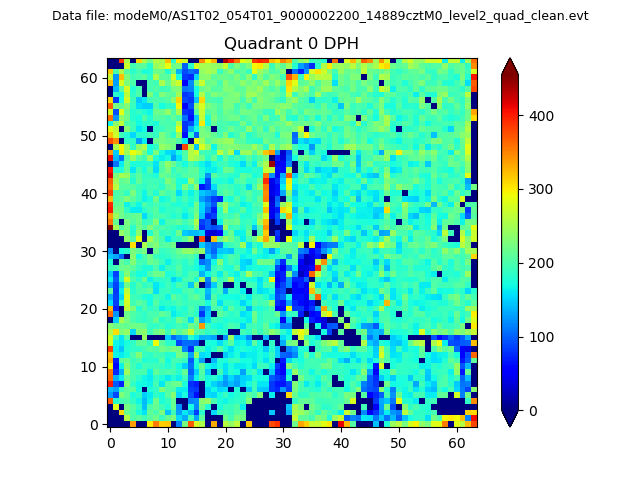 |
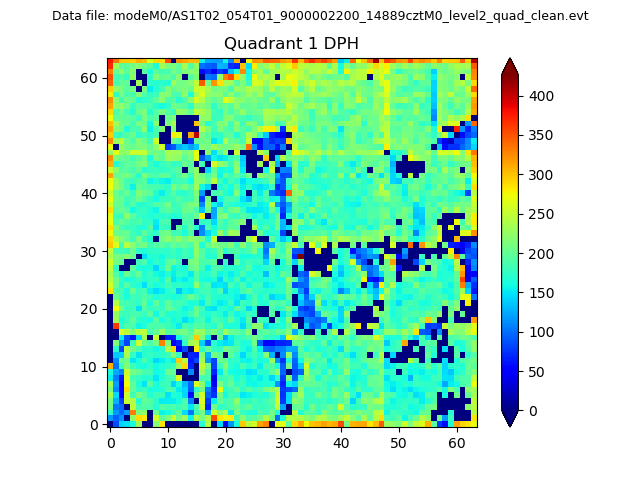 |
Quadrant B |
|---|---|---|---|
| Quadrant D | 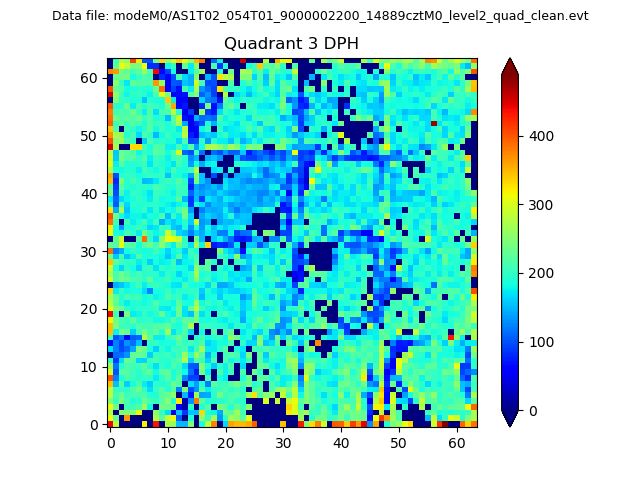 |
 |
Quadrant C |
| Plot type | Count rate plots | Images |
|---|---|---|
| Comparison with Poisson distribution Blue bars denote a histogram of data divided into 1 sec bins. Red curve is a Poisson curve with rate = median count rate of data. |
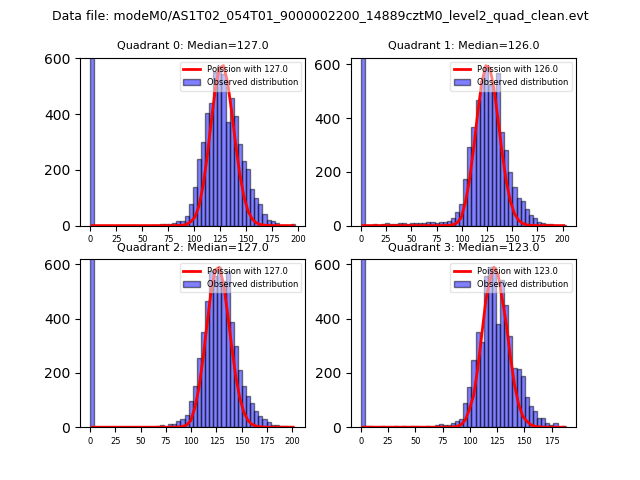 |
 |
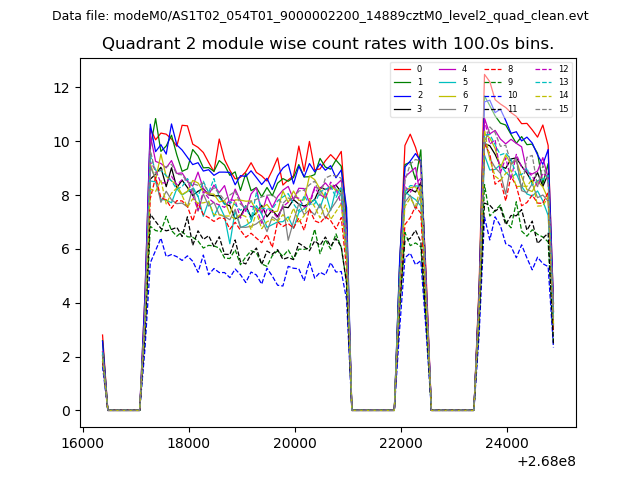
| Quadrant-wise count rates Data is divided into 100 sec bins |
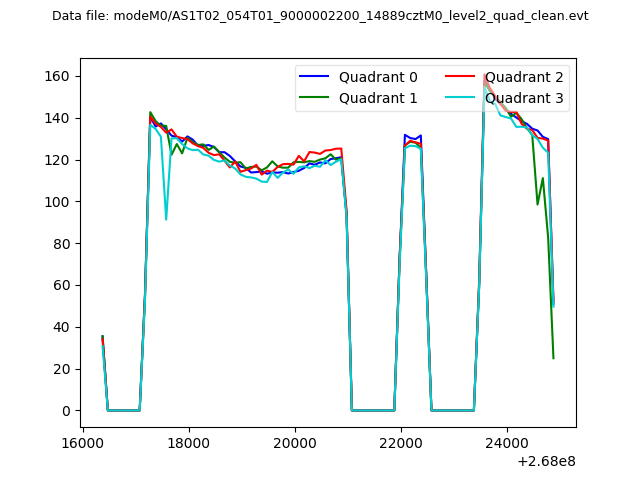 |
|
| Module-wise count rates for Quadrant A Data is divided into 100 sec bins |
 |
 |
| Module-wise count rates for Quadrant B Data is divided into 100 sec bins |
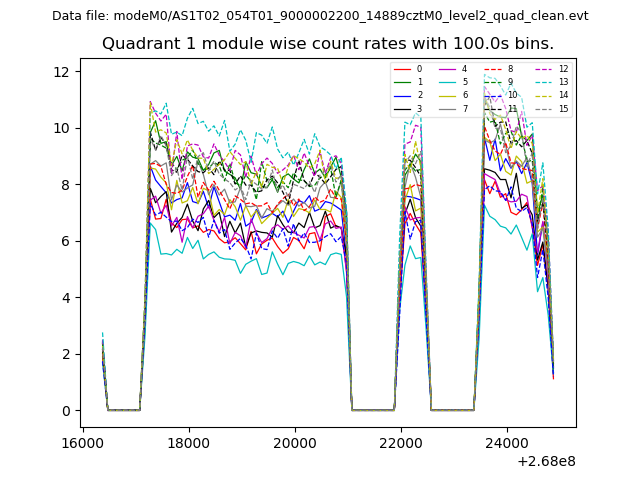 |
 |
| Module-wise count rates for Quadrant C Data is divided into 100 sec bins |
 |
 |
| Module-wise count rates for Quadrant D Data is divided into 100 sec bins |
 |
 |
| Parameter | Plot |
|---|---|
| CZT HV Monitor | 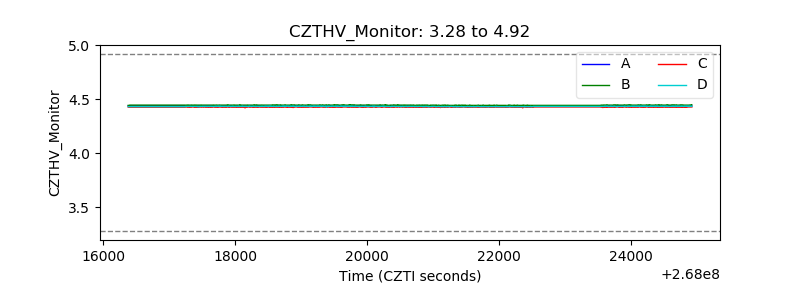 |
| D_VDD | 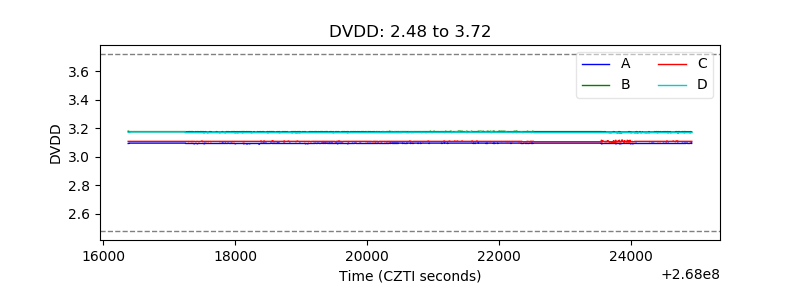 |
| Temperature 1 | 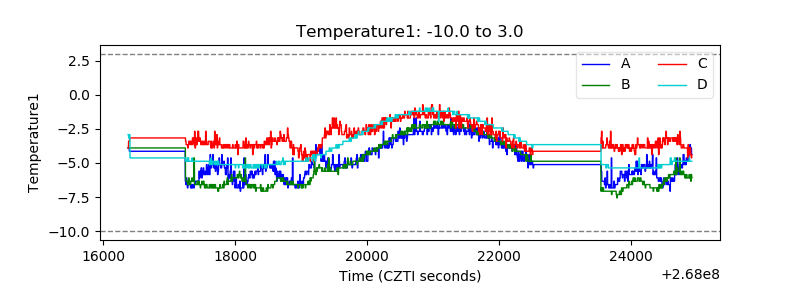 |
| Veto HV Monitor | 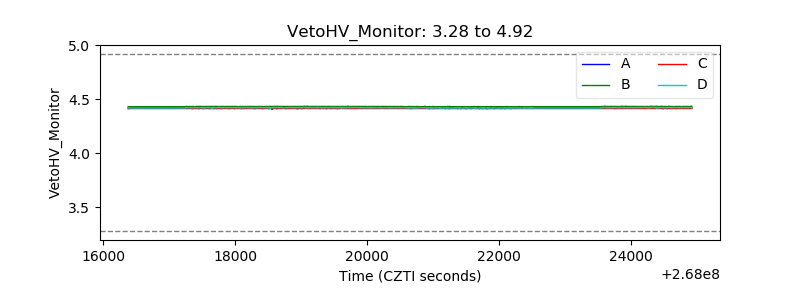 |
| Veto LLD | 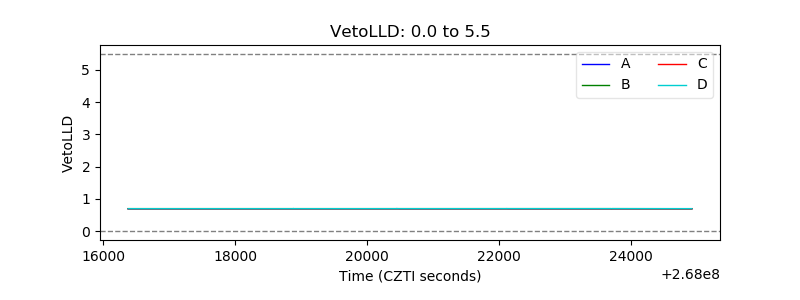 |
| Alpha Counter | 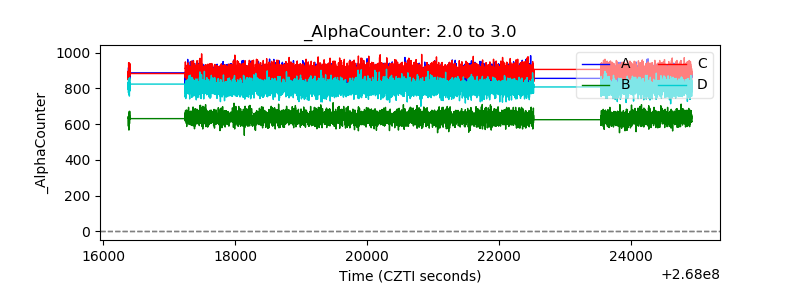 |
| _CPM_Rate | 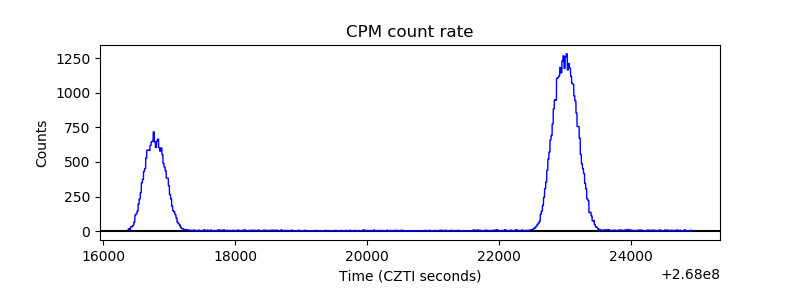 |
| CZT Counter | 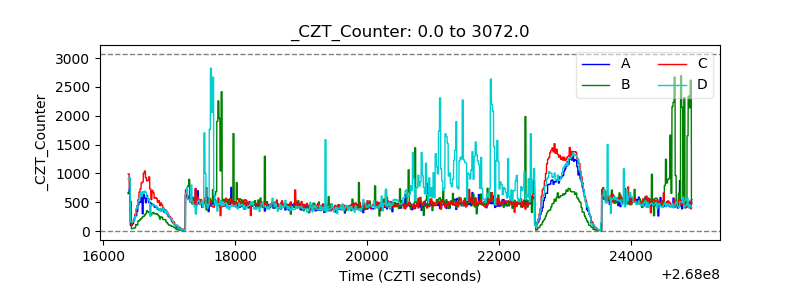 |
| +2.5 Volts monitor | 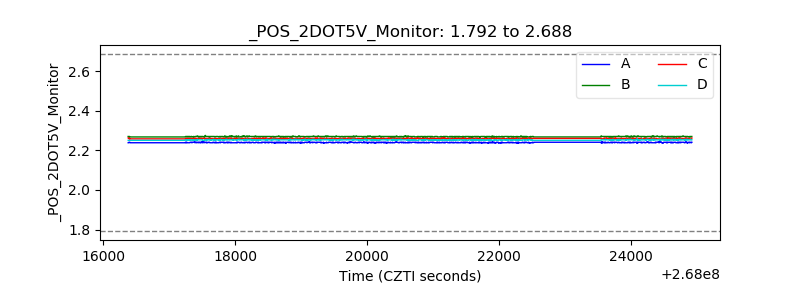 |
| +5 Volts monitor |  |
| _ROLL_ROT |  |
| _Roll_DEC | 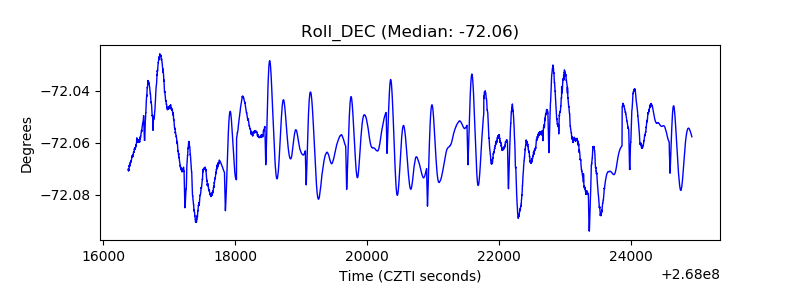 |
| _Roll_RA |  |
| Veto Counter |  |