| Param | Original file | Final file |
|---|---|---|
| Filename | modeM0/AS1T02_054T01_9000002200_14890cztM0_level2.evt | modeM0/AS1T02_054T01_9000002200_14890cztM0_level2_quad_clean.evt |
| Size (bytes) | 566,760,960 | 110,666,880 |
| Size | 540.5 MB | 105.5 MB |
| Events in quadrant A | 3,041,752 | 738,731 |
| Events in quadrant B | 3,786,970 | 729,193 |
| Events in quadrant C | 3,210,125 | 748,631 |
| Events in quadrant D | 6,687,727 | 684,824 |
| Mode SS | |||
|---|---|---|---|
| Quadrant | BADHDUFLAG | Total packets | Discarded packets |
| A | 0 | 130 | 0 |
| B | 0 | 130 | 0 |
| C | 0 | 130 | 0 |
| D | 0 | 130 | 0 |
| Mode M9 | |||
|---|---|---|---|
| Quadrant | BADHDUFLAG | Total packets | Discarded packets |
| A | 0 | 17 | 0 |
| B | 0 | 18 | 0 |
| C | 0 | 18 | 0 |
| D | 0 | 18 | 0 |
| Mode M0 | |||
|---|---|---|---|
| Quadrant | BADHDUFLAG | Total packets | Discarded packets |
| A | 0 | 13194 | 0 |
| B | 0 | 15296 | 0 |
| C | 0 | 13520 | 0 |
| D | 0 | 24258 | 0 |
| Quadrant | Total seconds | Saturated seconds | Saturation percentage |
|---|---|---|---|
| A | 6455 | 5 | 0.077459% |
| B | 6455 | 199 | 3.082881% |
| C | 6455 | 13 | 0.201394% |
| D | 6455 | 1449 | 22.447715% |
Noise dominated data is calculated using 1-second bins in cleaned event files. If a bin has >2000 counts, and if more than 50% of those come from <1% of pixels, then it is considered to be noise-dominated and hence unusable.
| Quadrant | # 1 sec bins | Bins with >0 counts | Bins with >2000 counts | High rate bins dominated by noise | Noise dominated (total time) | Noise dominated (detector-on time) | Marked lightcurve |
|---|---|---|---|---|---|---|---|
| A | 7620 | 6456 | 0 | 0 | 0.00% | 0.00% | 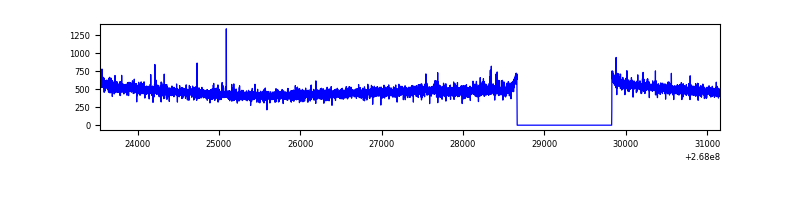 |
| B | 7620 | 6456 | 140 | 140 | 1.84% | 2.17% | 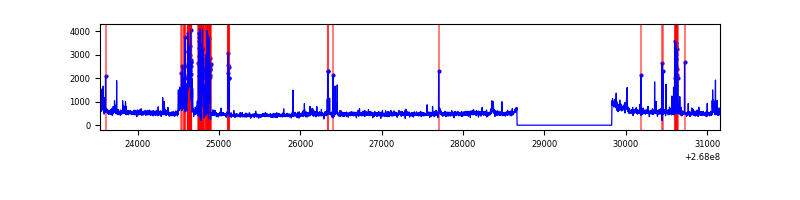 |
| C | 7620 | 6456 | 0 | 0 | 0.00% | 0.00% | 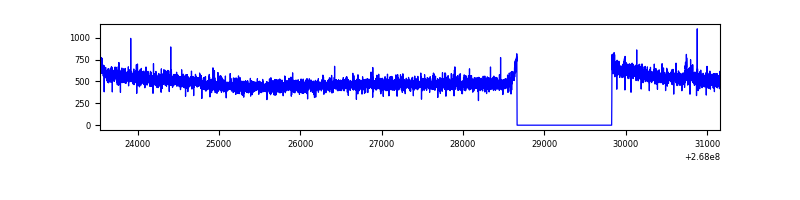 |
| D | 7620 | 6456 | 1270 | 1270 | 16.67% | 19.67% | 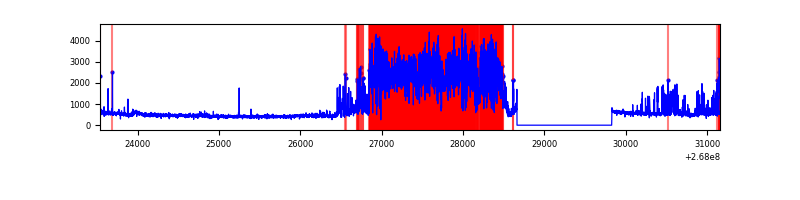 |
Top three noisy pixels from each quadrant. If the there are fewer than three noisy pixels in the level2.evt file, extra rows are filled as -1
| Pixel properties | Quadrant properties | ||||||
|---|---|---|---|---|---|---|---|
| Quadrant | DetID | PixID | Counts | Sigma | Mean | Median | Sigma |
| A | 11 | 29 | 10270 | 60.06 | 784 | 767 | 158.2 |
| A | 3 | 1 | 9245 | 53.59 | 784 | 767 | 158.2 |
| A | 12 | 189 | 7358 | 41.66 | 784 | 767 | 158.2 |
| B | 3 | 64 | 636786 | 4386.96 | 770 | 750 | 145.0 |
| B | 0 | 189 | 31807 | 214.21 | 770 | 750 | 145.0 |
| B | 10 | 246 | 31281 | 210.58 | 770 | 750 | 145.0 |
| C | 3 | 233 | 161977 | 904.28 | 777 | 780 | 178.3 |
| C | 0 | 207 | 14742 | 78.32 | 777 | 780 | 178.3 |
| C | 13 | 61 | 5443 | 26.16 | 777 | 780 | 178.3 |
| D | 7 | 254 | 3913336 | 23467.69 | 704 | 688 | 166.7 |
| D | 13 | 104 | 87123 | 518.43 | 704 | 688 | 166.7 |
| D | 2 | 234 | 21611 | 125.49 | 704 | 688 | 166.7 |
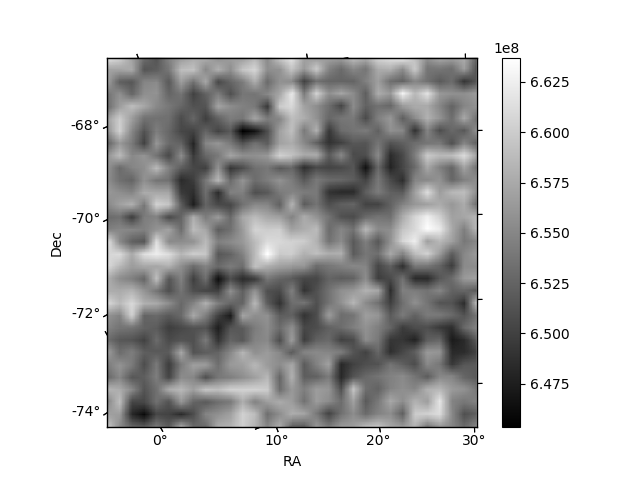
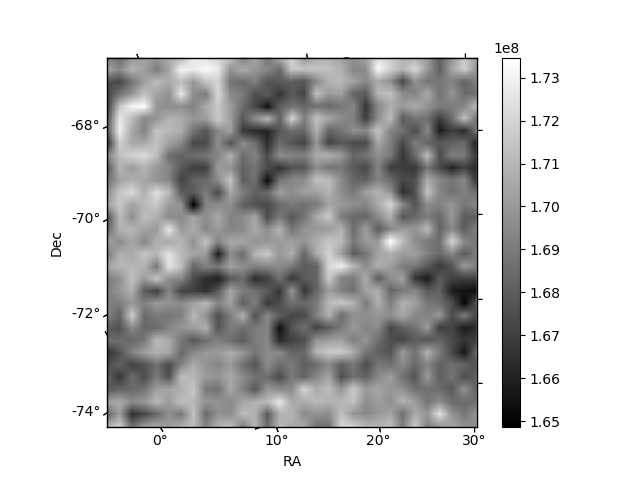
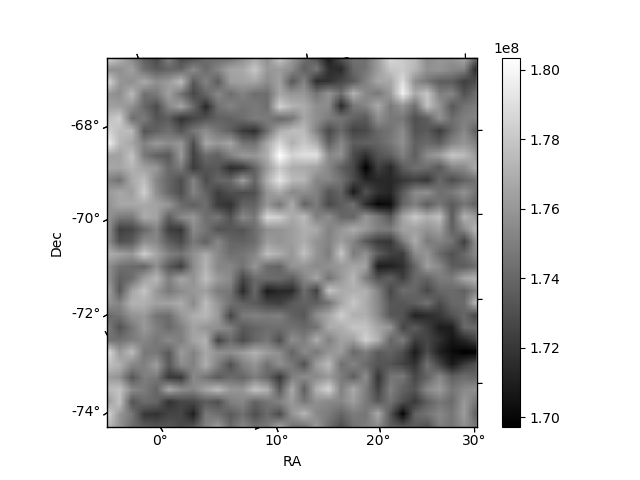
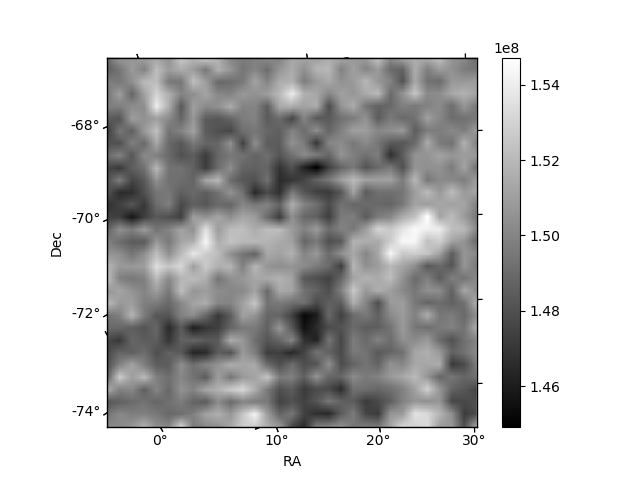
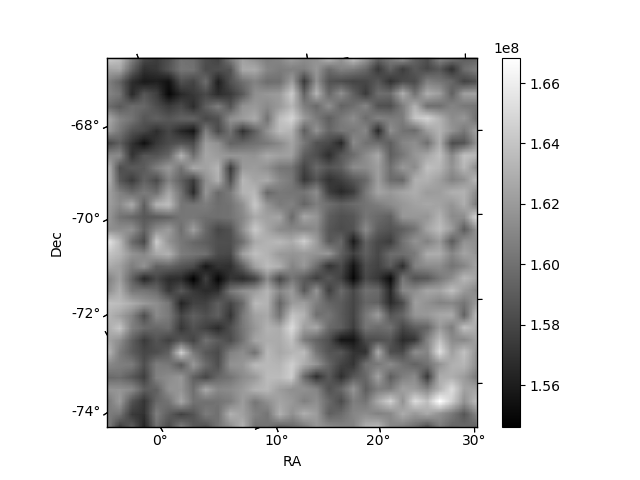
Histogram calculated using DETX and DETY for each event in the final _common_clean file
| Quadrant A | 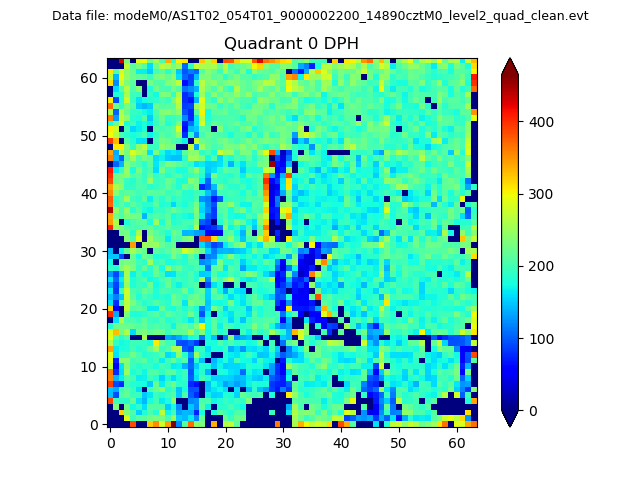 |
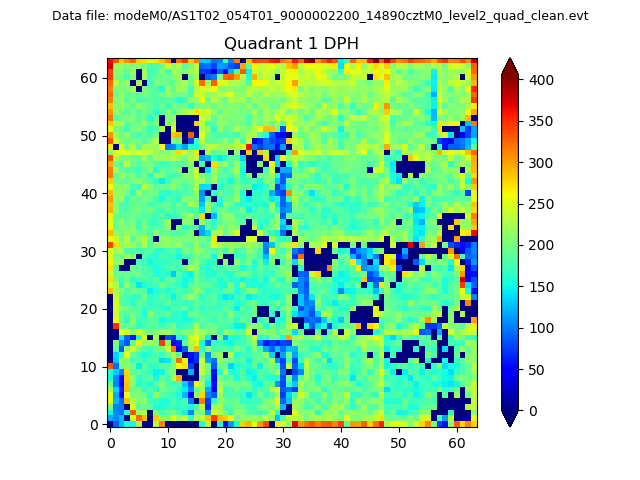 |
Quadrant B |
|---|---|---|---|
| Quadrant D | 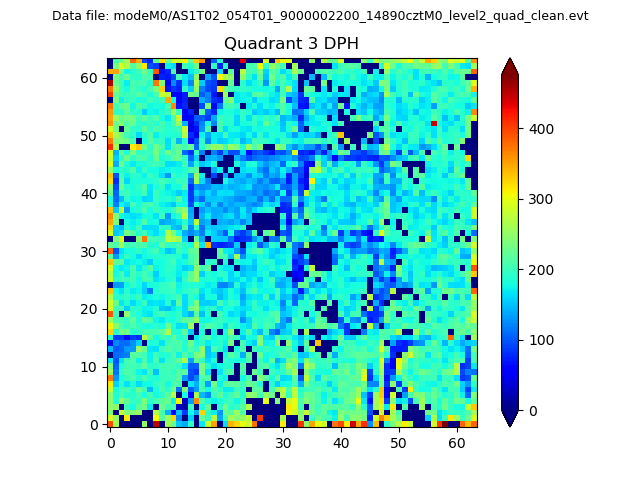 |
 |
Quadrant C |
| Plot type | Count rate plots | Images |
|---|---|---|
| Comparison with Poisson distribution Blue bars denote a histogram of data divided into 1 sec bins. Red curve is a Poisson curve with rate = median count rate of data. |
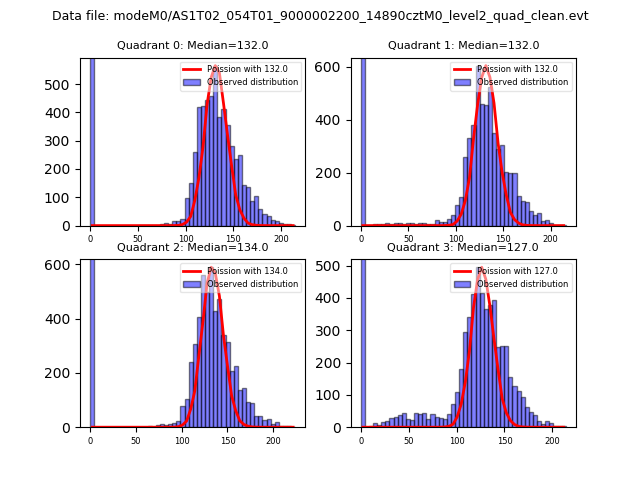 |
 |
| Quadrant-wise count rates Data is divided into 100 sec bins |
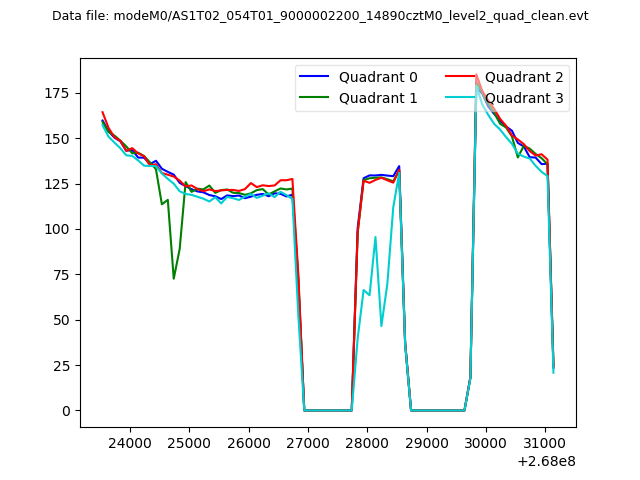 |
|
| Module-wise count rates for Quadrant A Data is divided into 100 sec bins |
 |
 |
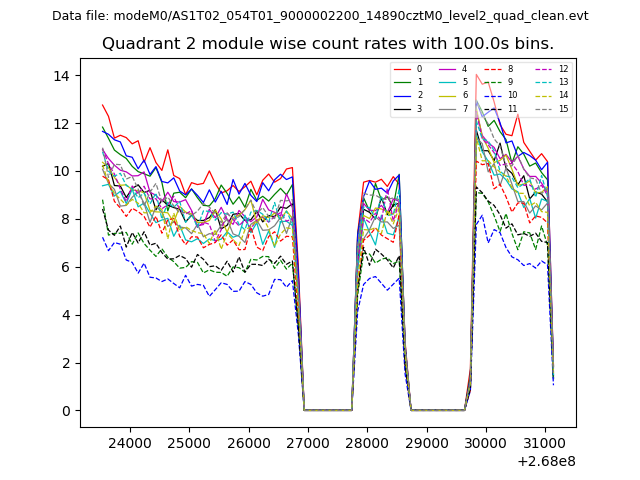
| Module-wise count rates for Quadrant B Data is divided into 100 sec bins |
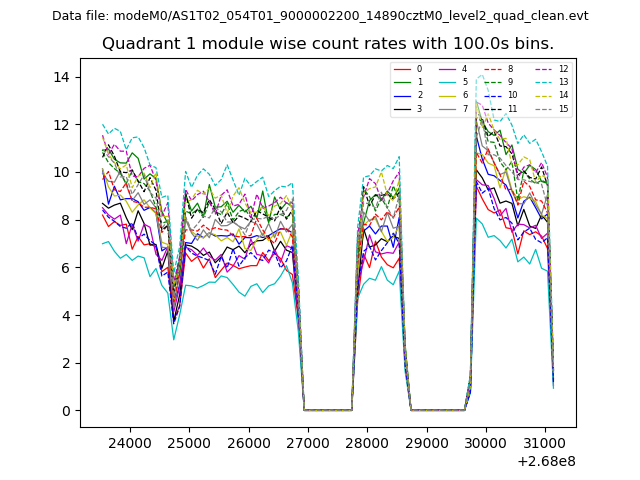 |
 |
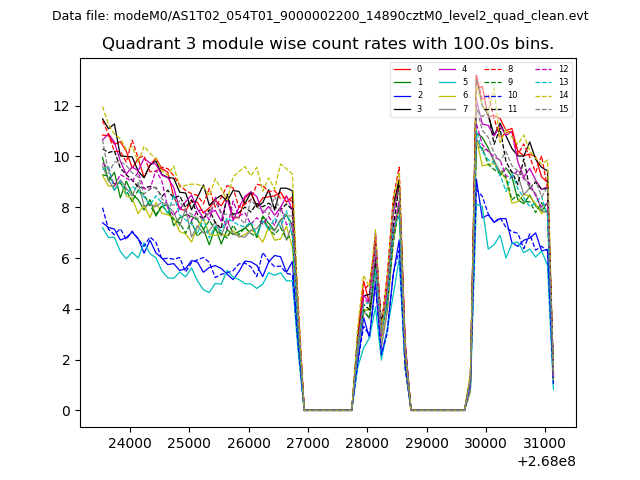
| Module-wise count rates for Quadrant C Data is divided into 100 sec bins |
 |
 |
| Module-wise count rates for Quadrant D Data is divided into 100 sec bins |
 |
 |
| Parameter | Plot |
|---|---|
| CZT HV Monitor | 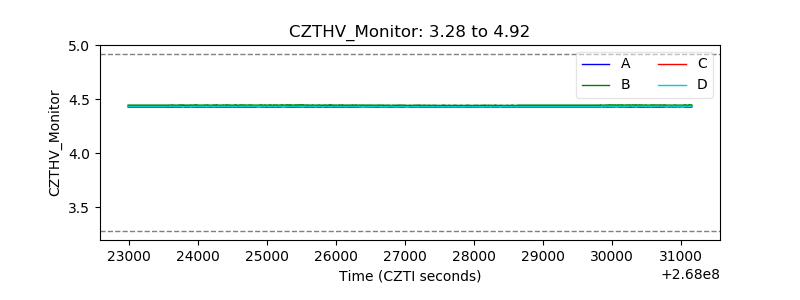 |
| D_VDD | 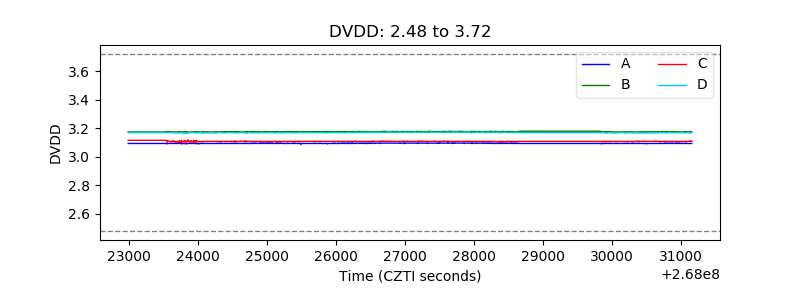 |
| Temperature 1 | 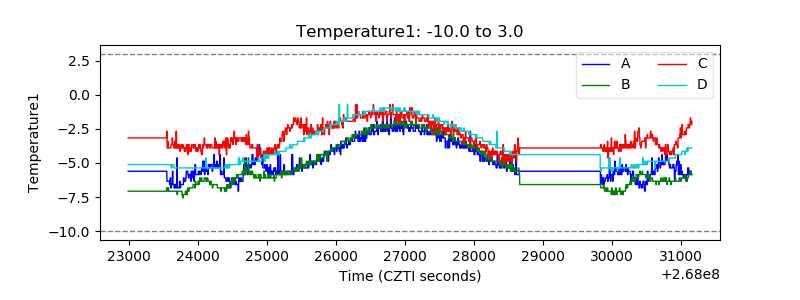 |
| Veto HV Monitor | 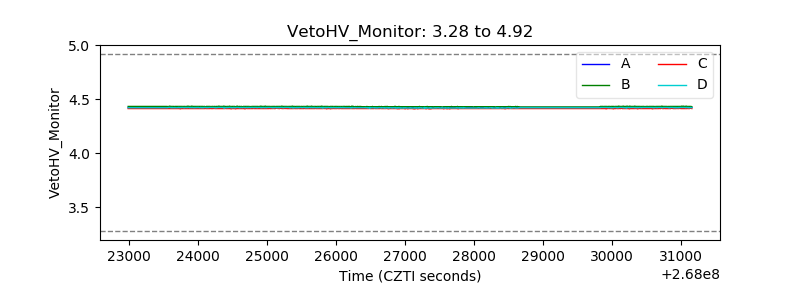 |
| Veto LLD | 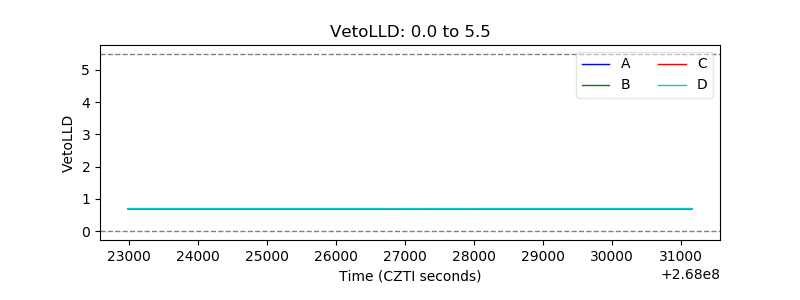 |
| Alpha Counter | 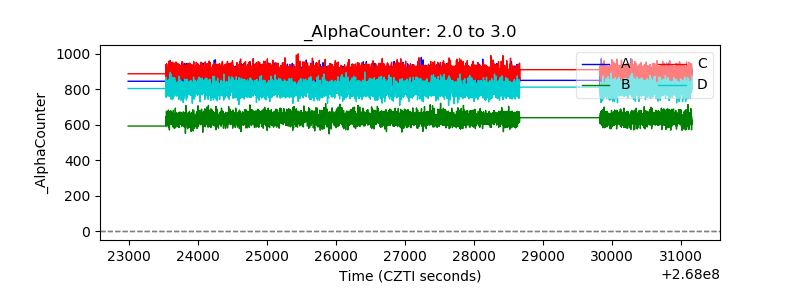 |
| _CPM_Rate | 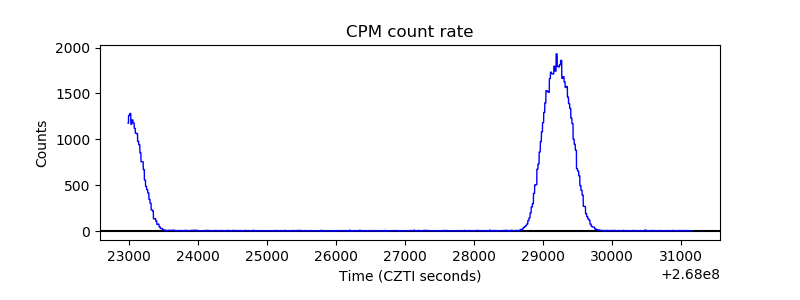 |
| CZT Counter |  |
| +2.5 Volts monitor |  |
| +5 Volts monitor |  |
| _ROLL_ROT | 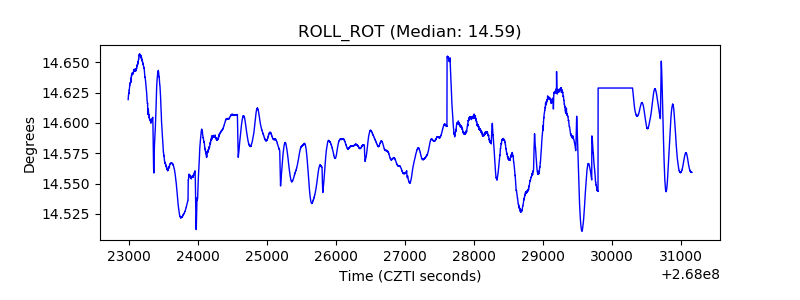 |
| _Roll_DEC | 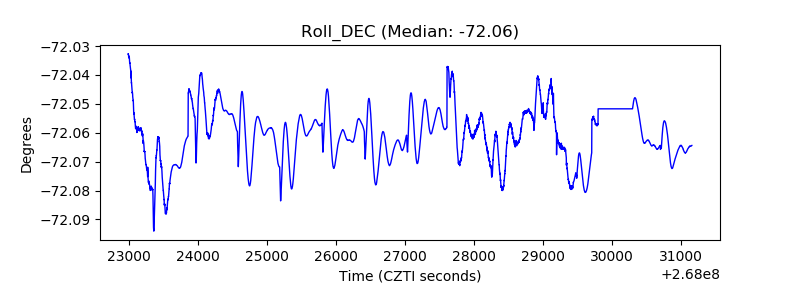 |
| _Roll_RA | 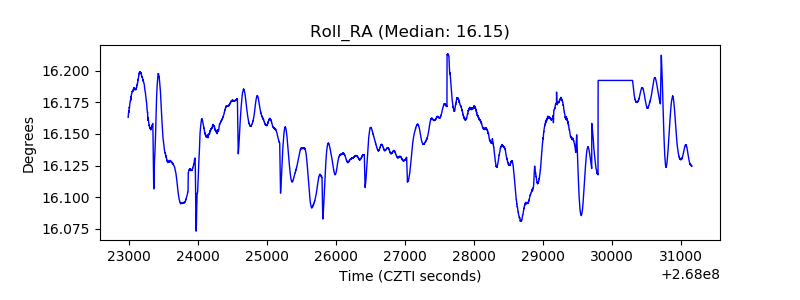 |
| Veto Counter | 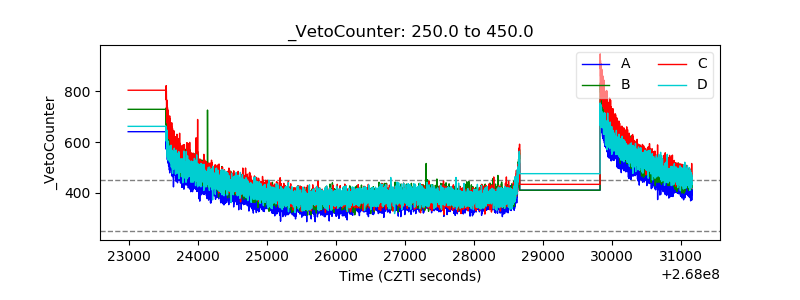 |