| Param | Original file | Final file |
|---|---|---|
| Filename | modeM0/AS1T02_054T01_9000002200_14892cztM0_level2.evt | modeM0/AS1T02_054T01_9000002200_14892cztM0_level2_quad_clean.evt |
| Size (bytes) | 603,429,120 | 102,093,120 |
| Size | 575.5 MB | 97.4 MB |
| Events in quadrant A | 2,890,418 | 697,372 |
| Events in quadrant B | 3,634,624 | 685,336 |
| Events in quadrant C | 2,979,706 | 707,180 |
| Events in quadrant D | 8,372,790 | 591,404 |
| Mode SS | |||
|---|---|---|---|
| Quadrant | BADHDUFLAG | Total packets | Discarded packets |
| A | 0 | 118 | 0 |
| B | 0 | 118 | 0 |
| C | 0 | 118 | 0 |
| D | 0 | 118 | 0 |
| Mode M9 | |||
|---|---|---|---|
| Quadrant | BADHDUFLAG | Total packets | Discarded packets |
| A | 0 | 12 | 0 |
| B | 0 | 12 | 0 |
| C | 0 | 12 | 0 |
| D | 0 | 12 | 0 |
| Mode M0 | |||
|---|---|---|---|
| Quadrant | BADHDUFLAG | Total packets | Discarded packets |
| A | 0 | 12303 | 0 |
| B | 0 | 14468 | 0 |
| C | 0 | 12440 | 0 |
| D | 0 | 28718 | 0 |
| Quadrant | Total seconds | Saturated seconds | Saturation percentage |
|---|---|---|---|
| A | 5870 | 47 | 0.800681% |
| B | 5871 | 255 | 4.343383% |
| C | 5871 | 52 | 0.885709% |
| D | 5871 | 1869 | 31.834440% |
Noise dominated data is calculated using 1-second bins in cleaned event files. If a bin has >2000 counts, and if more than 50% of those come from <1% of pixels, then it is considered to be noise-dominated and hence unusable.
| Quadrant | # 1 sec bins | Bins with >0 counts | Bins with >2000 counts | High rate bins dominated by noise | Noise dominated (total time) | Noise dominated (detector-on time) | Marked lightcurve |
|---|---|---|---|---|---|---|---|
| A | 7075 | 5871 | 7 | 7 | 0.10% | 0.12% | 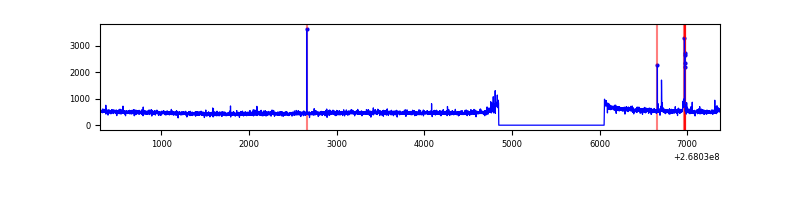 |
| B | 7076 | 5872 | 164 | 164 | 2.32% | 2.79% | 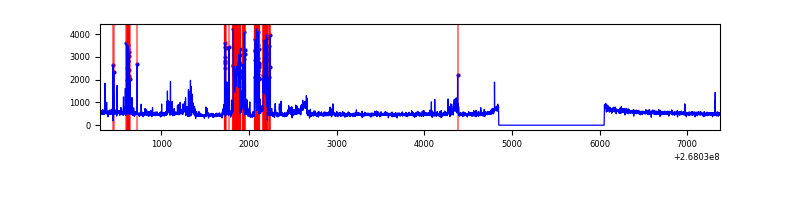 |
| C | 7076 | 5872 | 0 | 0 | 0.00% | 0.00% | 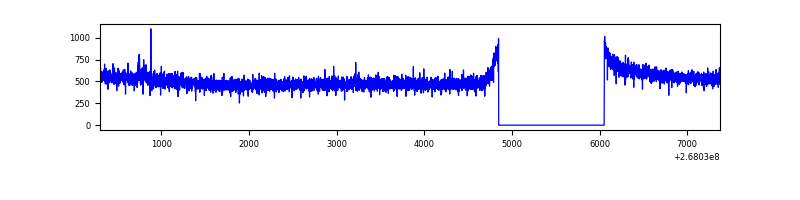 |
| D | 7076 | 5872 | 1675 | 1675 | 23.67% | 28.53% | 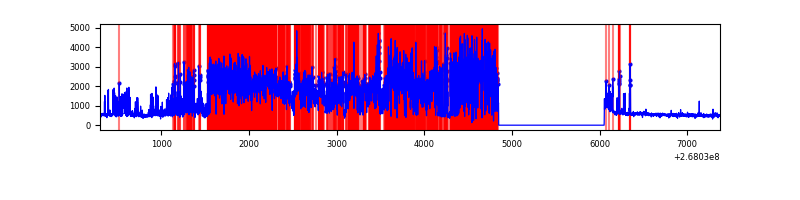 |
Top three noisy pixels from each quadrant. If the there are fewer than three noisy pixels in the level2.evt file, extra rows are filled as -1
| Pixel properties | Quadrant properties | ||||||
|---|---|---|---|---|---|---|---|
| Quadrant | DetID | PixID | Counts | Sigma | Mean | Median | Sigma |
| A | 11 | 29 | 21171 | 139.73 | 736 | 720 | 146.4 |
| A | 9 | 143 | 15656 | 102.05 | 736 | 720 | 146.4 |
| A | 14 | 237 | 12609 | 81.23 | 736 | 720 | 146.4 |
| B | 3 | 64 | 571809 | 4314.77 | 714 | 696 | 132.4 |
| B | 0 | 189 | 154751 | 1163.89 | 714 | 696 | 132.4 |
| B | 10 | 246 | 67617 | 505.59 | 714 | 696 | 132.4 |
| C | 3 | 233 | 136138 | 822.23 | 726 | 730 | 164.7 |
| C | 0 | 207 | 14278 | 82.27 | 726 | 730 | 164.7 |
| C | 13 | 61 | 5056 | 26.27 | 726 | 730 | 164.7 |
| D | 7 | 254 | 5869634 | 38650.03 | 644 | 630 | 151.8 |
| D | 13 | 104 | 36927 | 239.03 | 644 | 630 | 151.8 |
| D | 2 | 234 | 18076 | 114.89 | 644 | 630 | 151.8 |
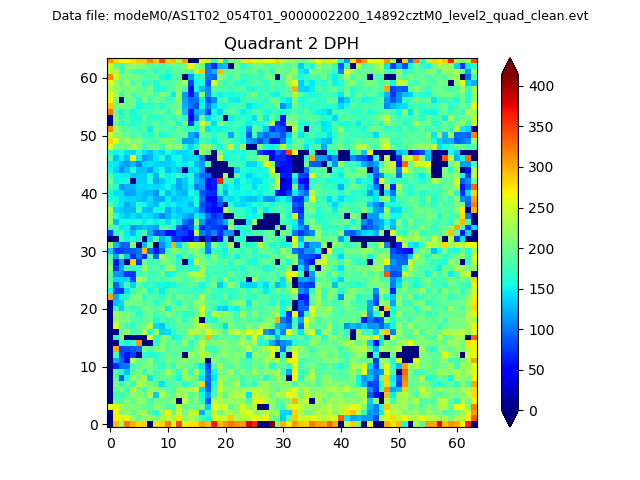
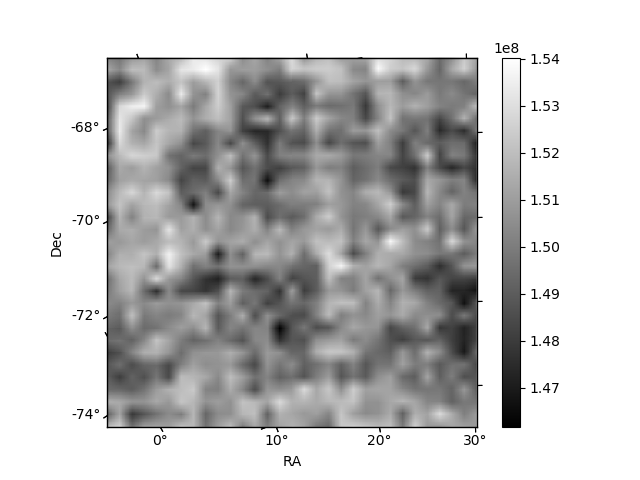
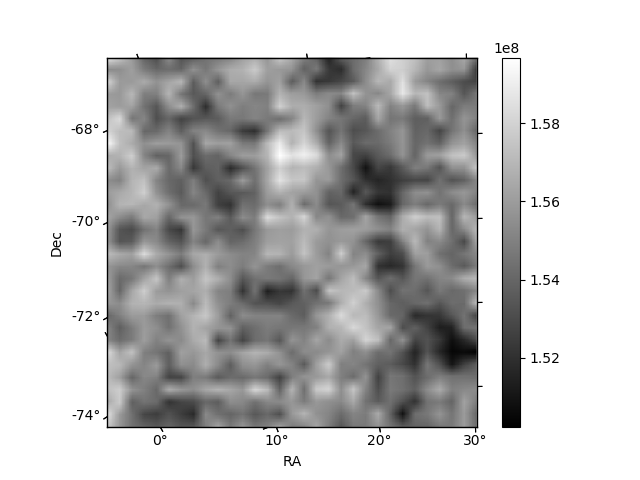
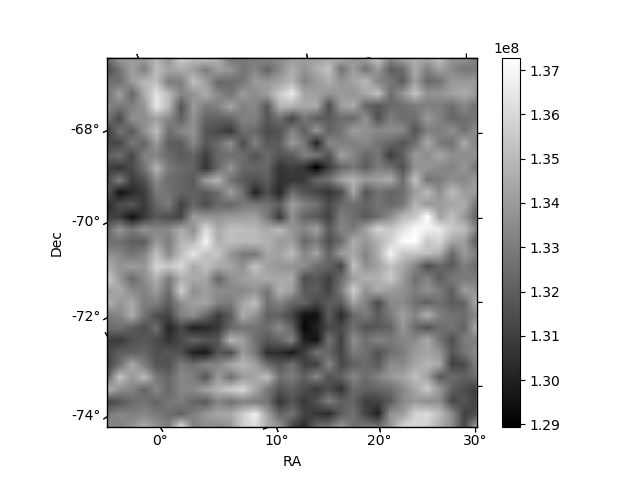
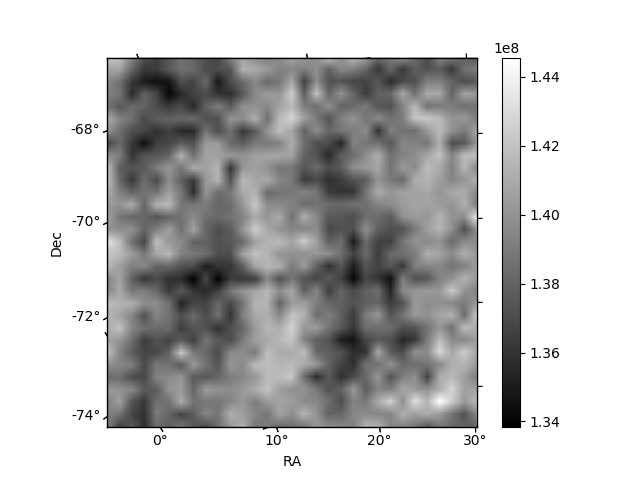
Histogram calculated using DETX and DETY for each event in the final _common_clean file
| Quadrant A | 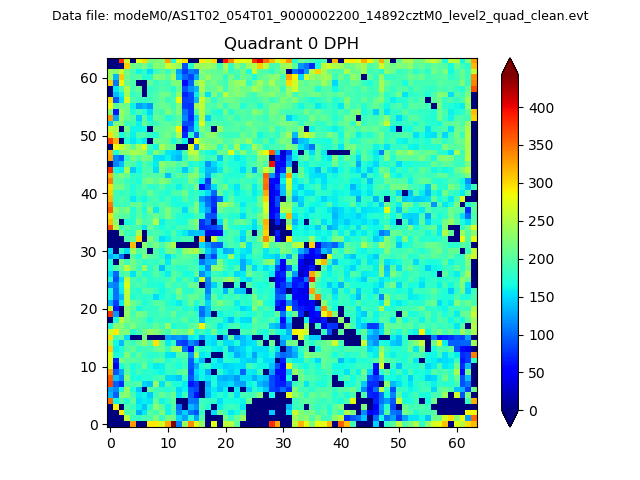 |
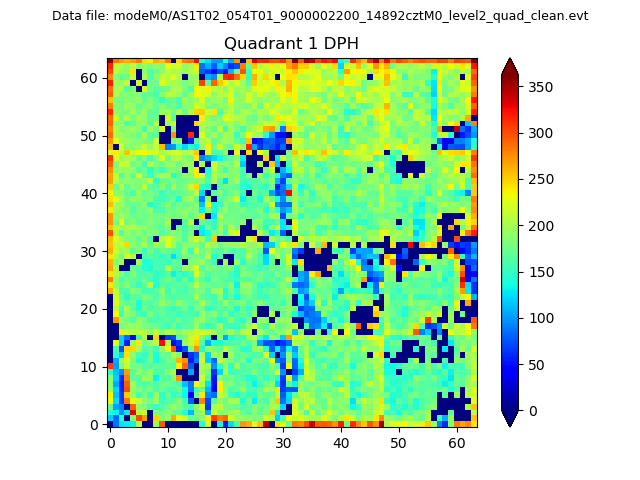 |
Quadrant B |
|---|---|---|---|
| Quadrant D | 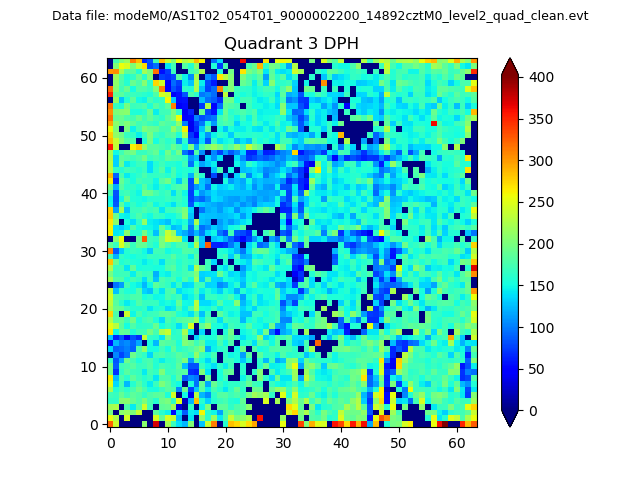 |
 |
Quadrant C |
| Plot type | Count rate plots | Images |
|---|---|---|
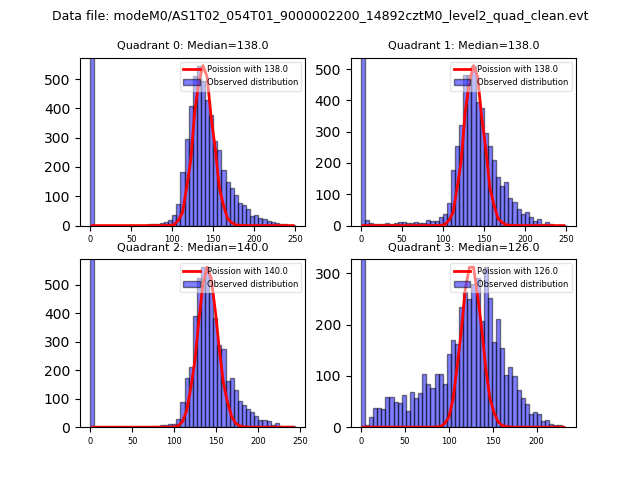
| Comparison with Poisson distribution Blue bars denote a histogram of data divided into 1 sec bins. Red curve is a Poisson curve with rate = median count rate of data. |
 |
 |
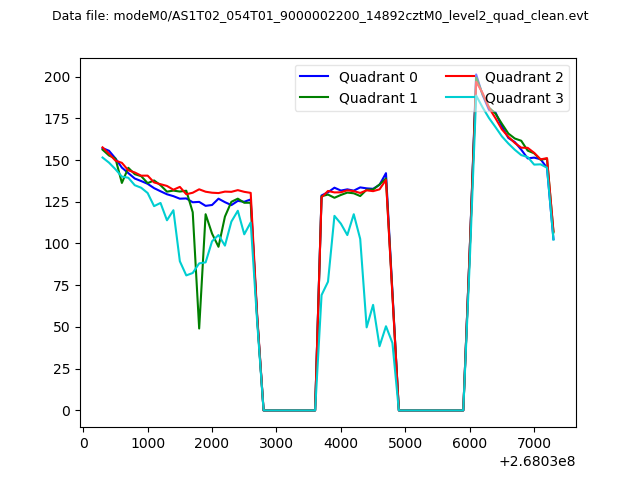
| Quadrant-wise count rates Data is divided into 100 sec bins |
 |
|
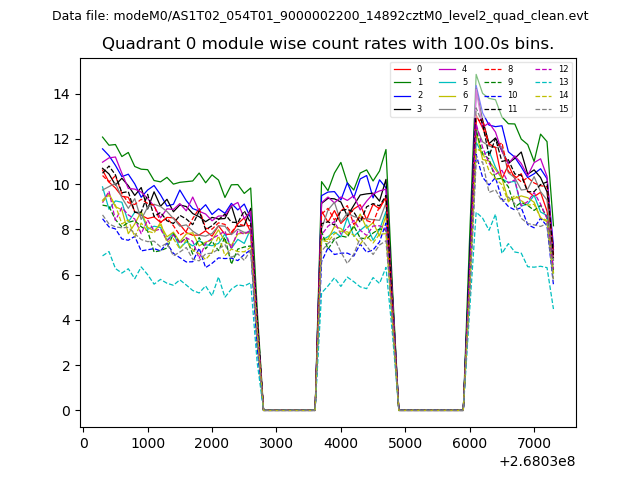
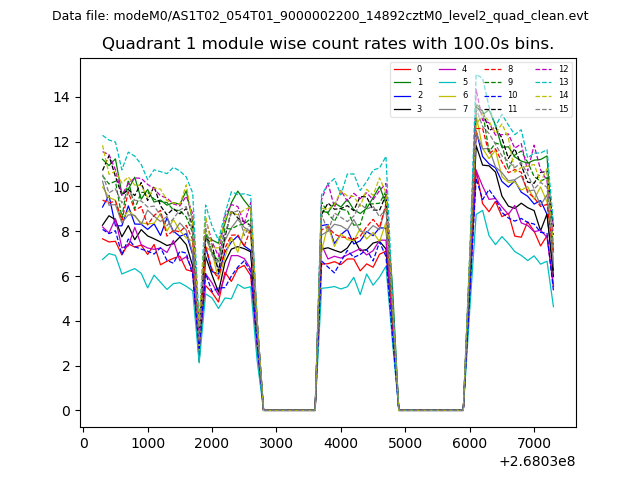
| Module-wise count rates for Quadrant A Data is divided into 100 sec bins |
 |
 |
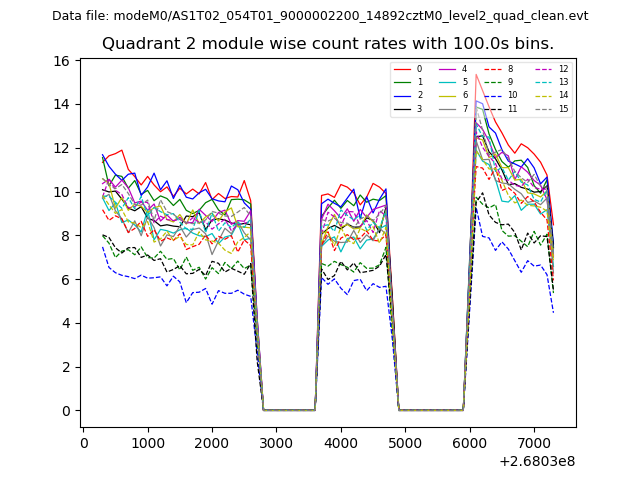
| Module-wise count rates for Quadrant B Data is divided into 100 sec bins |
 |
 |
| Module-wise count rates for Quadrant C Data is divided into 100 sec bins |
 |
 |
| Module-wise count rates for Quadrant D Data is divided into 100 sec bins |
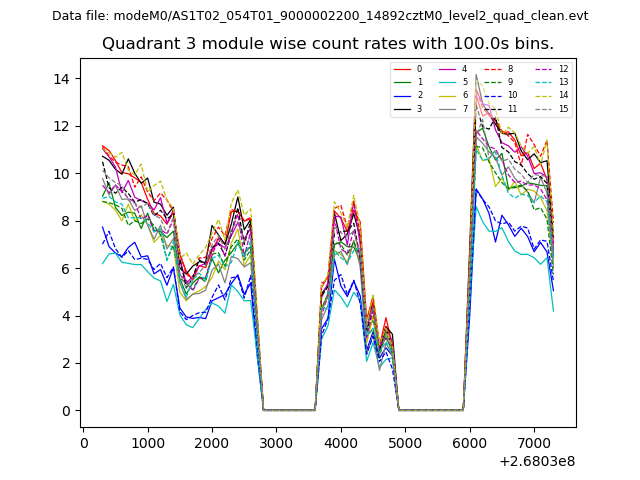 |
 |
| Parameter | Plot |
|---|---|
| CZT HV Monitor | 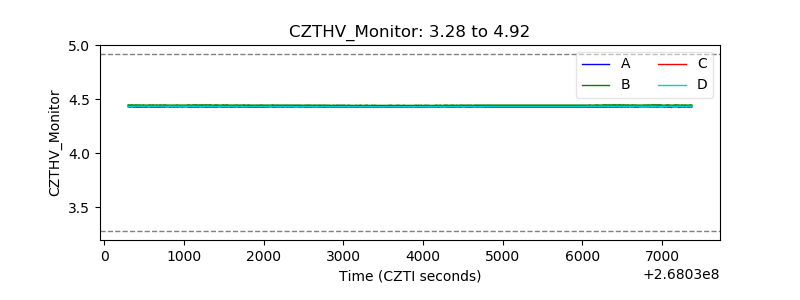 |
| D_VDD | 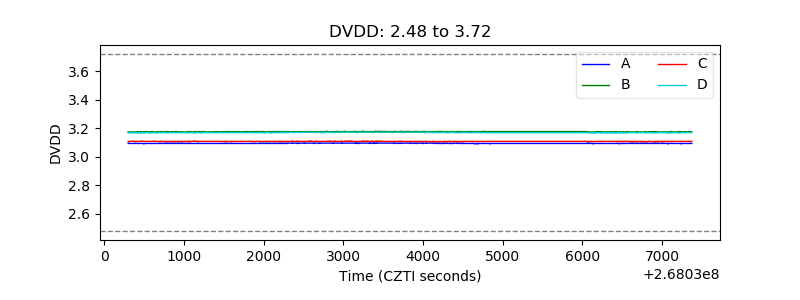 |
| Temperature 1 |  |
| Veto HV Monitor | 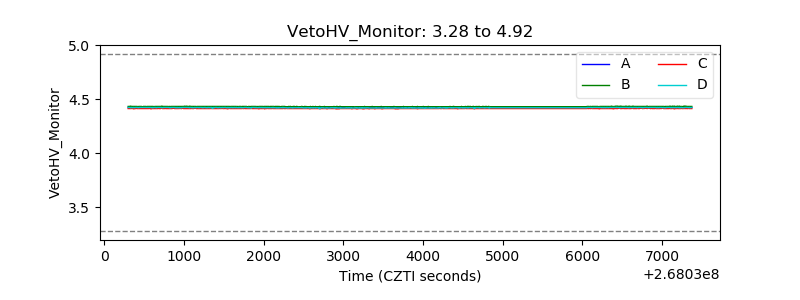 |
| Veto LLD | 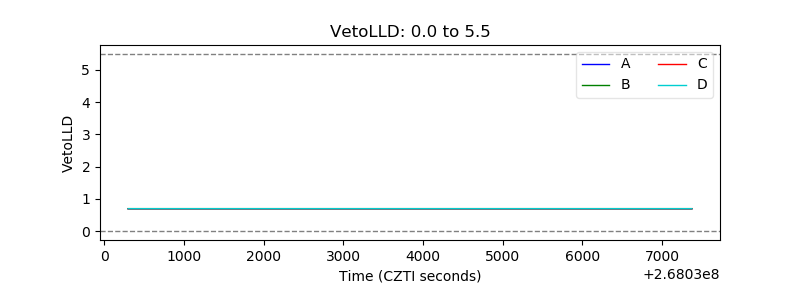 |
| Alpha Counter | 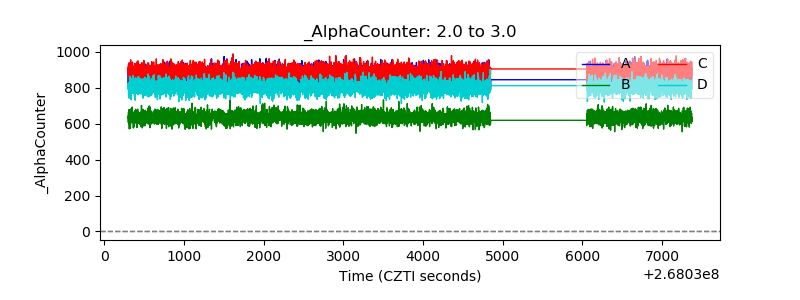 |
| _CPM_Rate | 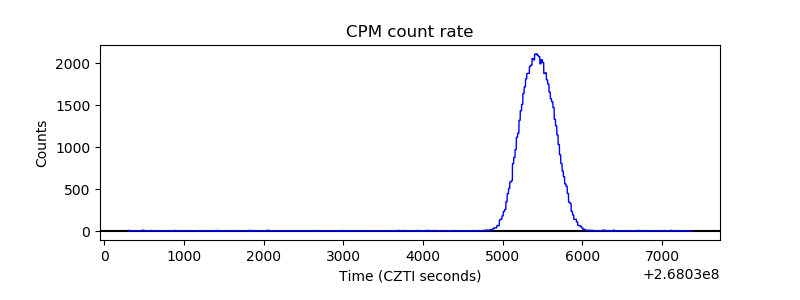 |
| CZT Counter | 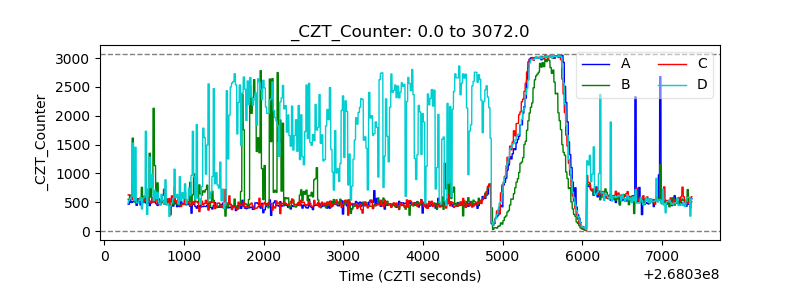 |
| +2.5 Volts monitor |  |
| +5 Volts monitor |  |
| _ROLL_ROT | 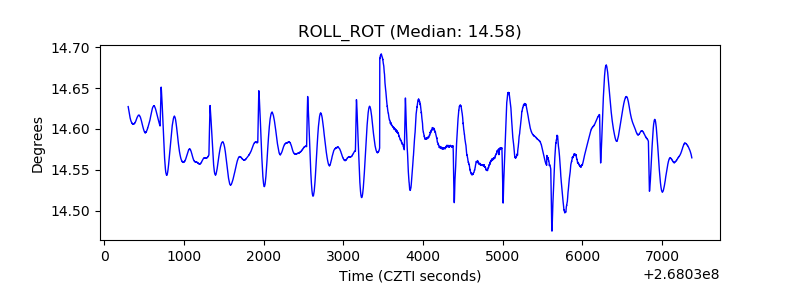 |
| _Roll_DEC | 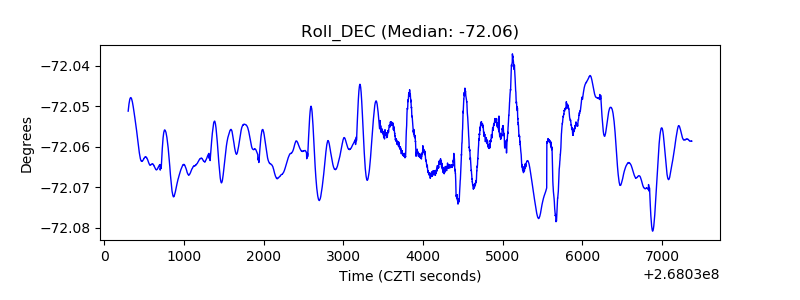 |
| _Roll_RA | 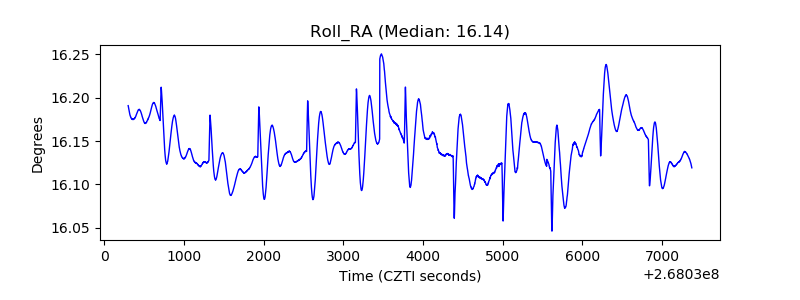 |
| Veto Counter | 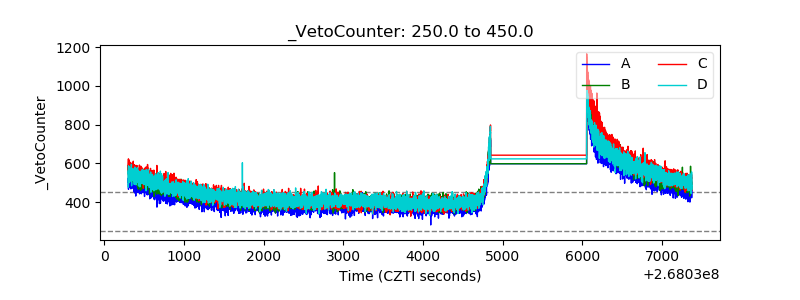 |