| Param | Original file | Final file |
|---|---|---|
| Filename | modeM0/AS1T02_054T01_9000002200_14893cztM0_level2.evt | modeM0/AS1T02_054T01_9000002200_14893cztM0_level2_quad_clean.evt |
| Size (bytes) | 463,288,320 | 107,000,640 |
| Size | 441.8 MB | 102.0 MB |
| Events in quadrant A | 2,991,248 | 711,344 |
| Events in quadrant B | 3,496,275 | 710,509 |
| Events in quadrant C | 2,975,538 | 720,259 |
| Events in quadrant D | 4,176,835 | 696,062 |
| Mode SS | |||
|---|---|---|---|
| Quadrant | BADHDUFLAG | Total packets | Discarded packets |
| A | 0 | 116 | 0 |
| B | 0 | 116 | 0 |
| C | 0 | 116 | 0 |
| D | 0 | 116 | 0 |
| Mode M9 | |||
|---|---|---|---|
| Quadrant | BADHDUFLAG | Total packets | Discarded packets |
| A | 0 | 13 | 0 |
| B | 0 | 13 | 0 |
| C | 0 | 13 | 0 |
| D | 0 | 13 | 0 |
| Mode M0 | |||
|---|---|---|---|
| Quadrant | BADHDUFLAG | Total packets | Discarded packets |
| A | 0 | 12397 | 0 |
| B | 0 | 13889 | 0 |
| C | 0 | 12246 | 0 |
| D | 0 | 15996 | 0 |
| Quadrant | Total seconds | Saturated seconds | Saturation percentage |
|---|---|---|---|
| A | 5762 | 54 | 0.937175% |
| B | 5763 | 176 | 3.053965% |
| C | 5763 | 41 | 0.711435% |
| D | 5762 | 285 | 4.946199% |
Noise dominated data is calculated using 1-second bins in cleaned event files. If a bin has >2000 counts, and if more than 50% of those come from <1% of pixels, then it is considered to be noise-dominated and hence unusable.
| Quadrant | # 1 sec bins | Bins with >0 counts | Bins with >2000 counts | High rate bins dominated by noise | Noise dominated (total time) | Noise dominated (detector-on time) | Marked lightcurve |
|---|---|---|---|---|---|---|---|
| A | 7052 | 5763 | 10 | 10 | 0.14% | 0.17% | 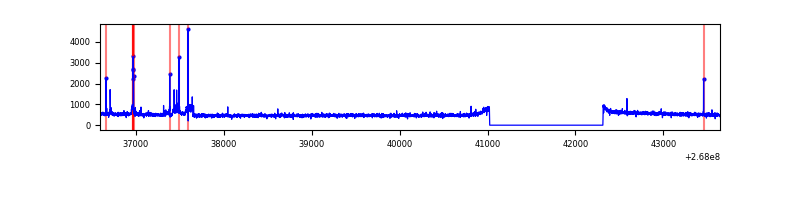 |
| B | 7053 | 5764 | 100 | 100 | 1.42% | 1.73% | 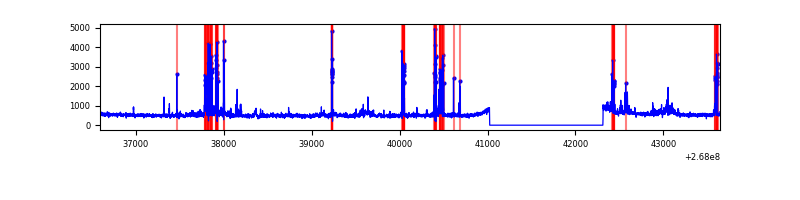 |
| C | 7053 | 5764 | 0 | 0 | 0.00% | 0.00% | 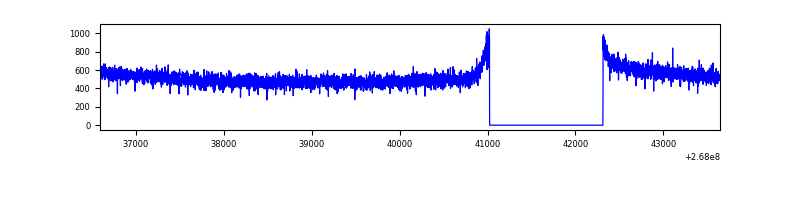 |
| D | 7052 | 5763 | 225 | 225 | 3.19% | 3.90% | 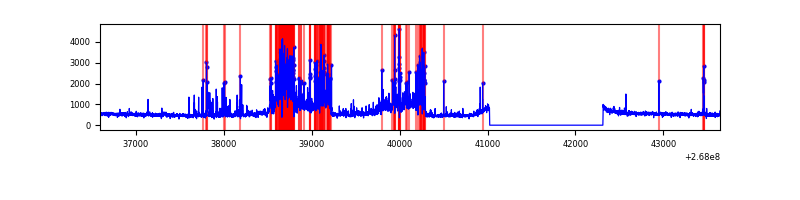 |
Top three noisy pixels from each quadrant. If the there are fewer than three noisy pixels in the level2.evt file, extra rows are filled as -1
| Pixel properties | Quadrant properties | ||||||
|---|---|---|---|---|---|---|---|
| Quadrant | DetID | PixID | Counts | Sigma | Mean | Median | Sigma |
| A | 11 | 29 | 99384 | 657.39 | 743 | 728 | 150.1 |
| A | 9 | 143 | 13260 | 83.51 | 743 | 728 | 150.1 |
| A | 14 | 237 | 12651 | 79.45 | 743 | 728 | 150.1 |
| B | 3 | 64 | 416443 | 3150.89 | 724 | 707 | 131.9 |
| B | 0 | 229 | 85833 | 645.18 | 724 | 707 | 131.9 |
| B | 0 | 189 | 85193 | 640.33 | 724 | 707 | 131.9 |
| C | 3 | 233 | 131933 | 796.41 | 726 | 730 | 164.7 |
| C | 0 | 207 | 5884 | 31.28 | 726 | 730 | 164.7 |
| C | 3 | 232 | 5582 | 29.45 | 726 | 730 | 164.7 |
| D | 7 | 254 | 1346243 | 7928.16 | 721 | 706 | 169.7 |
| D | 10 | 199 | 45923 | 266.43 | 721 | 706 | 169.7 |
| D | 2 | 234 | 21033 | 119.77 | 721 | 706 | 169.7 |
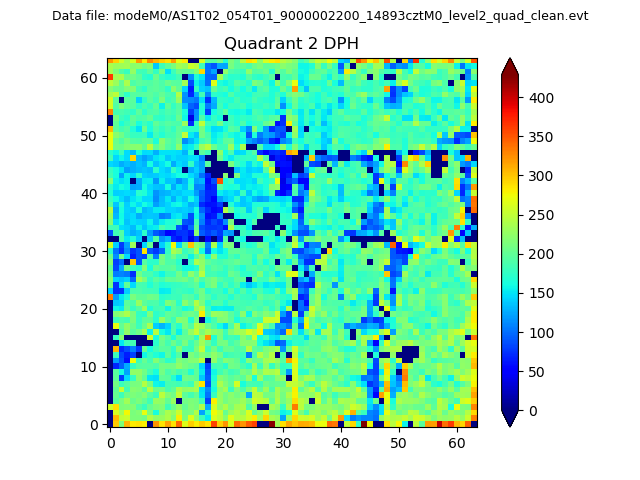
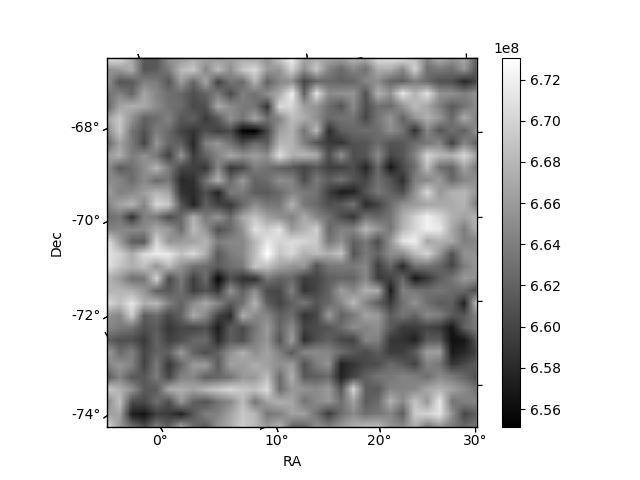
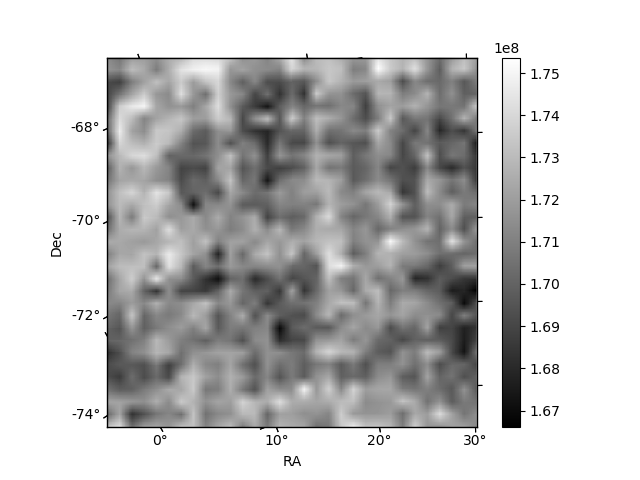
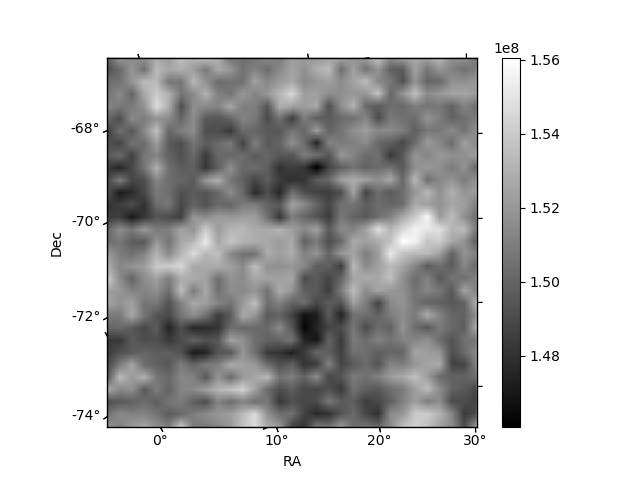
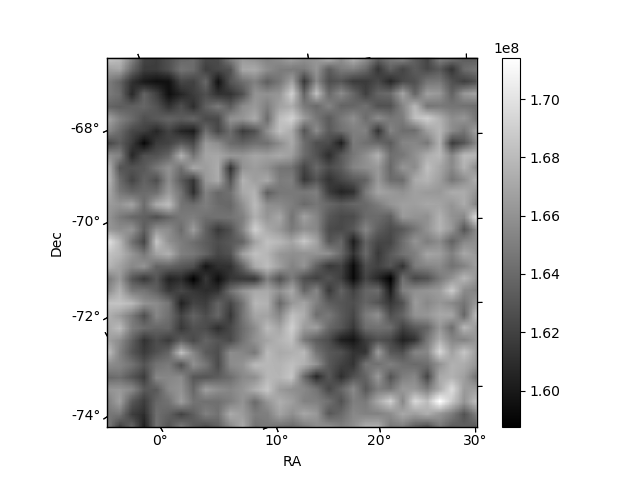
Histogram calculated using DETX and DETY for each event in the final _common_clean file
| Quadrant A | 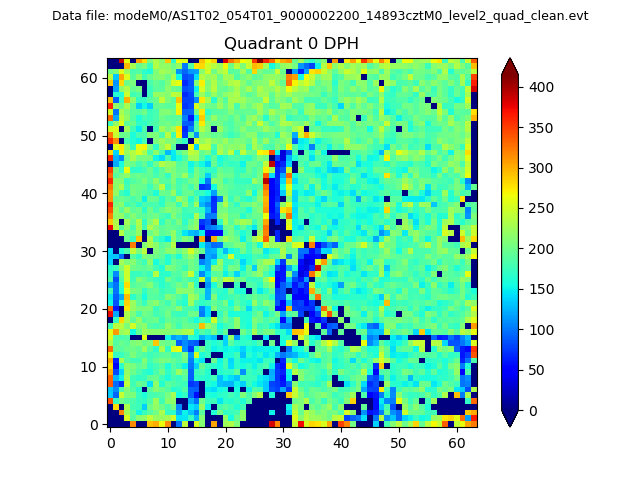 |
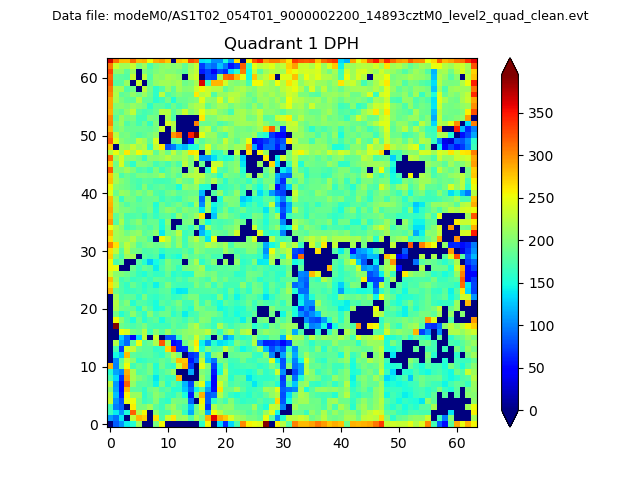 |
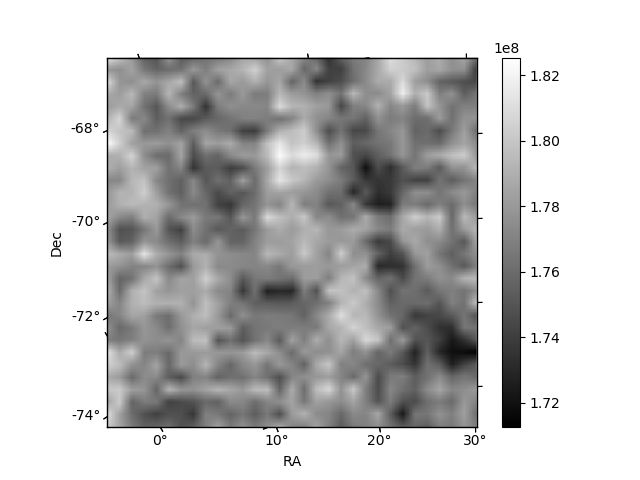
Quadrant B |
|---|---|---|---|
| Quadrant D | 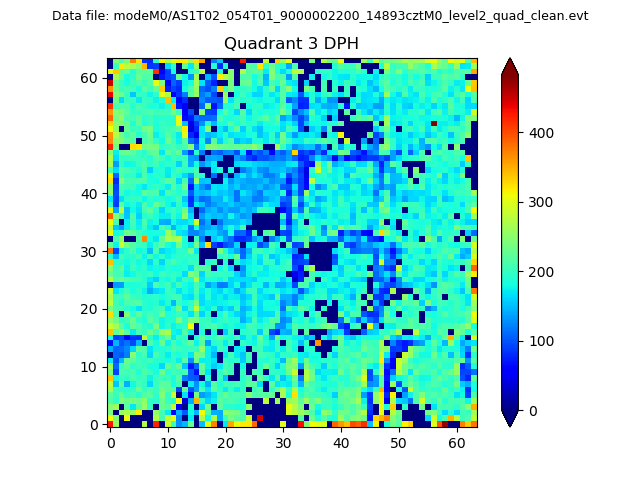 |
 |
Quadrant C |
| Plot type | Count rate plots | Images |
|---|---|---|
| Comparison with Poisson distribution Blue bars denote a histogram of data divided into 1 sec bins. Red curve is a Poisson curve with rate = median count rate of data. |
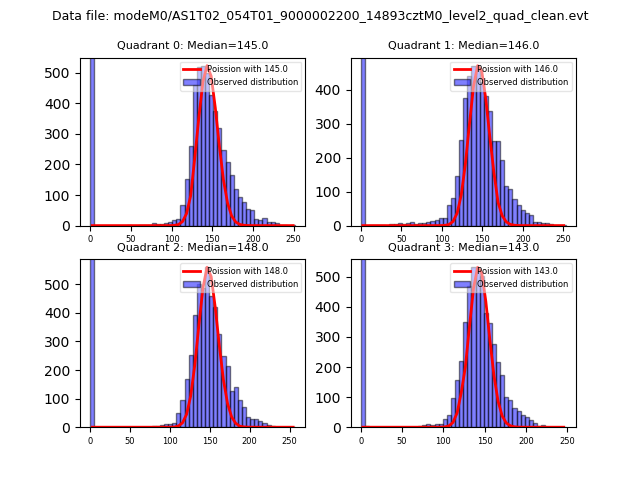 |
 |
| Quadrant-wise count rates Data is divided into 100 sec bins |
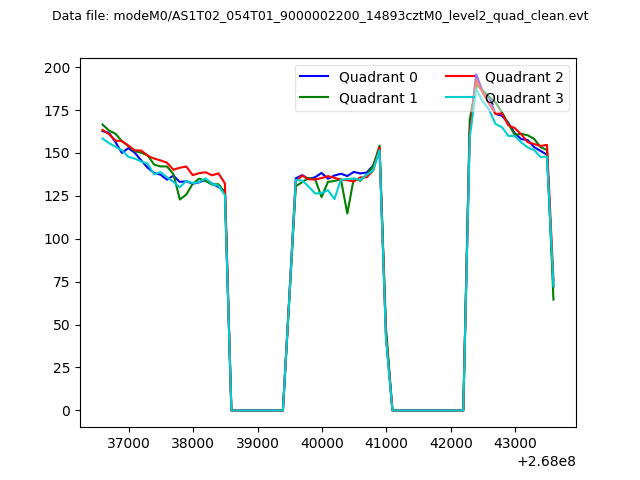 |
|
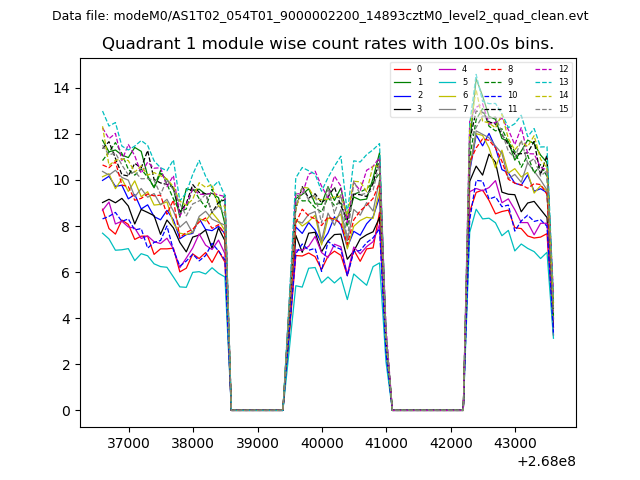
| Module-wise count rates for Quadrant A Data is divided into 100 sec bins |
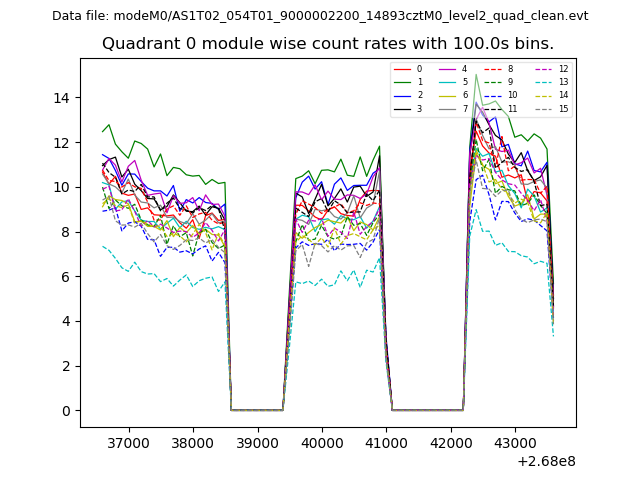 |
 |
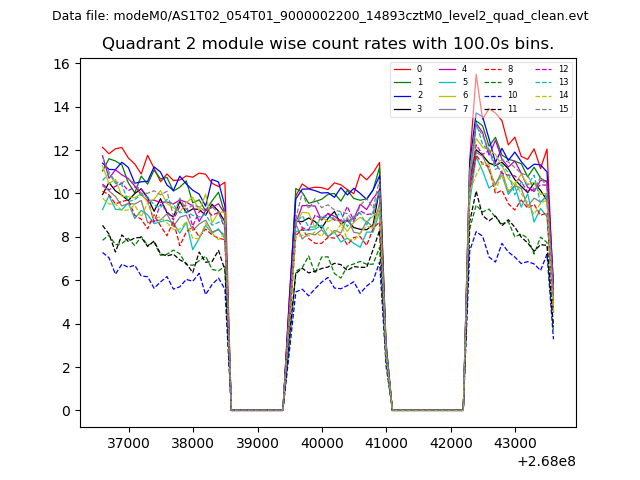
| Module-wise count rates for Quadrant B Data is divided into 100 sec bins |
 |
 |
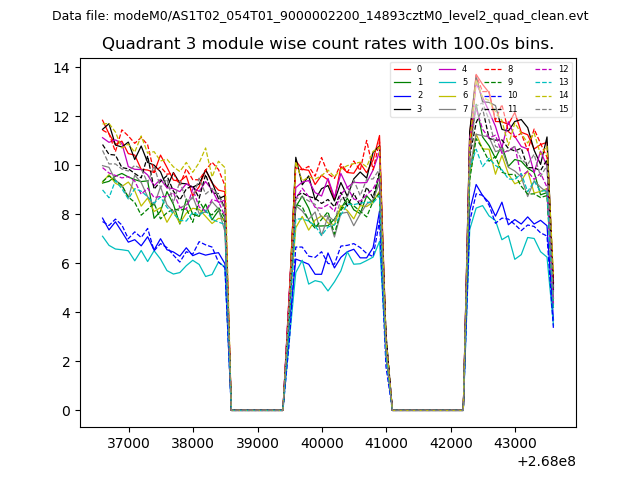
| Module-wise count rates for Quadrant C Data is divided into 100 sec bins |
 |
 |
| Module-wise count rates for Quadrant D Data is divided into 100 sec bins |
 |
 |
| Parameter | Plot |
|---|---|
| CZT HV Monitor | 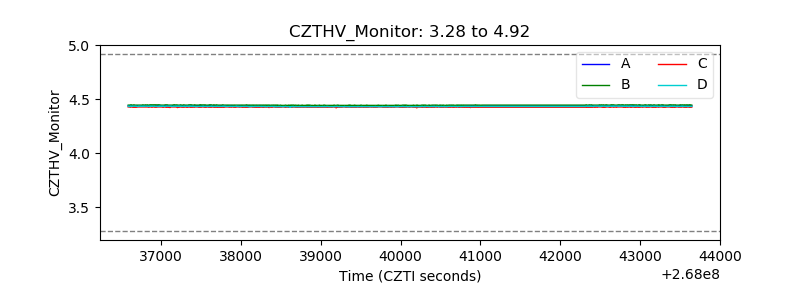 |
| D_VDD | 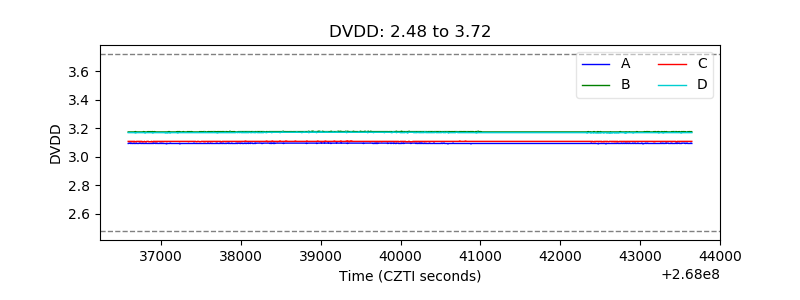 |
| Temperature 1 | 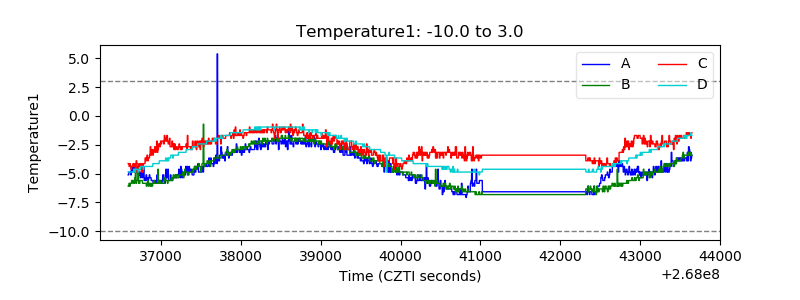 |
| Veto HV Monitor | 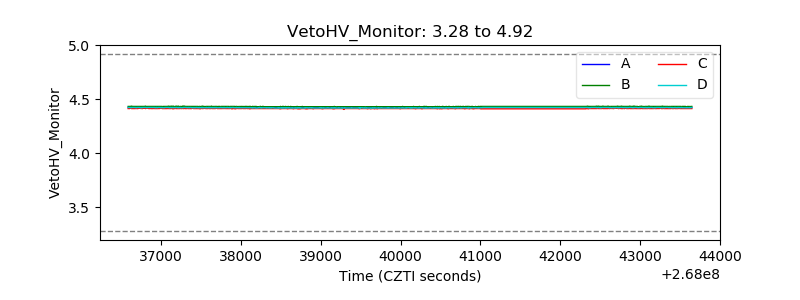 |
| Veto LLD | 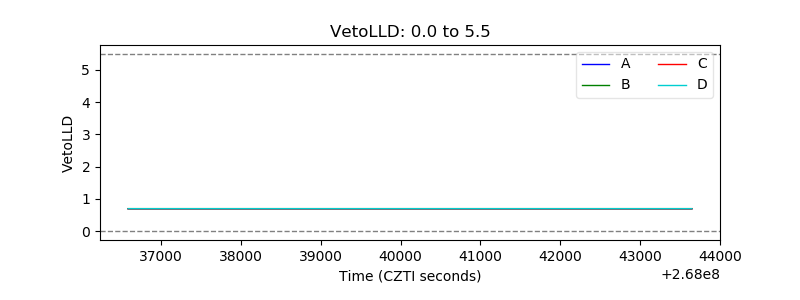 |
| Alpha Counter | 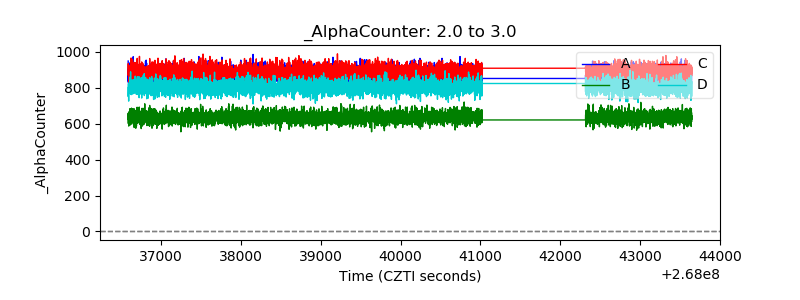 |
| _CPM_Rate | 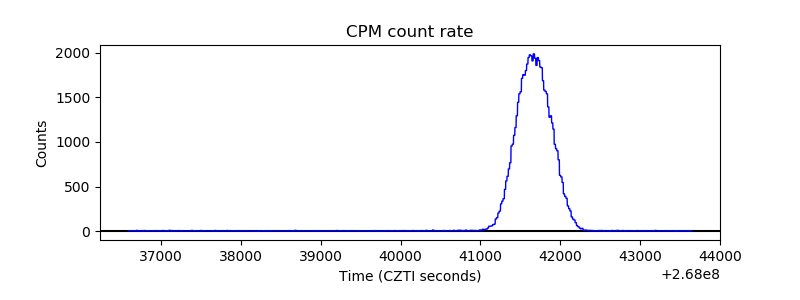 |
| CZT Counter | 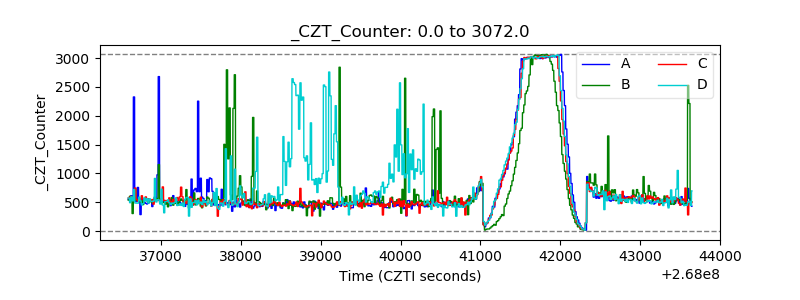 |
| +2.5 Volts monitor |  |
| +5 Volts monitor |  |
| _ROLL_ROT | 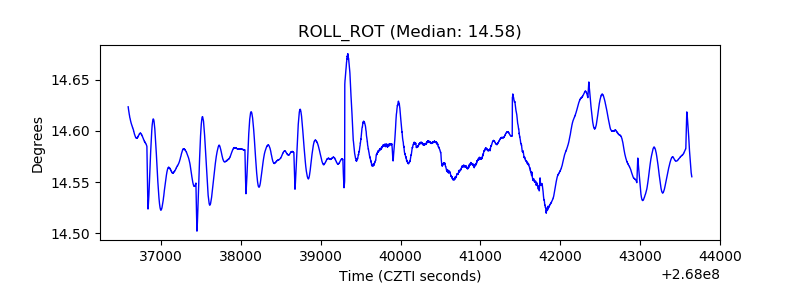 |
| _Roll_DEC | 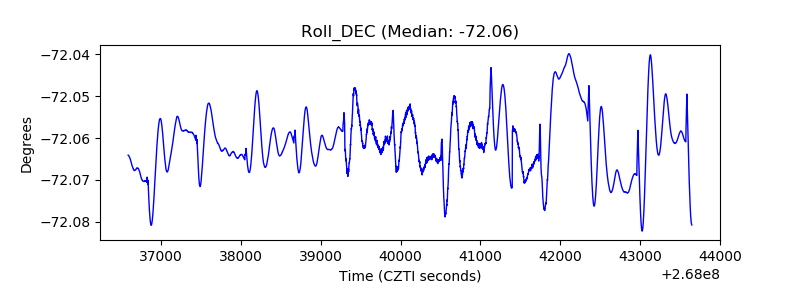 |
| _Roll_RA | 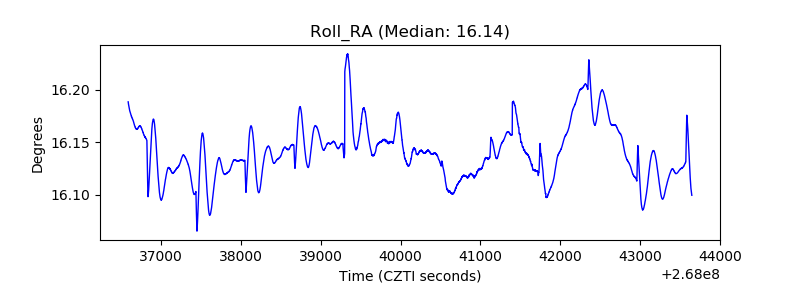 |
| Veto Counter | 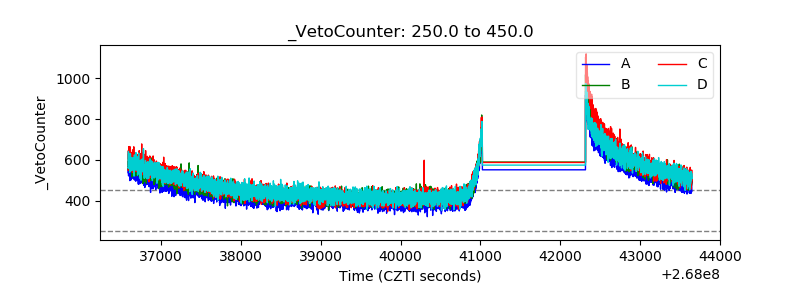 |