| Param | Original file | Final file |
|---|---|---|
| Filename | modeM0/AS1T02_054T01_9000002200_14895cztM0_level2.evt | modeM0/AS1T02_054T01_9000002200_14895cztM0_level2_quad_clean.evt |
| Size (bytes) | 208,376,640 | 40,498,560 |
| Size | 198.7 MB | 38.6 MB |
| Events in quadrant A | 1,328,758 | 260,114 |
| Events in quadrant B | 1,853,600 | 253,300 |
| Events in quadrant C | 1,305,077 | 259,398 |
| Events in quadrant D | 1,631,452 | 253,509 |
| Mode SS | |||
|---|---|---|---|
| Quadrant | BADHDUFLAG | Total packets | Discarded packets |
| A | 0 | 54 | 0 |
| B | 0 | 54 | 0 |
| C | 0 | 54 | 0 |
| D | 0 | 54 | 0 |
| Mode M0 | |||
|---|---|---|---|
| Quadrant | BADHDUFLAG | Total packets | Discarded packets |
| A | 0 | 5648 | 0 |
| B | 0 | 7337 | 0 |
| C | 0 | 5628 | 0 |
| D | 0 | 6546 | 0 |
| Quadrant | Total seconds | Saturated seconds | Saturation percentage |
|---|---|---|---|
| A | 2798 | 3 | 0.107219% |
| B | 2798 | 95 | 3.395282% |
| C | 2798 | 0 | 0.000000% |
| D | 2799 | 48 | 1.714898% |
Noise dominated data is calculated using 1-second bins in cleaned event files. If a bin has >2000 counts, and if more than 50% of those come from <1% of pixels, then it is considered to be noise-dominated and hence unusable.
| Quadrant | # 1 sec bins | Bins with >0 counts | Bins with >2000 counts | High rate bins dominated by noise | Noise dominated (total time) | Noise dominated (detector-on time) | Marked lightcurve |
|---|---|---|---|---|---|---|---|
| A | 2798 | 2798 | 0 | 0 | 0.00% | 0.00% | 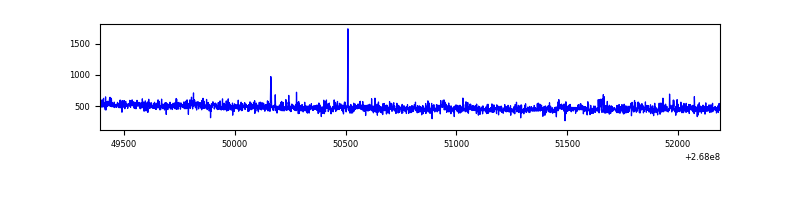 |
| B | 2798 | 2798 | 69 | 69 | 2.47% | 2.47% | 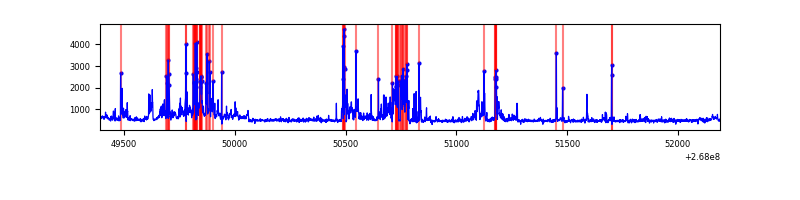 |
| C | 2798 | 2798 | 0 | 0 | 0.00% | 0.00% | 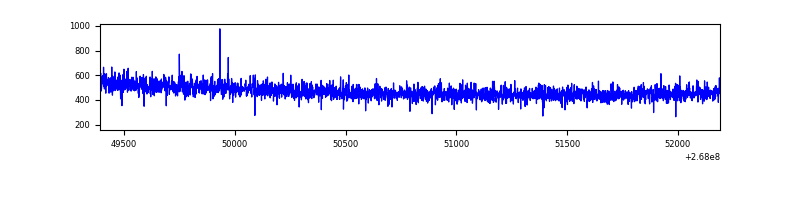 |
| D | 2799 | 2799 | 46 | 46 | 1.64% | 1.64% | 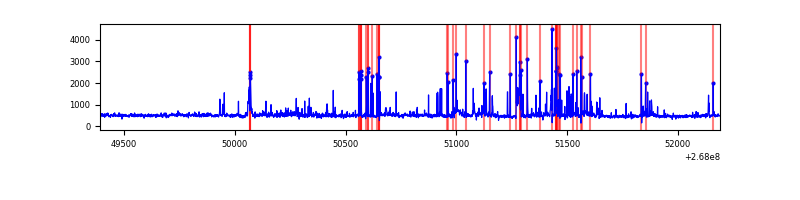 |
Top three noisy pixels from each quadrant. If the there are fewer than three noisy pixels in the level2.evt file, extra rows are filled as -1
| Pixel properties | Quadrant properties | ||||||
|---|---|---|---|---|---|---|---|
| Quadrant | DetID | PixID | Counts | Sigma | Mean | Median | Sigma |
| A | 12 | 189 | 31863 | 458.43 | 335 | 328 | 68.8 |
| A | 9 | 143 | 3938 | 52.48 | 335 | 328 | 68.8 |
| A | 0 | 226 | 2999 | 38.83 | 335 | 328 | 68.8 |
| B | 10 | 16 | 237536 | 3826.84 | 324 | 318 | 62.0 |
| B | 3 | 64 | 189233 | 3047.61 | 324 | 318 | 62.0 |
| B | 0 | 189 | 65831 | 1056.87 | 324 | 318 | 62.0 |
| C | 3 | 233 | 59646 | 807.17 | 318 | 320 | 73.5 |
| C | 13 | 61 | 2424 | 28.63 | 318 | 320 | 73.5 |
| C | 14 | 220 | 1730 | 19.18 | 318 | 320 | 73.5 |
| D | 7 | 254 | 281958 | 3645.49 | 322 | 316 | 77.3 |
| D | 7 | 38 | 95426 | 1231.08 | 322 | 316 | 77.3 |
| D | 2 | 234 | 10986 | 138.11 | 322 | 316 | 77.3 |
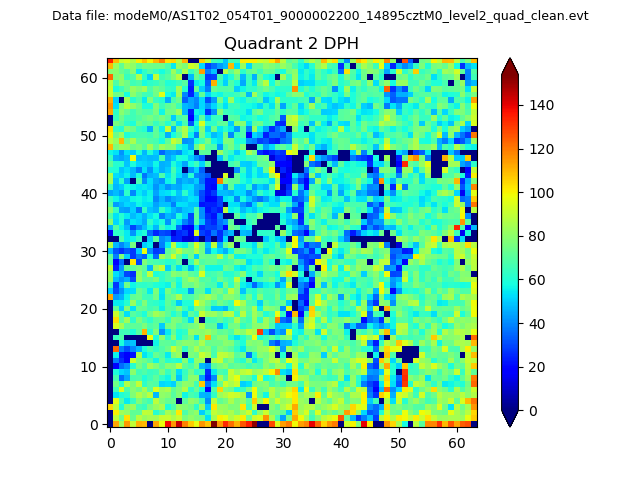
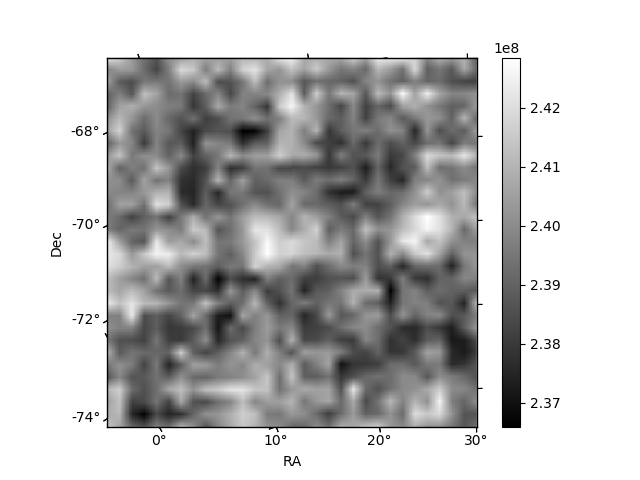
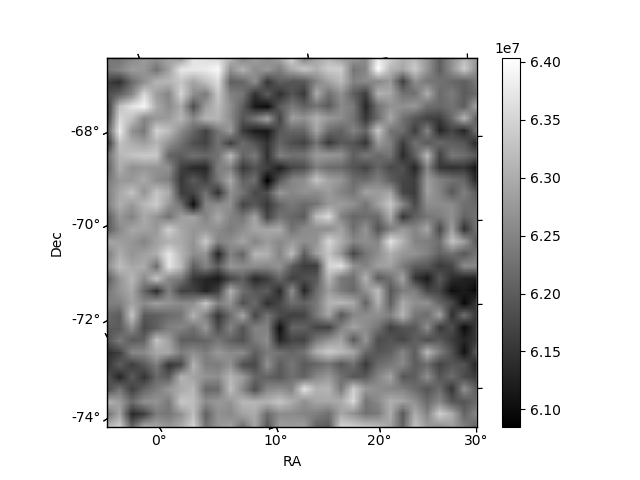
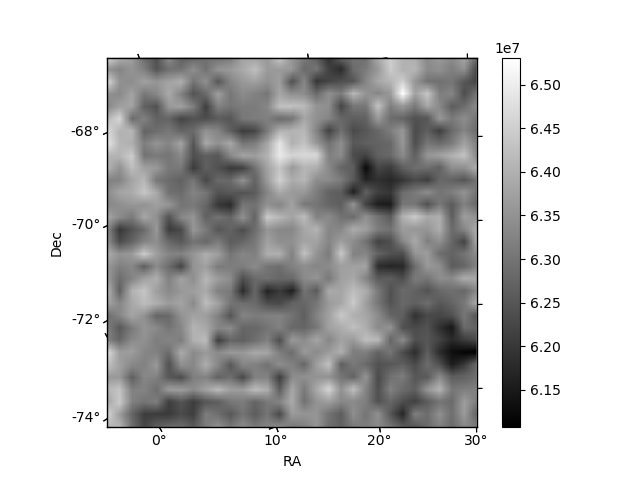
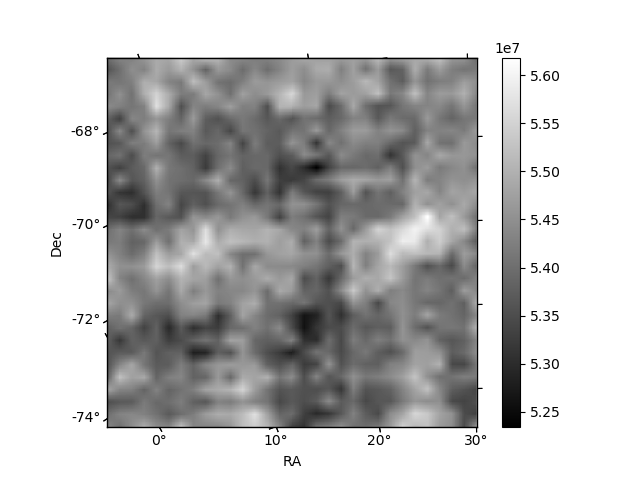
Histogram calculated using DETX and DETY for each event in the final _common_clean file
| Quadrant A | 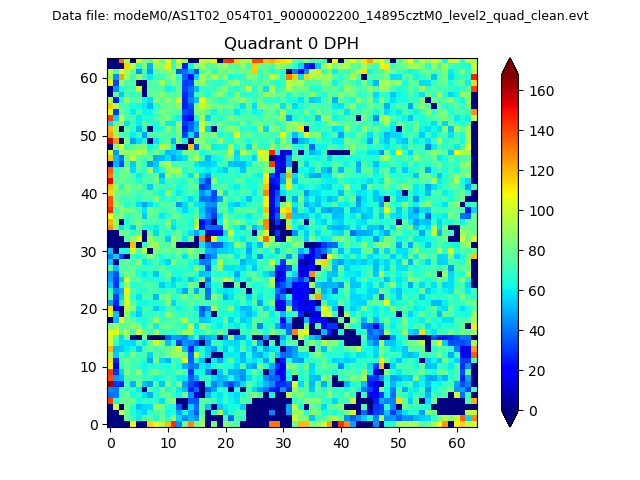 |
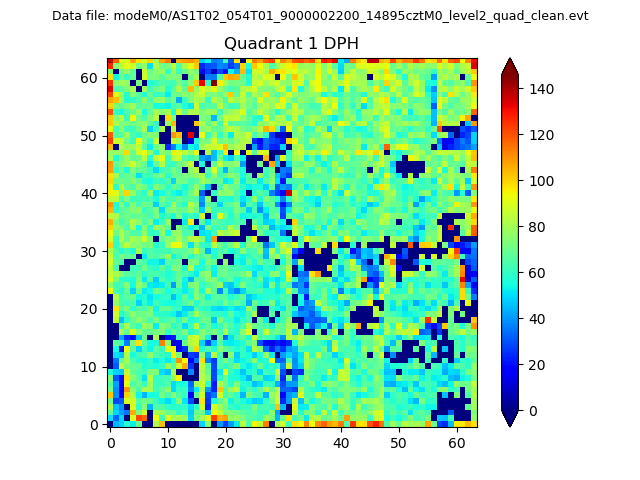 |
Quadrant B |
|---|---|---|---|
| Quadrant D | 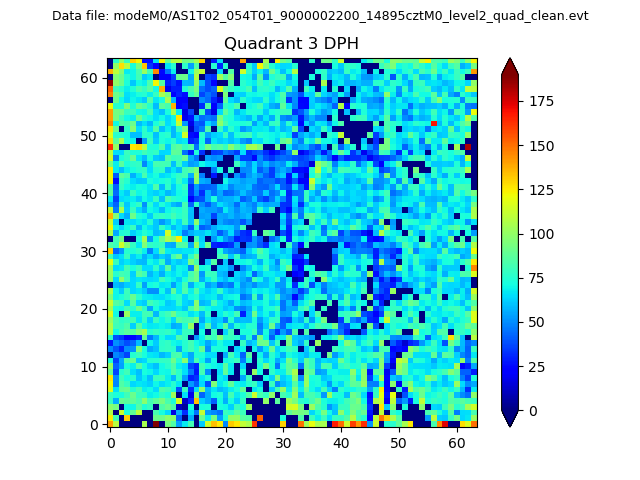 |
 |
Quadrant C |
| Plot type | Count rate plots | Images |
|---|---|---|
| Comparison with Poisson distribution Blue bars denote a histogram of data divided into 1 sec bins. Red curve is a Poisson curve with rate = median count rate of data. |
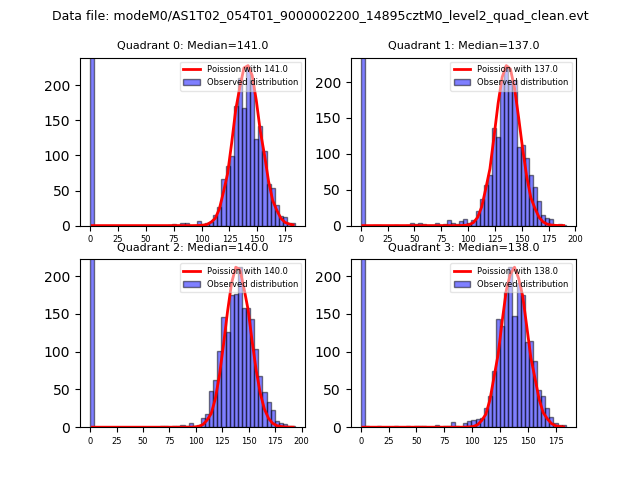 |
 |
| Quadrant-wise count rates Data is divided into 100 sec bins |
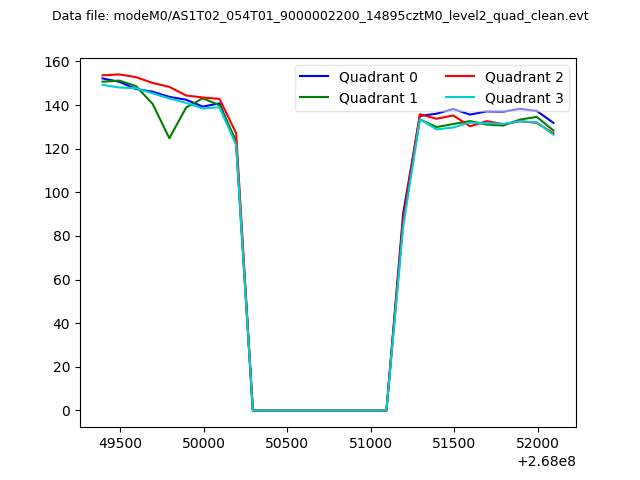 |
|
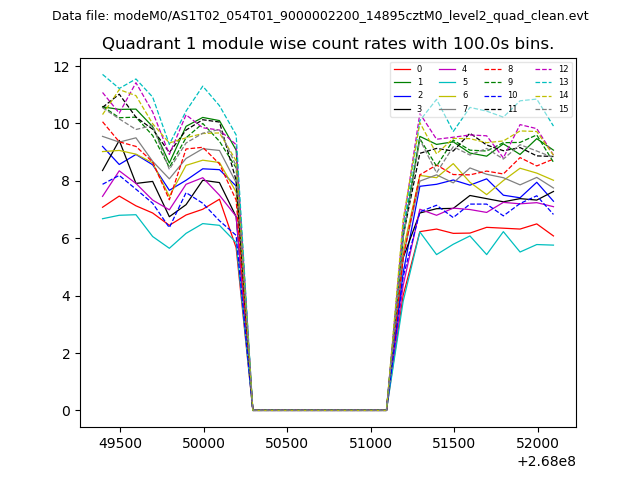
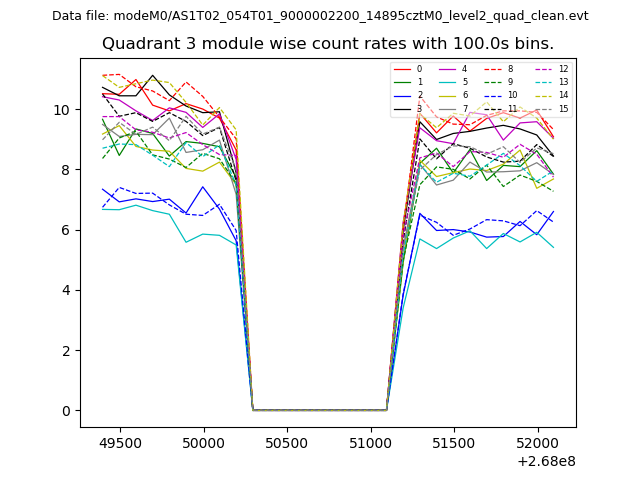
| Module-wise count rates for Quadrant A Data is divided into 100 sec bins |
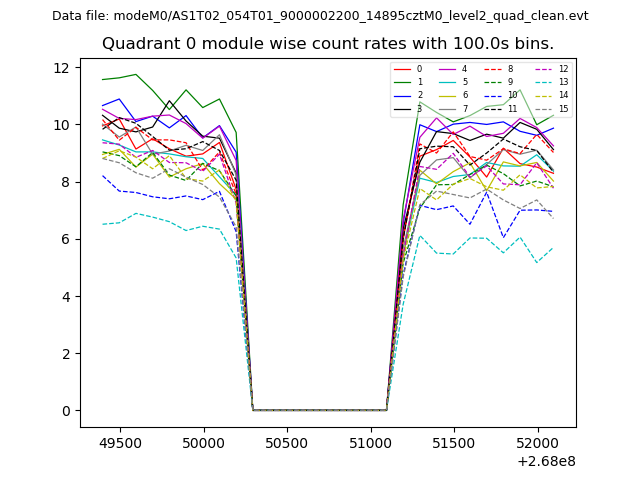 |
 |
| Module-wise count rates for Quadrant B Data is divided into 100 sec bins |
 |
 |
| Module-wise count rates for Quadrant C Data is divided into 100 sec bins |
 |
 |
| Module-wise count rates for Quadrant D Data is divided into 100 sec bins |
 |
 |
| Parameter | Plot |
|---|---|
| CZT HV Monitor | 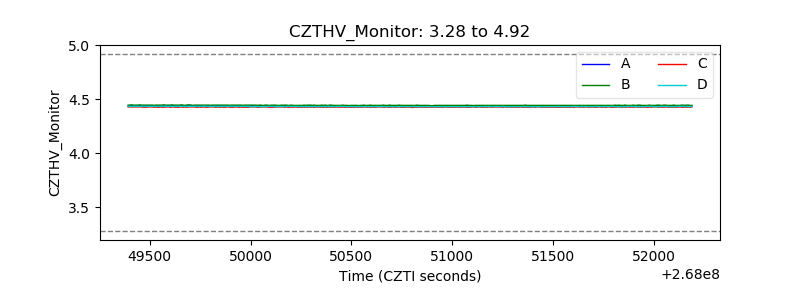 |
| D_VDD | 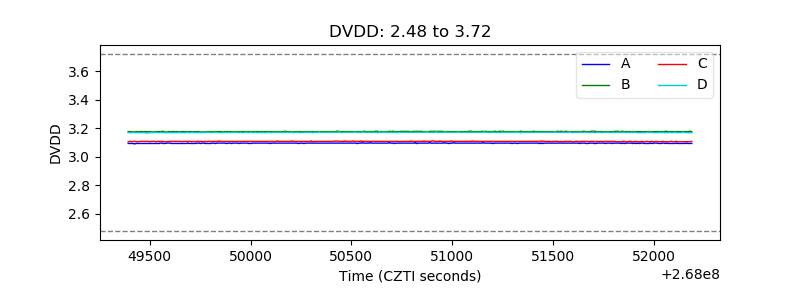 |
| Temperature 1 | 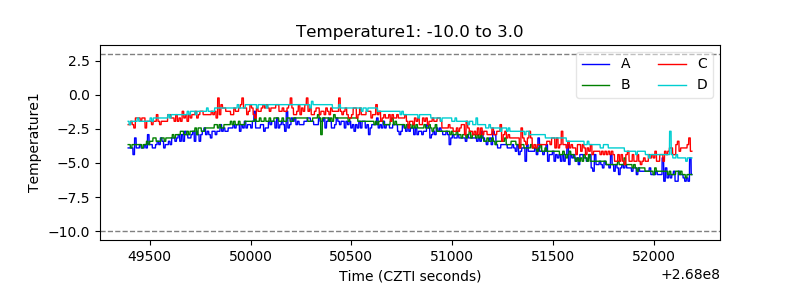 |
| Veto HV Monitor | 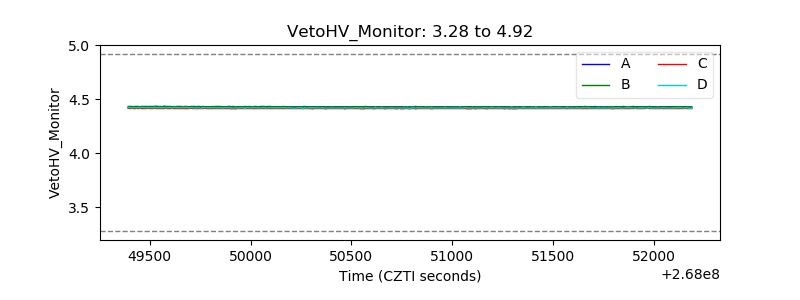 |
| Veto LLD | 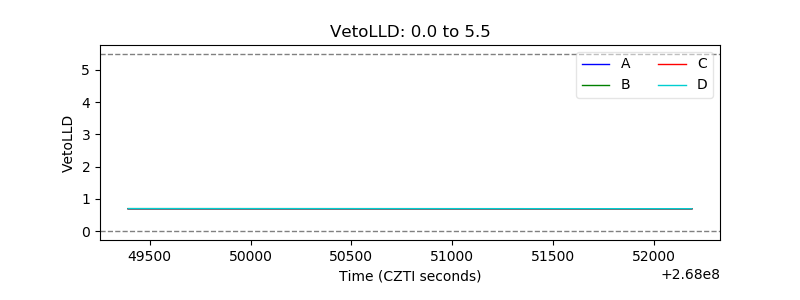 |
| Alpha Counter | 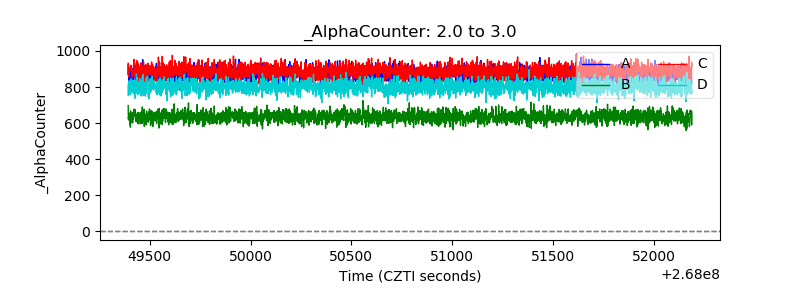 |
| _CPM_Rate | 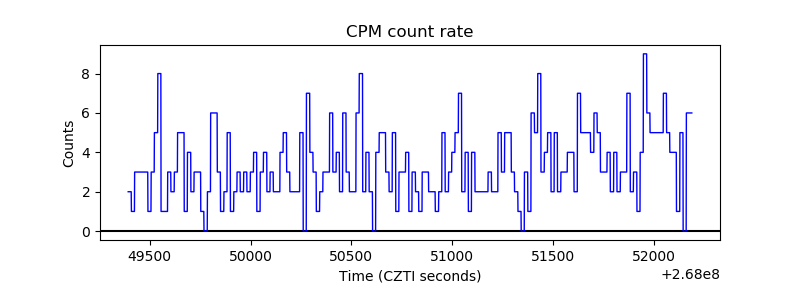 |
| CZT Counter | 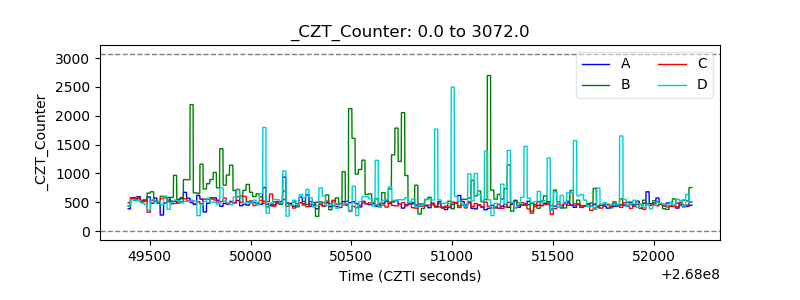 |
| +2.5 Volts monitor |  |
| +5 Volts monitor | 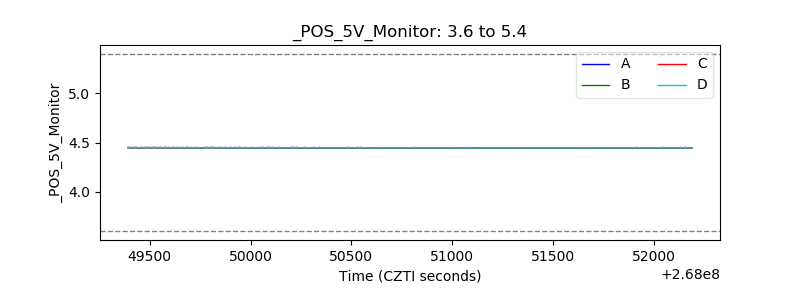 |
| _ROLL_ROT | 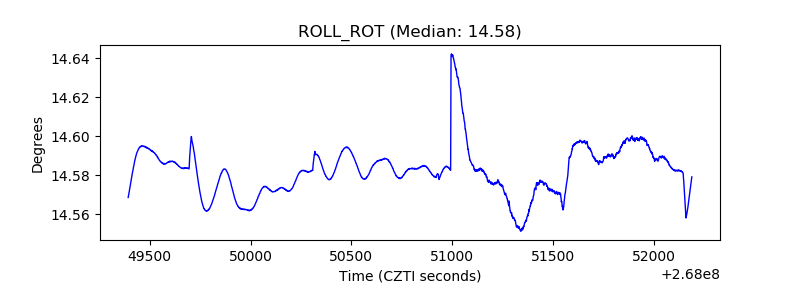 |
| _Roll_DEC | 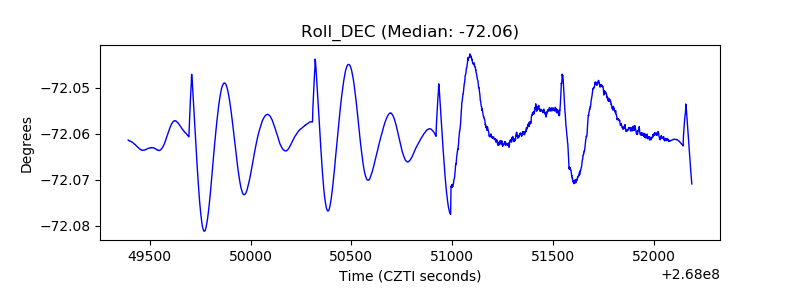 |
| _Roll_RA | 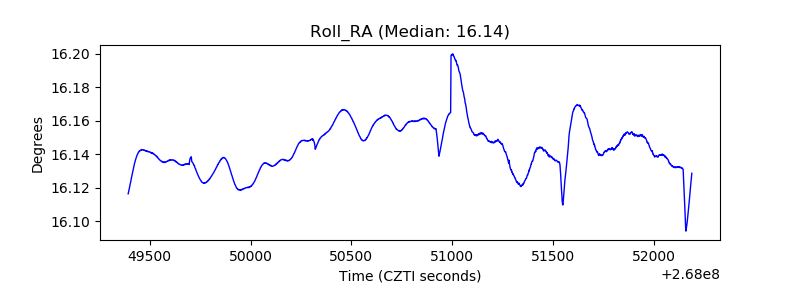 |
| Veto Counter |  |