| Param | Original file | Final file |
|---|---|---|
| Filename | modeM0/AS1A04_011T09_9000002202cztM0_level2.fits | modeM0/AS1A04_011T09_9000002202cztM0_level2_quad_clean.evt |
| Size (bytes) | 617,751,360 | 597,018,240 |
| Size | 589.1 MB | 569.4 MB |
| Events in quadrant A | 3,834,876 | 3,715,119 |
| Events in quadrant B | 3,428,054 | 3,299,864 |
| Events in quadrant C | 3,717,530 | 3,364,740 |
| Events in quadrant D | 3,282,330 | 3,256,851 |
| Mode M9 | |||
|---|---|---|---|
| Quadrant | BADHDUFLAG | Total packets | Discarded packets |
| A | 0 | 94 | 0 |
| B | 0 | 94 | 0 |
| C | 0 | 94 | 0 |
| D | 0 | 94 | 0 |
| Mode M0 | |||
|---|---|---|---|
| Quadrant | BADHDUFLAG | Total packets | Discarded packets |
| A | 0 | 135238 | 0 |
| B | 0 | 176984 | 0 |
| C | 0 | 134262 | 0 |
| D | 0 | 139537 | 0 |
| Mode SS | |||
|---|---|---|---|
| Quadrant | BADHDUFLAG | Total packets | Discarded packets |
| A | 0 | 1320 | 0 |
| B | 0 | 1320 | 0 |
| C | 0 | 1320 | 0 |
| D | 0 | 1320 | 0 |
| Quadrant | Total seconds | Saturated seconds | Saturation percentage |
|---|---|---|---|
| A | 64790 | 595 | 0.918352% |
| B | 64790 | 5436 | 8.390184% |
| C | 64790 | 447 | 0.689921% |
| D | 64790 | 622 | 0.960025% |
Noise dominated data is calculated using 1-second bins in cleaned event files. If a bin has >2000 counts, and if more than 50% of those come from <1% of pixels, then it is considered to be noise-dominated and hence unusable.
| Quadrant | # 1 sec bins | Bins with >0 counts | Bins with >2000 counts | High rate bins dominated by noise | Noise dominated (total time) | Noise dominated (detector-on time) | Marked lightcurve |
|---|---|---|---|---|---|---|---|
| A | 73249 | 64788 | 0 | 0 | 0.00% | 0.00% | 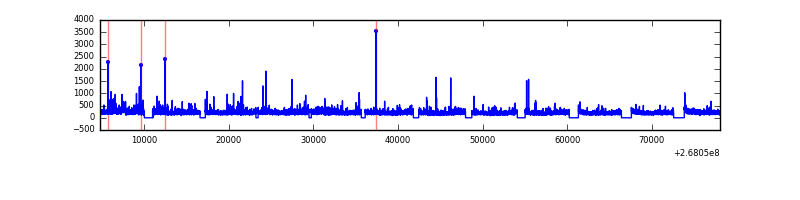 |
| B | 73249 | 63925 | 0 | 0 | 0.00% | 0.00% | 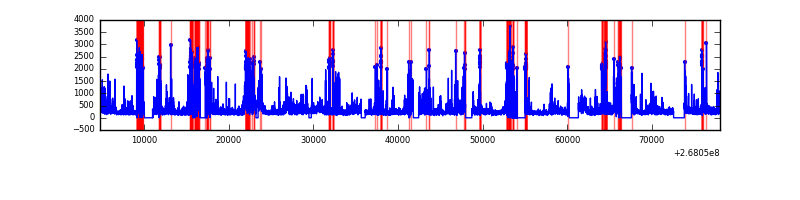 |
| C | 73249 | 64788 | 0 | 0 | 0.00% | 0.00% |  |
| D | 73249 | 64784 | 0 | 0 | 0.00% | 0.00% | 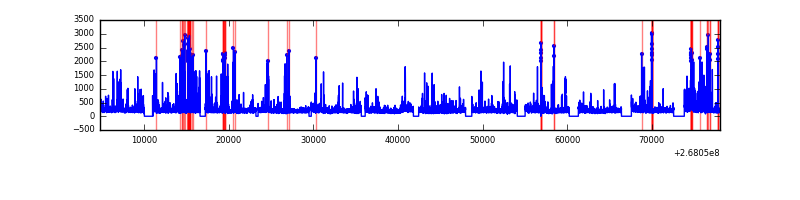 |
Top three noisy pixels from each quadrant. If the there are fewer than three noisy pixels in the level2.evt file, extra rows are filled as -1
| Pixel properties | Quadrant properties | ||||||
|---|---|---|---|---|---|---|---|
| Quadrant | DetID | PixID | Counts | Sigma | Mean | Median | Sigma |
| A | 0 | 29 | 3795 | 11.55 | 997 | 936 | 247.6 |
| A | 7 | 110 | 3083 | 8.67 | 997 | 936 | 247.6 |
| A | 15 | 236 | 2949 | 8.13 | 997 | 936 | 247.6 |
| B | 2 | 9 | 2905 | 11.43 | 905 | 861 | 178.9 |
| B | 3 | 17 | 2358 | 8.37 | 905 | 861 | 178.9 |
| B | 14 | 254 | 2228 | 7.64 | 905 | 861 | 178.9 |
| C | 1 | 80 | 2811 | 7.55 | 980 | 911 | 251.7 |
| C | 1 | 81 | 2807 | 7.53 | 980 | 911 | 251.7 |
| C | 12 | 241 | 2655 | 6.93 | 980 | 911 | 251.7 |
| D | 3 | 14 | 2364 | 5.99 | 936 | 854 | 252.1 |
| D | 6 | 231 | 2360 | 5.97 | 936 | 854 | 252.1 |
| D | 10 | 189 | 2343 | 5.91 | 936 | 854 | 252.1 |
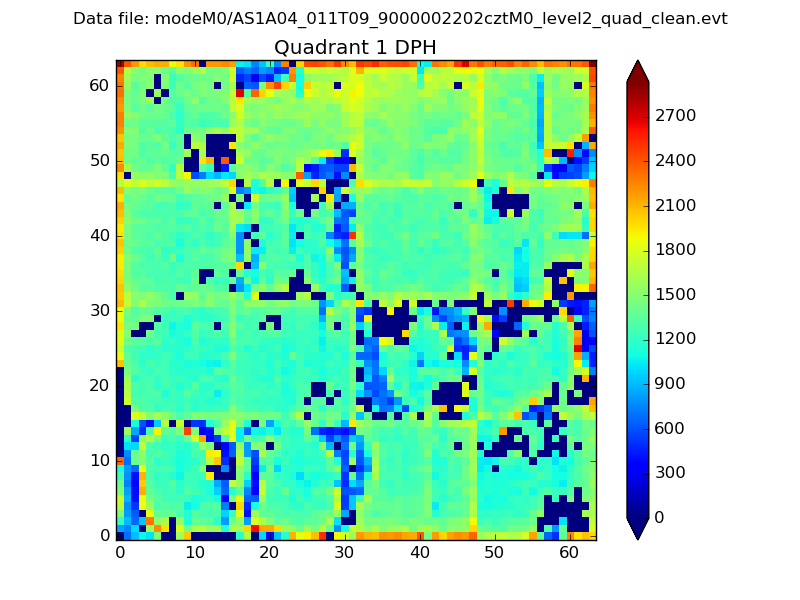
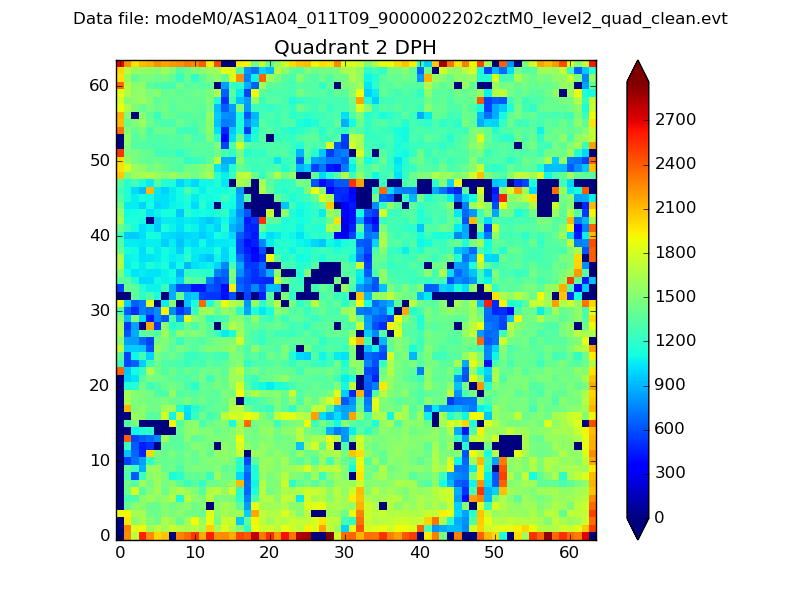
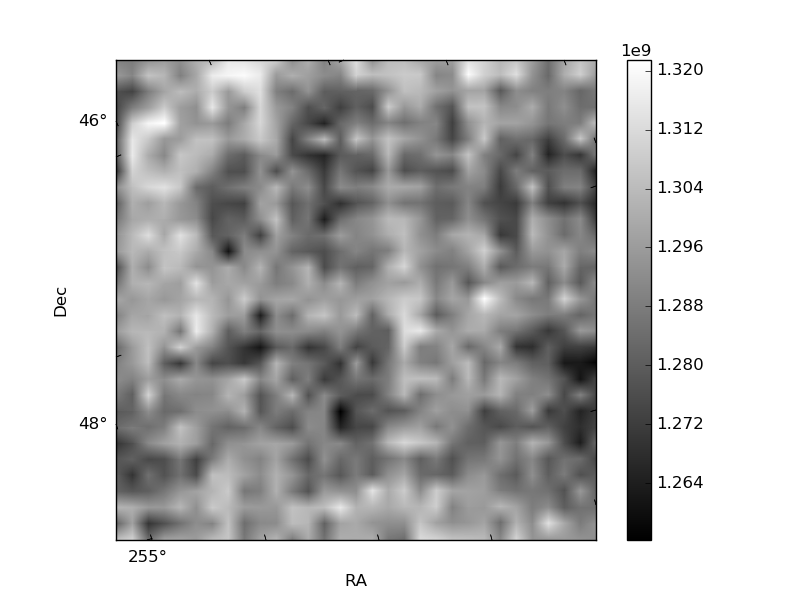
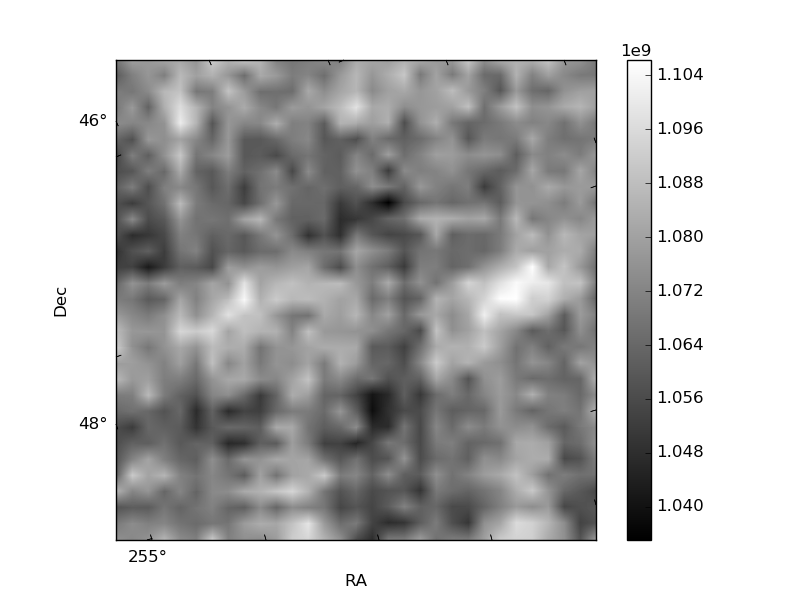
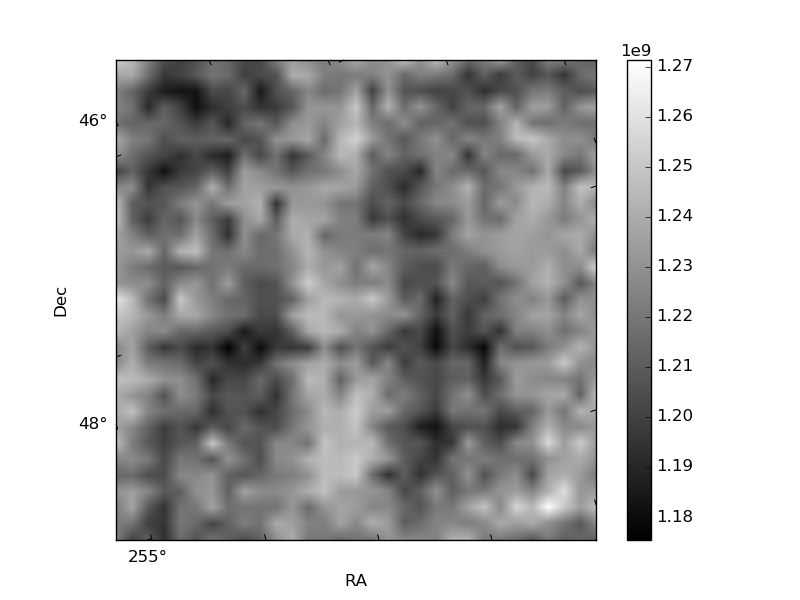
Histogram calculated using DETX and DETY for each event in the final _common_clean file
| Quadrant A | 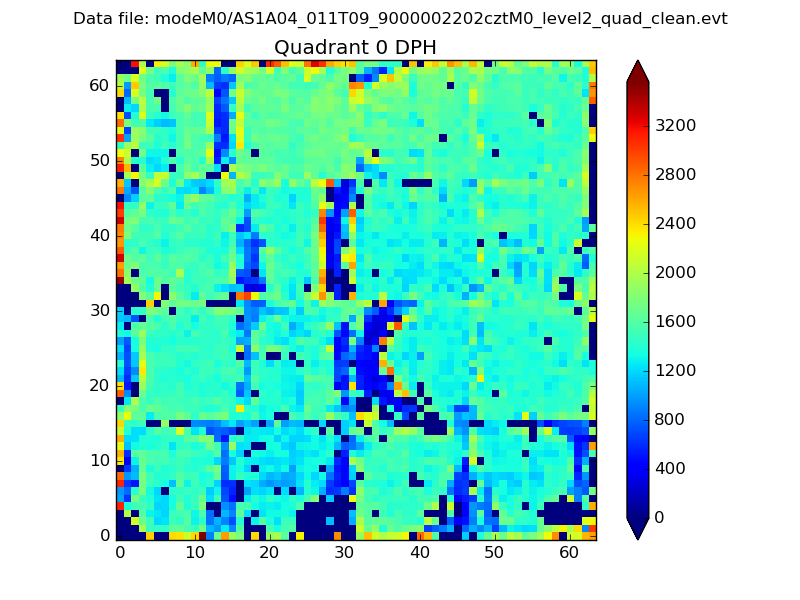 |
 |
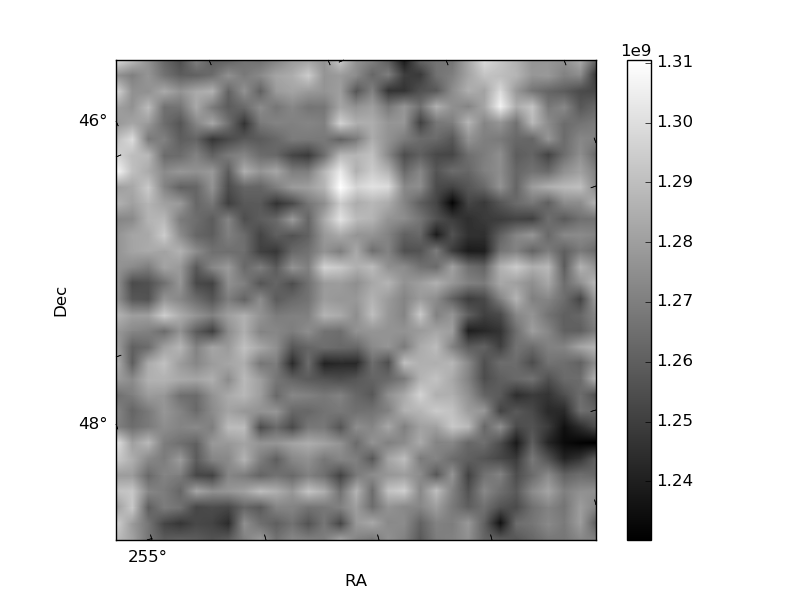
Quadrant B |
|---|---|---|---|
| Quadrant D | 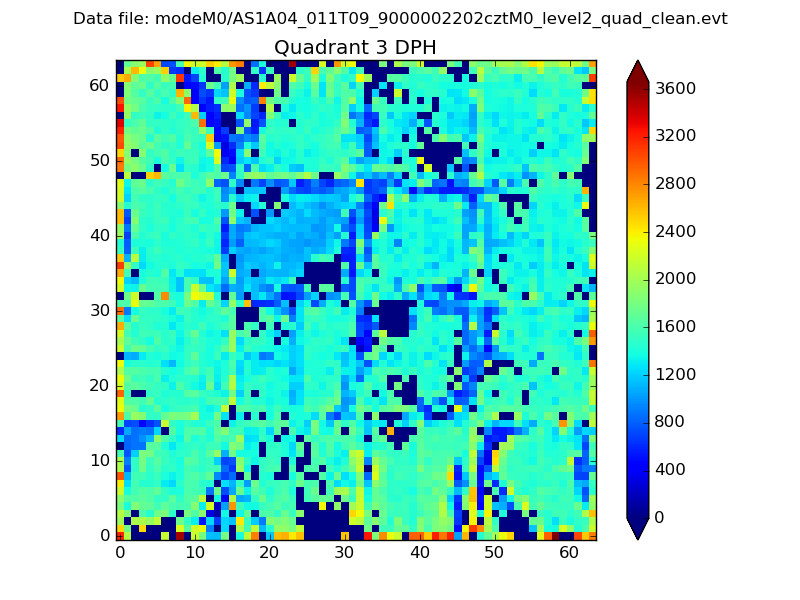 |
 |
Quadrant C |
| Plot type | Count rate plots | Images |
|---|---|---|
| Comparison with Poisson distribution Blue bars denote a histogram of data divided into 1 sec bins. Red curve is a Poisson curve with rate = median count rate of data. |
 |
 |
| Quadrant-wise count rates Data is divided into 100 sec bins |
 |
|
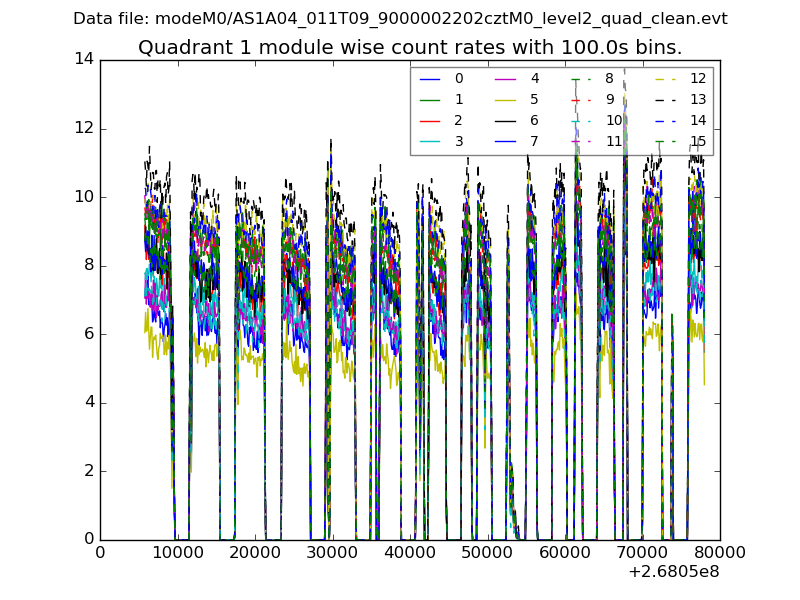
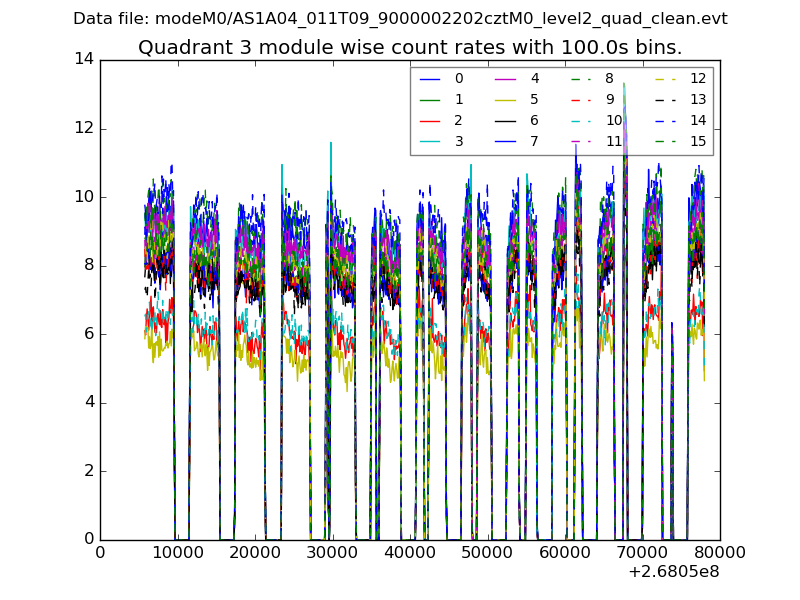
| Module-wise count rates for Quadrant A Data is divided into 100 sec bins |
 |
 |
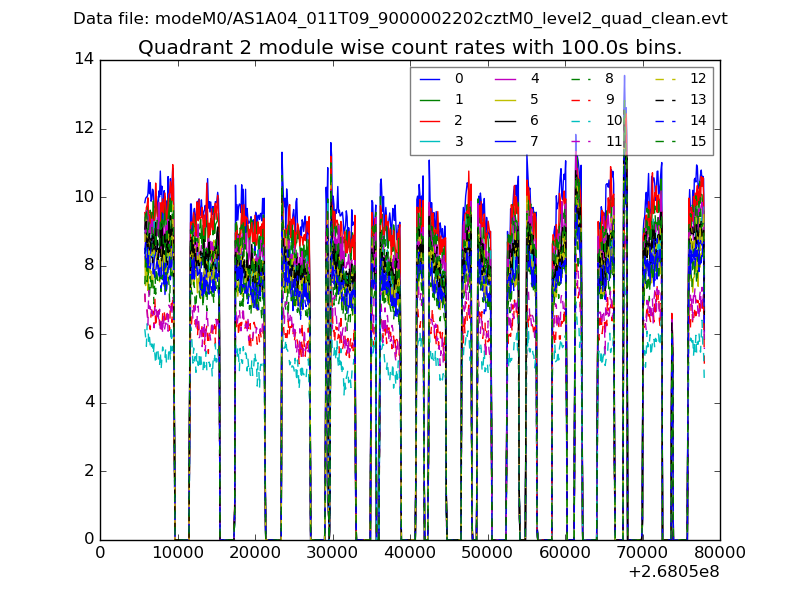
| Module-wise count rates for Quadrant B Data is divided into 100 sec bins |
 |
 |
| Module-wise count rates for Quadrant C Data is divided into 100 sec bins |
 |
 |
| Module-wise count rates for Quadrant D Data is divided into 100 sec bins |
 |
 |
| Parameter | Plot |
|---|---|
| CZT HV Monitor | 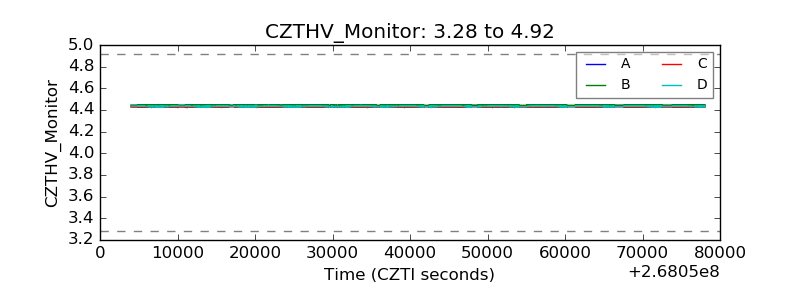 |
| D_VDD | 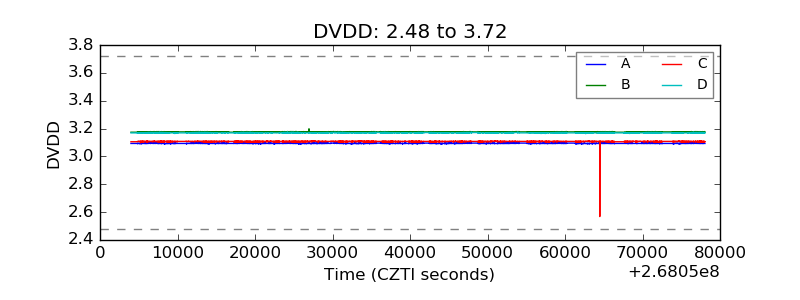 |
| Temperature 1 |  |
| Veto HV Monitor |  |
| Veto LLD | 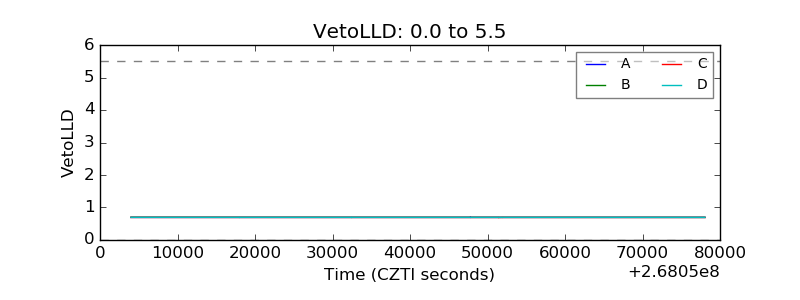 |
| Alpha Counter |  |
| _CPM_Rate | 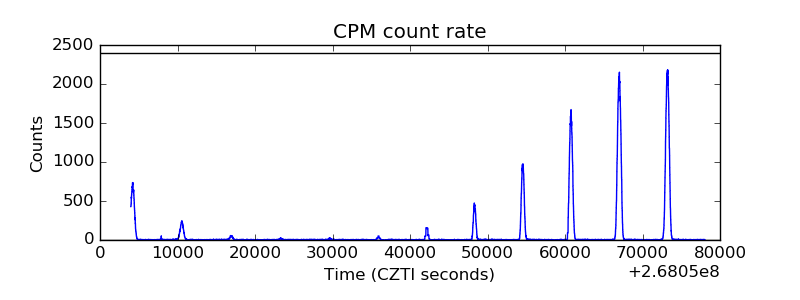 |
| CZT Counter | 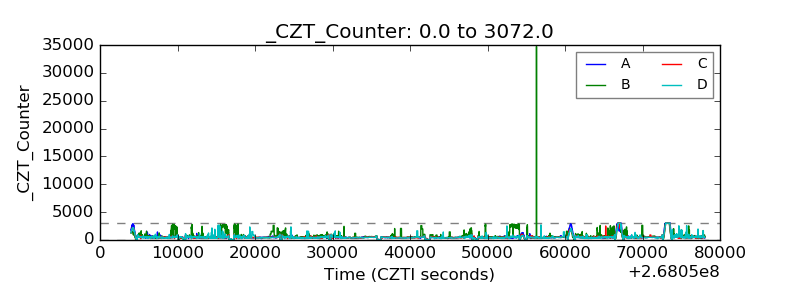 |
| +2.5 Volts monitor | 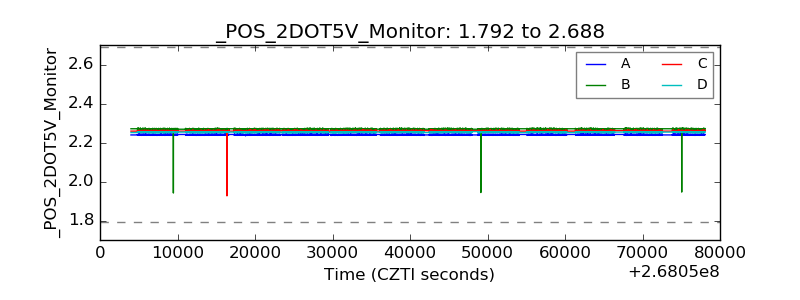 |
| +5 Volts monitor |  |
| _ROLL_ROT | 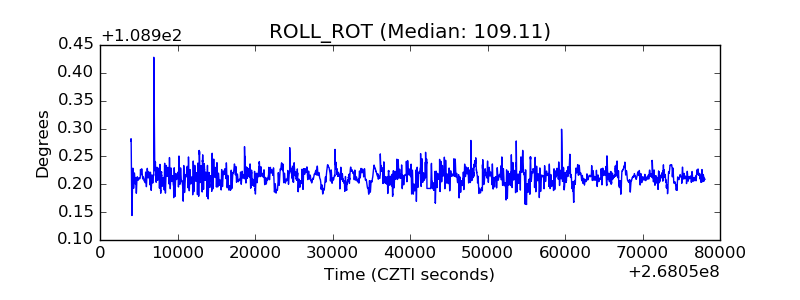 |
| _Roll_DEC | 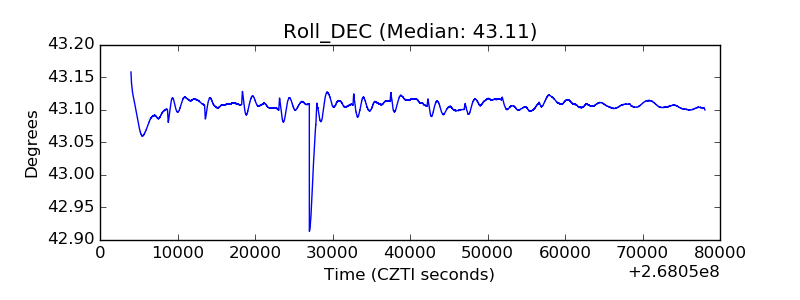 |
| _Roll_RA | 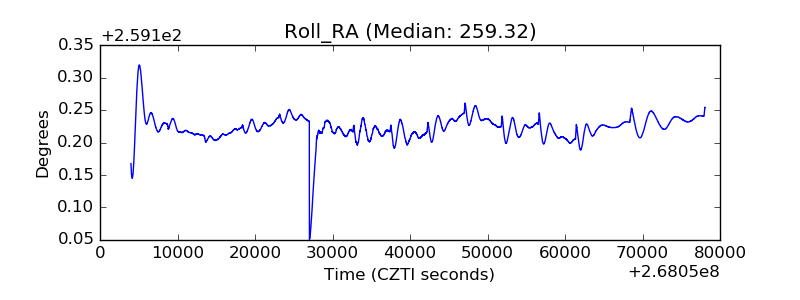 |
| Veto Counter | 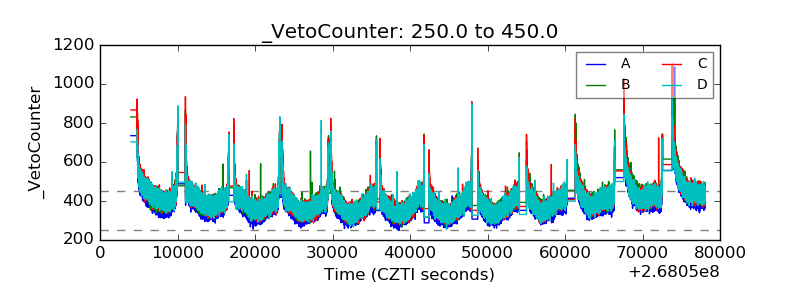 |