| Param | Original file | Final file |
|---|---|---|
| Filename | modeM0/AS1A04_011T09_9000002202_14895cztM0_level2.evt | modeM0/AS1A04_011T09_9000002202_14895cztM0_level2_quad_clean.evt |
| Size (bytes) | 118,031,040 | 13,547,520 |
| Size | 112.6 MB | 12.9 MB |
| Events in quadrant A | 842,854 | 76,326 |
| Events in quadrant B | 1,040,071 | 75,826 |
| Events in quadrant C | 798,083 | 73,245 |
| Events in quadrant D | 787,682 | 71,653 |
| Mode M9 | |||
|---|---|---|---|
| Quadrant | BADHDUFLAG | Total packets | Discarded packets |
| A | 0 | 11 | 0 |
| B | 0 | 11 | 0 |
| C | 0 | 11 | 0 |
| D | 0 | 11 | 0 |
| Mode M0 | |||
|---|---|---|---|
| Quadrant | BADHDUFLAG | Total packets | Discarded packets |
| A | 0 | 3332 | 0 |
| B | 0 | 4113 | 0 |
| C | 0 | 3183 | 0 |
| D | 0 | 3206 | 0 |
| Mode SS | |||
|---|---|---|---|
| Quadrant | BADHDUFLAG | Total packets | Discarded packets |
| A | 0 | 30 | 0 |
| B | 0 | 30 | 0 |
| C | 0 | 30 | 0 |
| D | 0 | 30 | 0 |
| Quadrant | Total seconds | Saturated seconds | Saturation percentage |
|---|---|---|---|
| A | 1519 | 17 | 1.119157% |
| B | 1519 | 37 | 2.435813% |
| C | 1519 | 9 | 0.592495% |
| D | 1519 | 11 | 0.724161% |
Noise dominated data is calculated using 1-second bins in cleaned event files. If a bin has >2000 counts, and if more than 50% of those come from <1% of pixels, then it is considered to be noise-dominated and hence unusable.
| Quadrant | # 1 sec bins | Bins with >0 counts | Bins with >2000 counts | High rate bins dominated by noise | Noise dominated (total time) | Noise dominated (detector-on time) | Marked lightcurve |
|---|---|---|---|---|---|---|---|
| A | 1519 | 1519 | 1 | 1 | 0.07% | 0.07% | 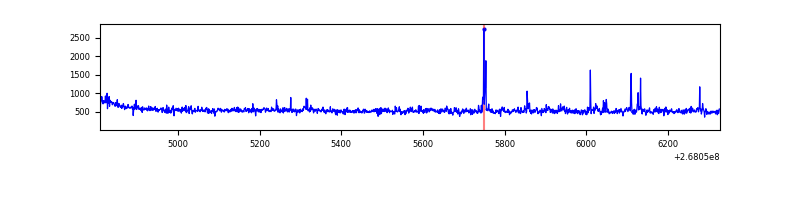 |
| B | 1519 | 1519 | 3 | 3 | 0.20% | 0.20% | 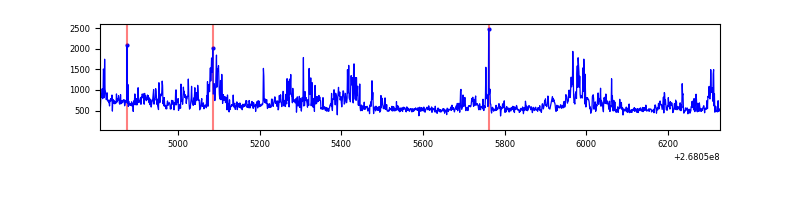 |
| C | 1519 | 1519 | 0 | 0 | 0.00% | 0.00% | 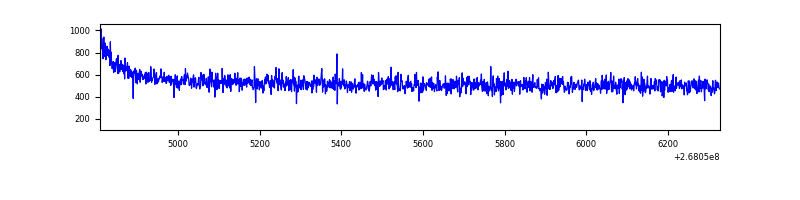 |
| D | 1519 | 1519 | 0 | 0 | 0.00% | 0.00% | 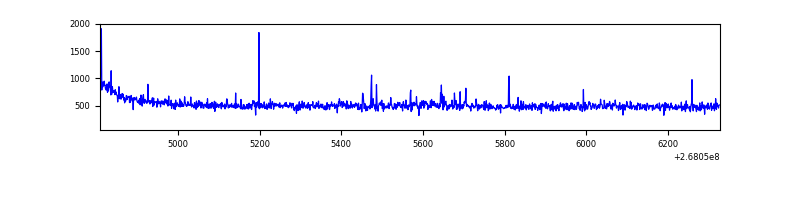 |
Top three noisy pixels from each quadrant. If the there are fewer than three noisy pixels in the level2.evt file, extra rows are filled as -1
| Pixel properties | Quadrant properties | ||||||
|---|---|---|---|---|---|---|---|
| Quadrant | DetID | PixID | Counts | Sigma | Mean | Median | Sigma |
| A | 14 | 237 | 29570 | 686.24 | 208 | 204 | 42.8 |
| A | 9 | 143 | 8307 | 189.36 | 208 | 204 | 42.8 |
| A | 0 | 226 | 1890 | 39.4 | 208 | 204 | 42.8 |
| B | 3 | 64 | 168541 | 4196.76 | 203 | 198 | 40.1 |
| B | 0 | 189 | 47913 | 1189.53 | 203 | 198 | 40.1 |
| B | 0 | 229 | 9995 | 244.24 | 203 | 198 | 40.1 |
| C | 3 | 233 | 28476 | 604.23 | 197 | 199 | 46.8 |
| C | 13 | 61 | 1429 | 26.28 | 197 | 199 | 46.8 |
| C | 3 | 232 | 585 | 8.25 | 197 | 199 | 46.8 |
| D | 7 | 254 | 11531 | 232.99 | 198 | 194 | 48.7 |
| D | 13 | 104 | 10178 | 205.18 | 198 | 194 | 48.7 |
| D | 10 | 199 | 5359 | 106.15 | 198 | 194 | 48.7 |
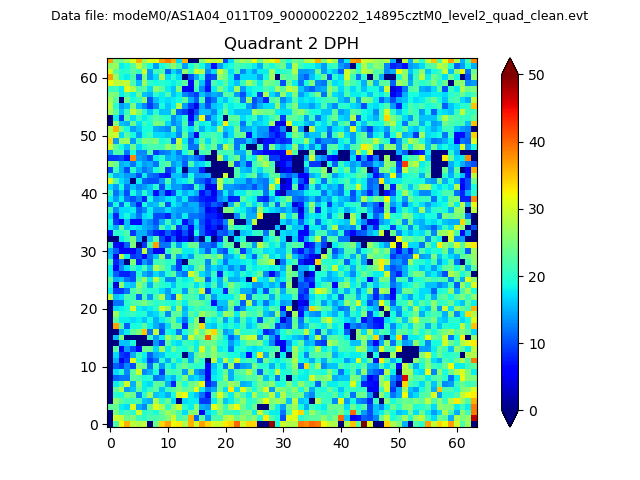
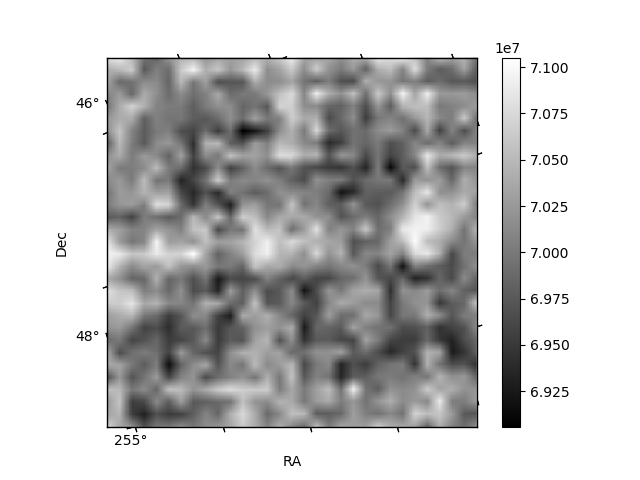
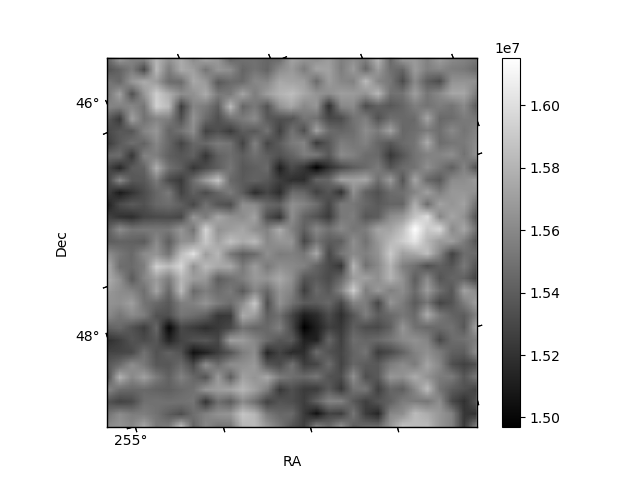
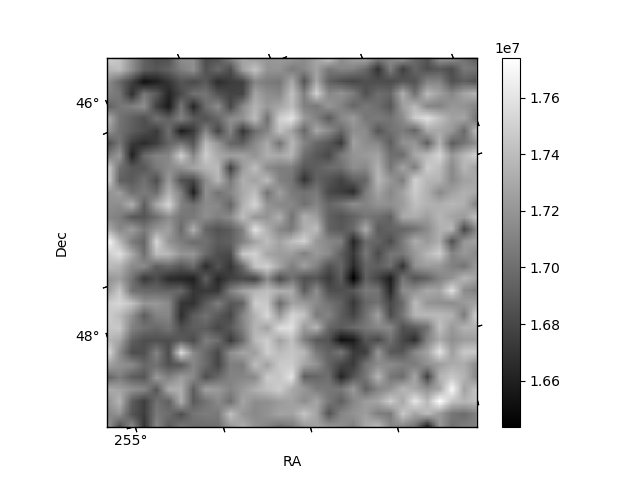
Histogram calculated using DETX and DETY for each event in the final _common_clean file
| Quadrant A | 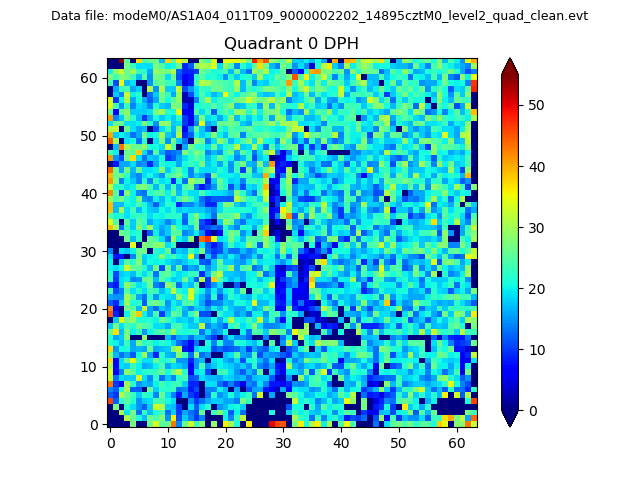 |
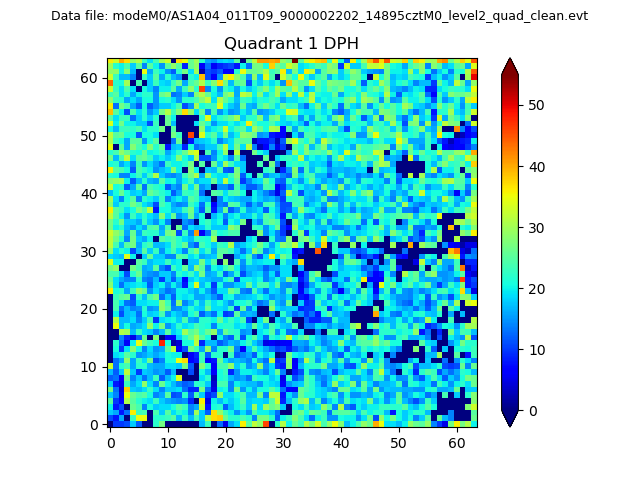 |
Quadrant B |
|---|---|---|---|
| Quadrant D | 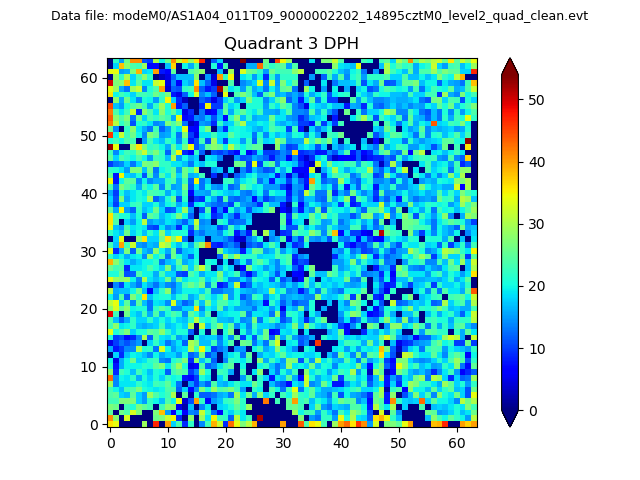 |
 |
Quadrant C |
| Plot type | Count rate plots | Images |
|---|---|---|
| Comparison with Poisson distribution Blue bars denote a histogram of data divided into 1 sec bins. Red curve is a Poisson curve with rate = median count rate of data. |
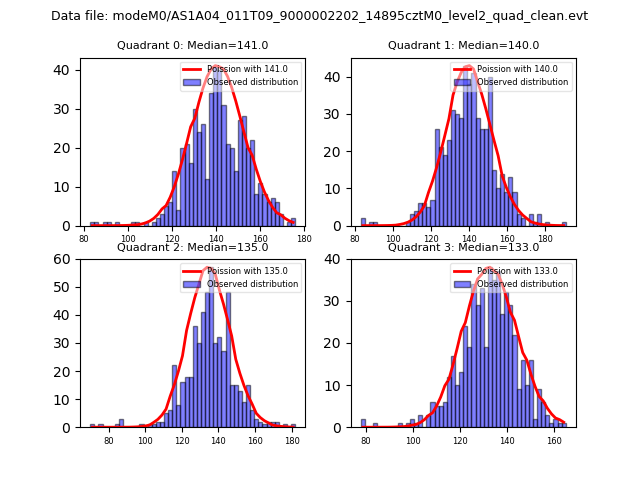 |
 |
| Quadrant-wise count rates Data is divided into 100 sec bins |
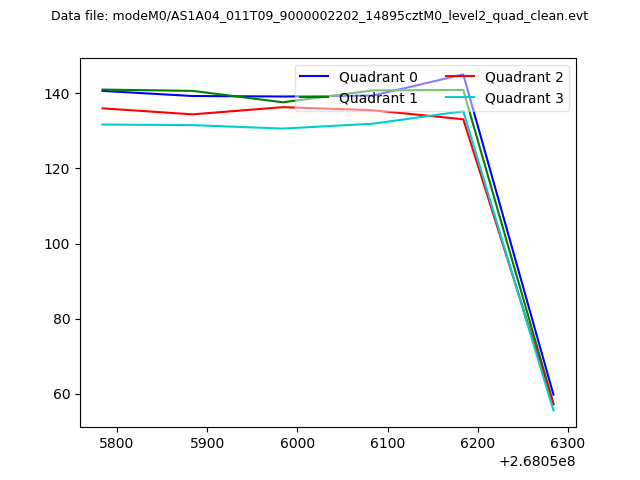 |
|
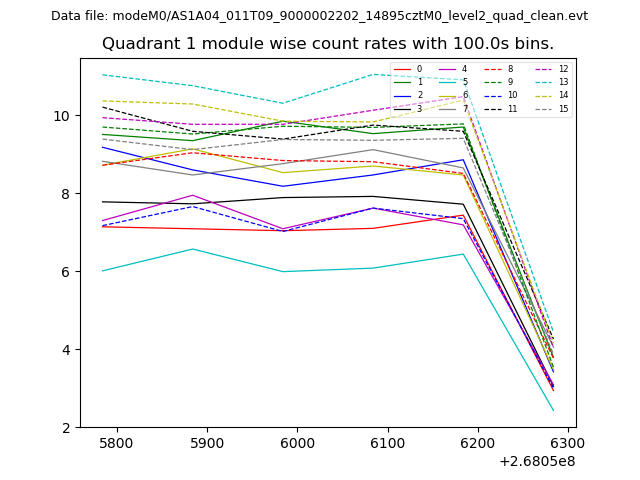
| Module-wise count rates for Quadrant A Data is divided into 100 sec bins |
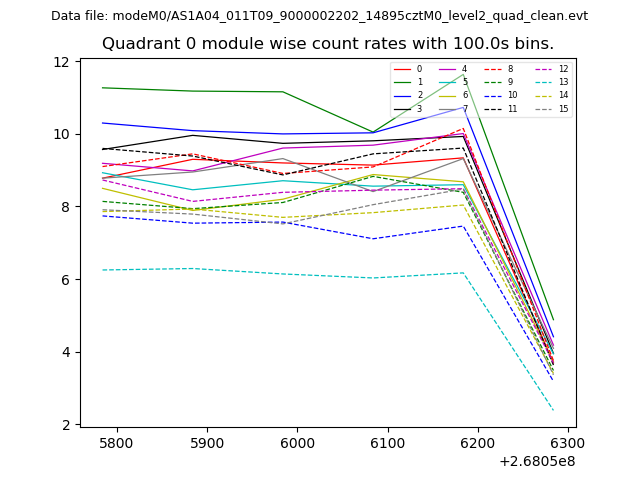 |
 |
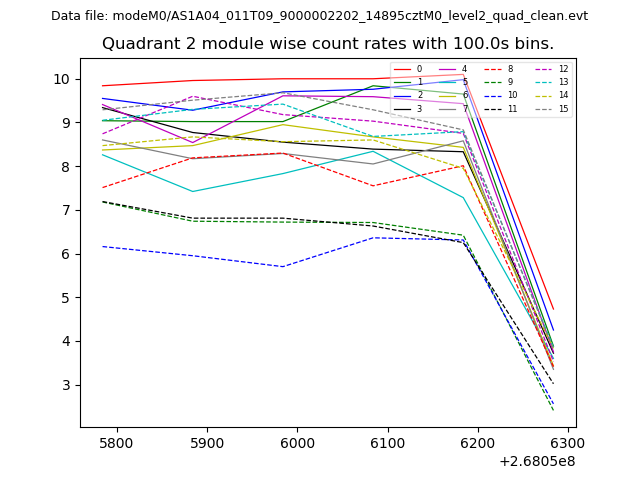
| Module-wise count rates for Quadrant B Data is divided into 100 sec bins |
 |
 |
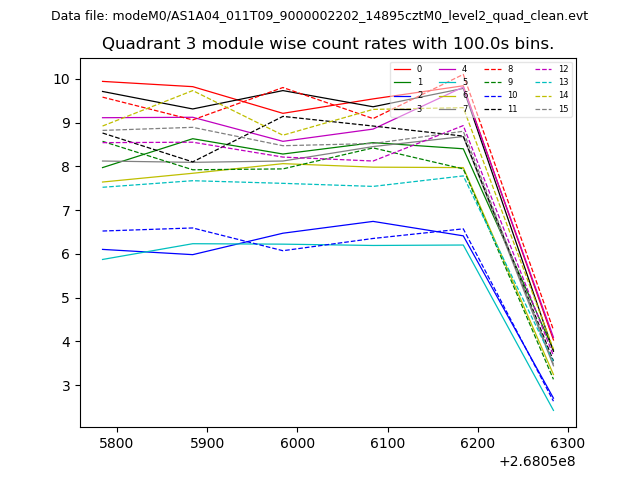
| Module-wise count rates for Quadrant C Data is divided into 100 sec bins |
 |
 |
| Module-wise count rates for Quadrant D Data is divided into 100 sec bins |
 |
 |
| Parameter | Plot |
|---|---|
| CZT HV Monitor | 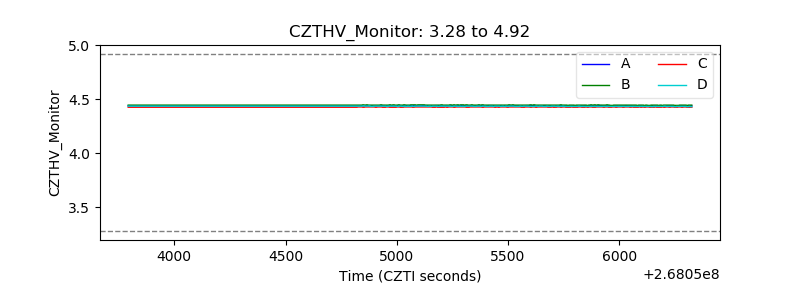 |
| D_VDD | 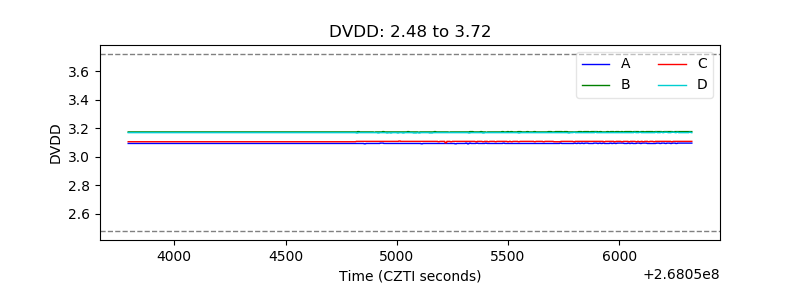 |
| Temperature 1 | 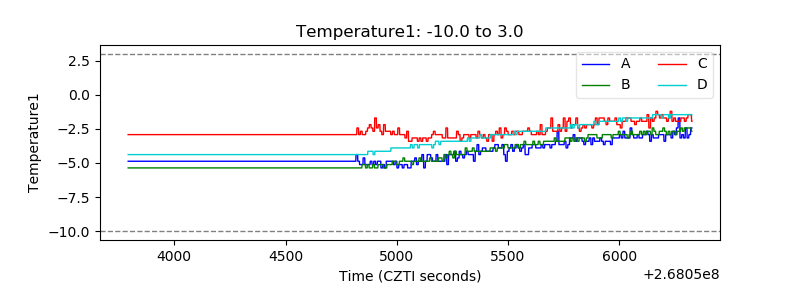 |
| Veto HV Monitor | 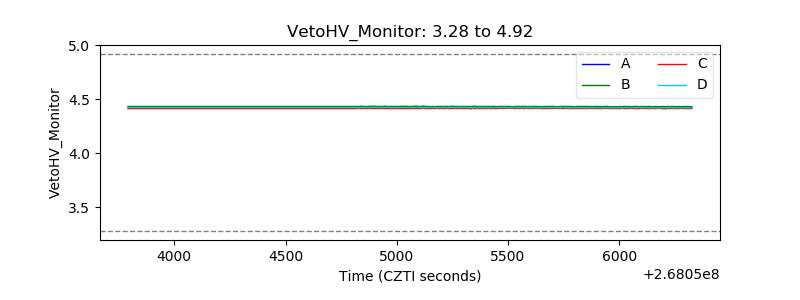 |
| Veto LLD | 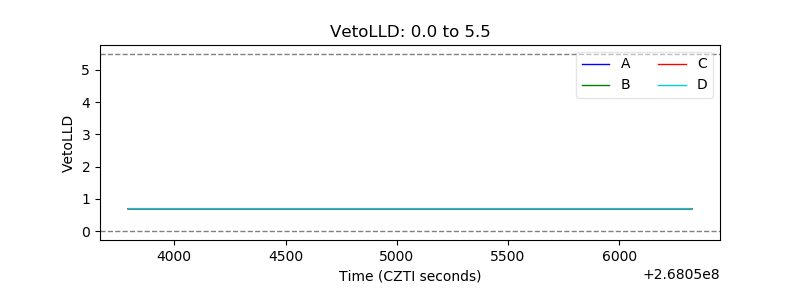 |
| Alpha Counter | 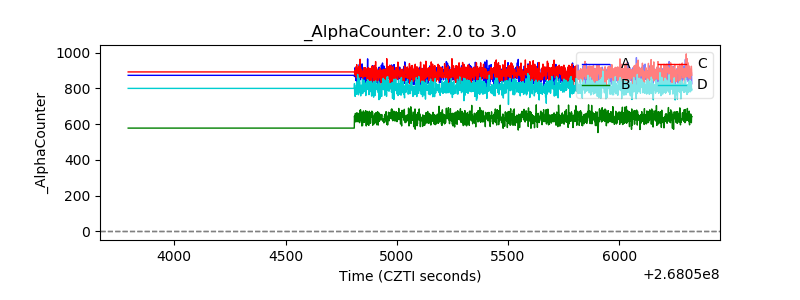 |
| _CPM_Rate | 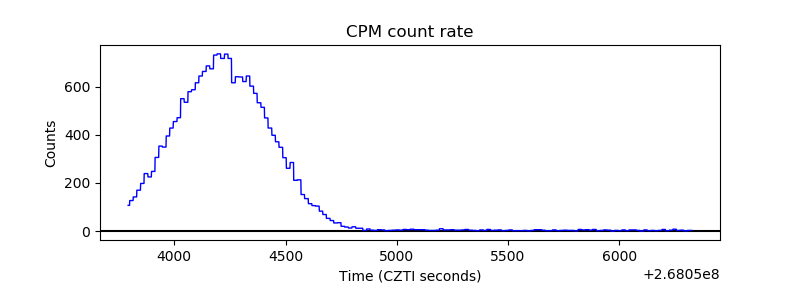 |
| CZT Counter | 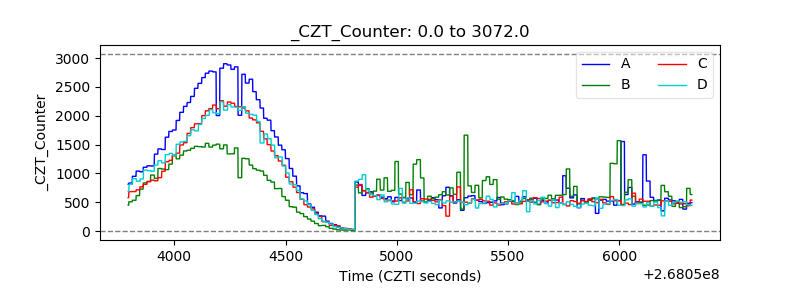 |
| +2.5 Volts monitor | 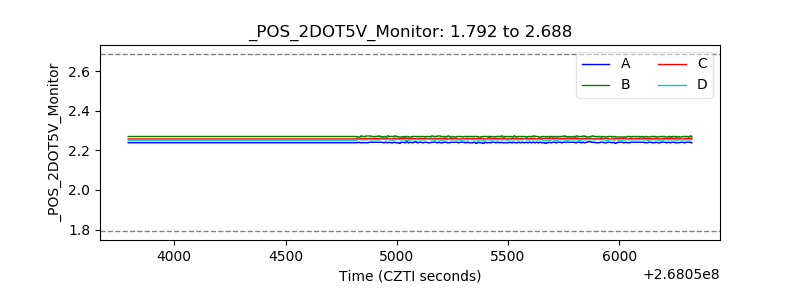 |
| +5 Volts monitor |  |
| _ROLL_ROT | 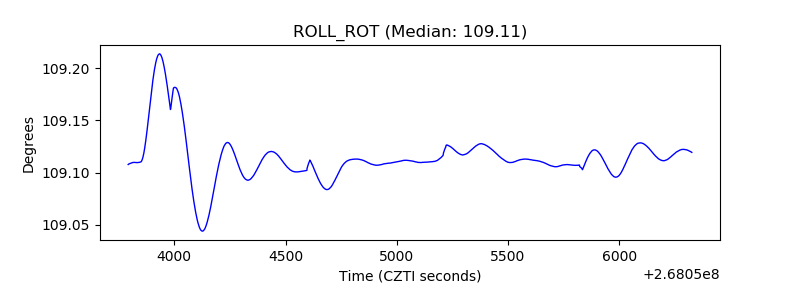 |
| _Roll_DEC | 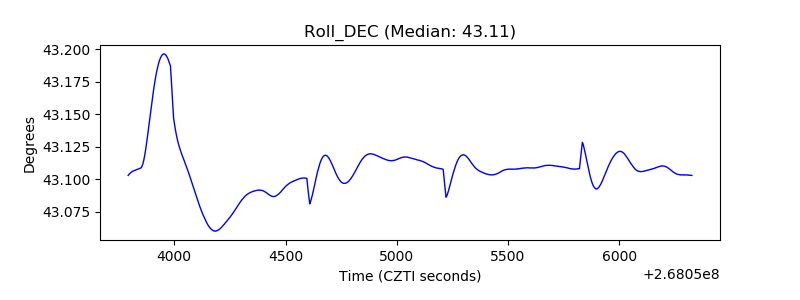 |
| _Roll_RA | 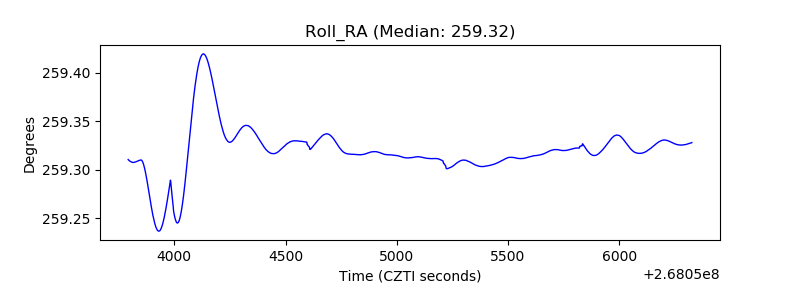 |
| Veto Counter | 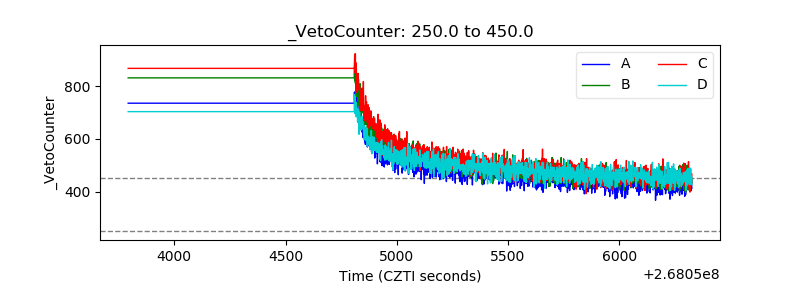 |