| Param | Original file | Final file |
|---|---|---|
| Filename | modeM0/AS1A04_011T09_9000002202_14896cztM0_level2.evt | modeM0/AS1A04_011T09_9000002202_14896cztM0_level2_quad_clean.evt |
| Size (bytes) | 535,890,240 | 99,757,440 |
| Size | 511.1 MB | 95.1 MB |
| Events in quadrant A | 3,668,823 | 667,198 |
| Events in quadrant B | 5,207,601 | 603,045 |
| Events in quadrant C | 3,419,476 | 634,228 |
| Events in quadrant D | 3,470,504 | 641,354 |
| Mode M9 | |||
|---|---|---|---|
| Quadrant | BADHDUFLAG | Total packets | Discarded packets |
| A | 0 | 18 | 0 |
| B | 0 | 18 | 0 |
| C | 0 | 18 | 0 |
| D | 0 | 19 | 0 |
| Mode M0 | |||
|---|---|---|---|
| Quadrant | BADHDUFLAG | Total packets | Discarded packets |
| A | 0 | 14938 | 3 |
| B | 0 | 20009 | 2 |
| C | 0 | 14184 | 2 |
| D | 0 | 14560 | 2 |
| Mode SS | |||
|---|---|---|---|
| Quadrant | BADHDUFLAG | Total packets | Discarded packets |
| A | 0 | 138 | 0 |
| B | 0 | 138 | 0 |
| C | 0 | 138 | 0 |
| D | 0 | 138 | 0 |
| Quadrant | Total seconds | Saturated seconds | Saturation percentage |
|---|---|---|---|
| A | 6819 | 158 | 2.317055% |
| B | 6819 | 843 | 12.362516% |
| C | 6819 | 123 | 1.803784% |
| D | 6819 | 144 | 2.111747% |
Noise dominated data is calculated using 1-second bins in cleaned event files. If a bin has >2000 counts, and if more than 50% of those come from <1% of pixels, then it is considered to be noise-dominated and hence unusable.
| Quadrant | # 1 sec bins | Bins with >0 counts | Bins with >2000 counts | High rate bins dominated by noise | Noise dominated (total time) | Noise dominated (detector-on time) | Marked lightcurve |
|---|---|---|---|---|---|---|---|
| A | 7810 | 6822 | 3 | 3 | 0.04% | 0.04% | 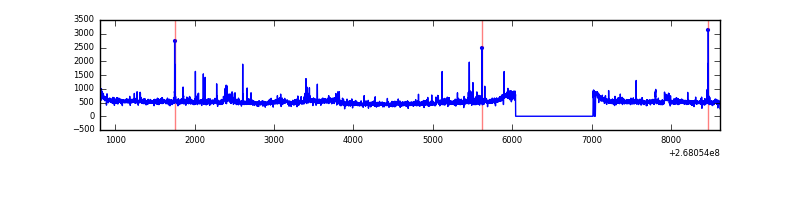 |
| B | 7810 | 6822 | 517 | 517 | 6.62% | 7.58% | 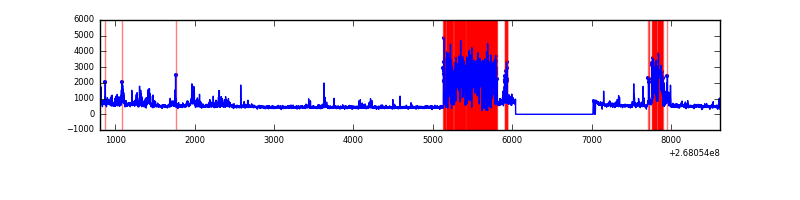 |
| C | 7810 | 6822 | 0 | 0 | 0.00% | 0.00% | 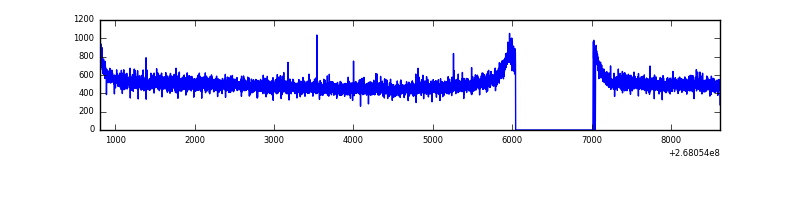 |
| D | 7810 | 6822 | 17 | 17 | 0.22% | 0.25% | 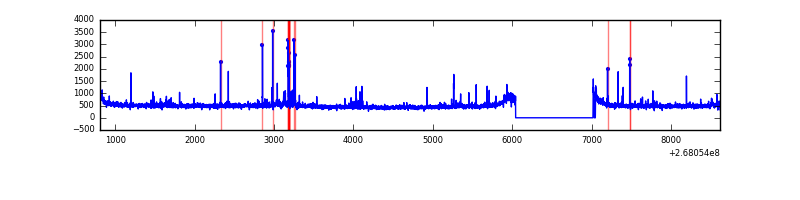 |
Top three noisy pixels from each quadrant. If the there are fewer than three noisy pixels in the level2.evt file, extra rows are filled as -1
| Pixel properties | Quadrant properties | ||||||
|---|---|---|---|---|---|---|---|
| Quadrant | DetID | PixID | Counts | Sigma | Mean | Median | Sigma |
| A | 14 | 237 | 136436 | 767.58 | 874 | 857 | 176.6 |
| A | 12 | 189 | 118114 | 663.85 | 874 | 857 | 176.6 |
| A | 11 | 29 | 23545 | 128.45 | 874 | 857 | 176.6 |
| B | 3 | 64 | 1747423 | 11383.83 | 805 | 783 | 153.4 |
| B | 0 | 189 | 118297 | 765.9 | 805 | 783 | 153.4 |
| B | 0 | 229 | 113682 | 735.83 | 805 | 783 | 153.4 |
| C | 3 | 233 | 142903 | 730.04 | 839 | 841 | 194.6 |
| C | 13 | 61 | 6098 | 27.01 | 839 | 841 | 194.6 |
| C | 3 | 232 | 3081 | 11.51 | 839 | 841 | 194.6 |
| D | 7 | 254 | 121830 | 605.25 | 848 | 826 | 199.9 |
| D | 13 | 104 | 87128 | 431.67 | 848 | 826 | 199.9 |
| D | 2 | 234 | 24303 | 117.43 | 848 | 826 | 199.9 |
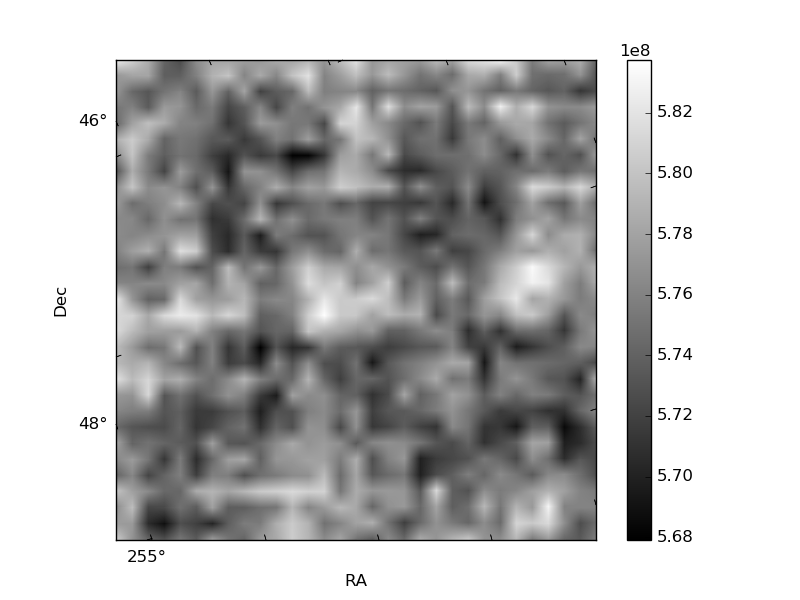
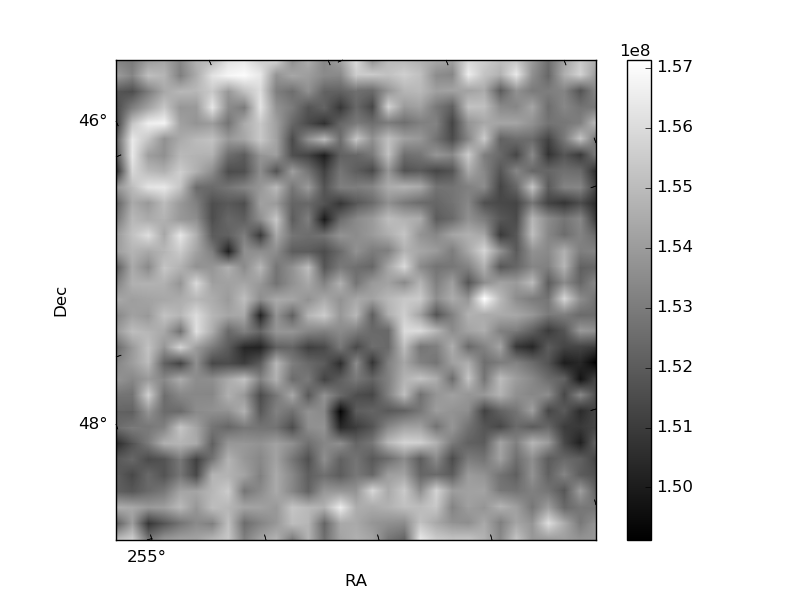
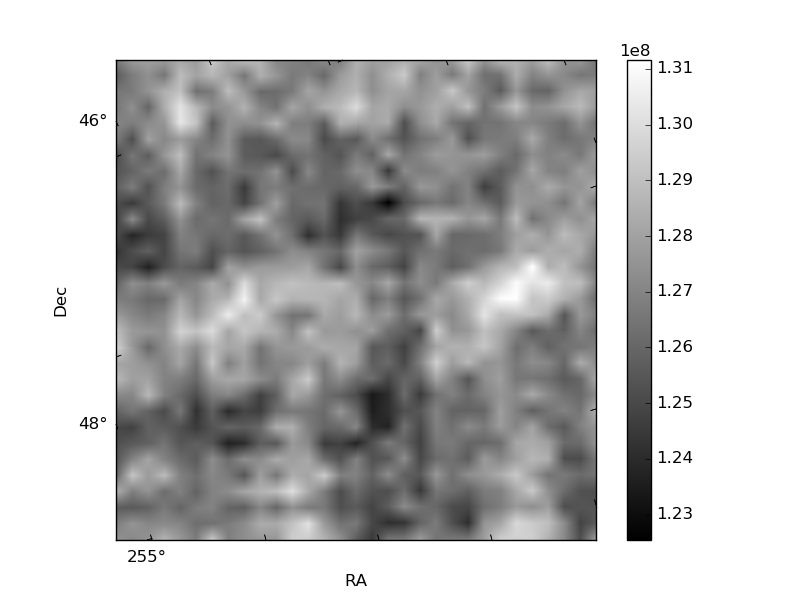
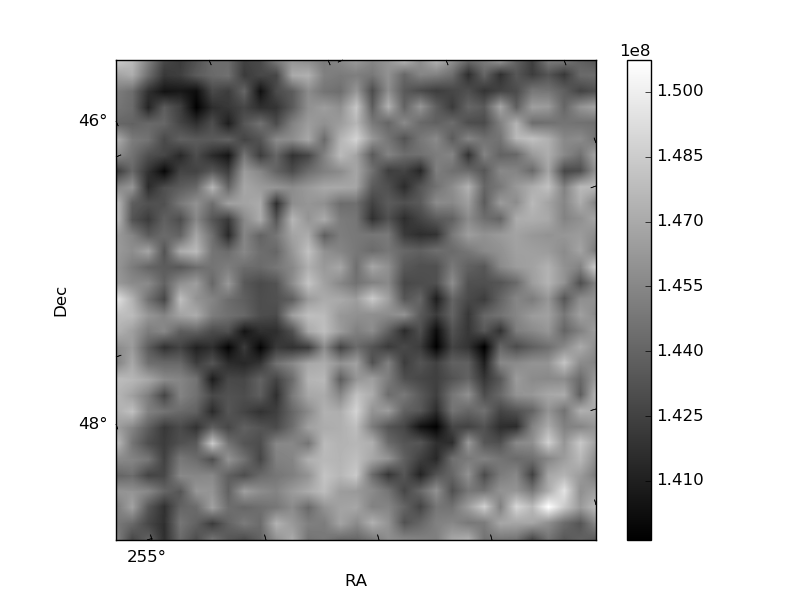
Histogram calculated using DETX and DETY for each event in the final _common_clean file
| Quadrant A | 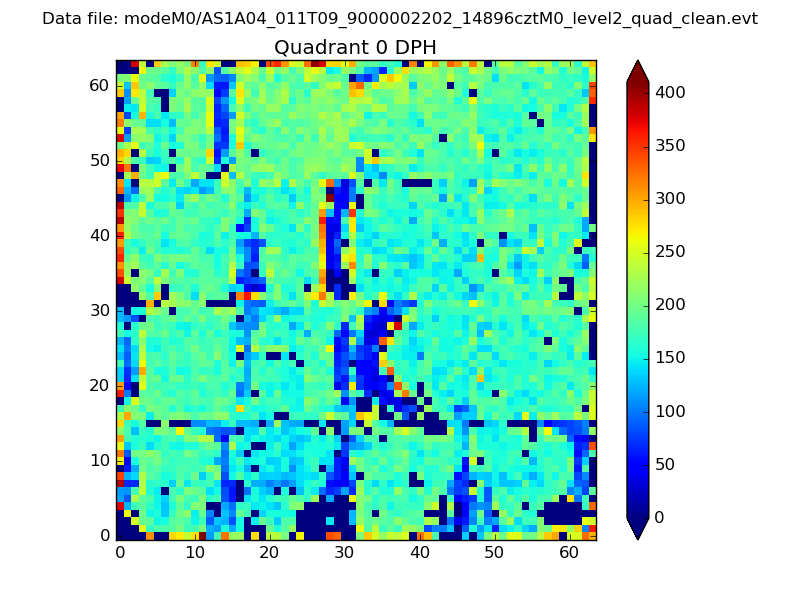 |
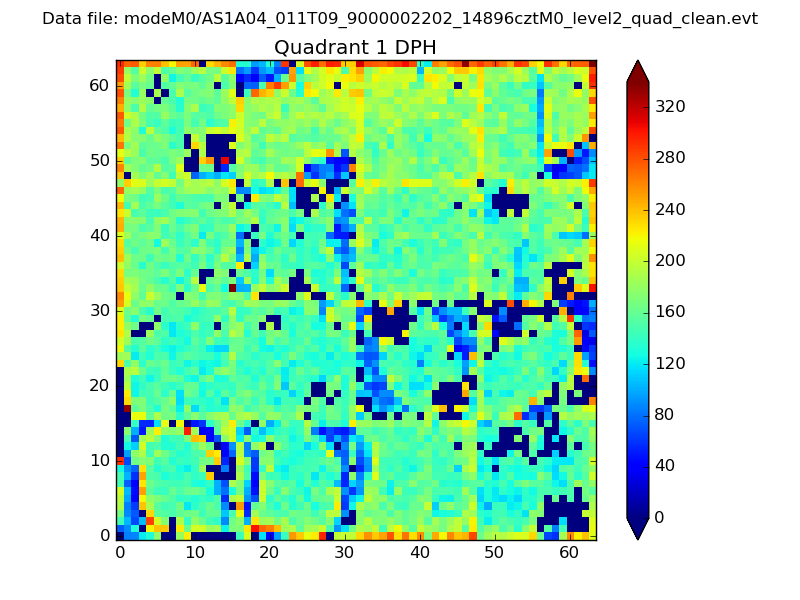 |
Quadrant B |
|---|---|---|---|
| Quadrant D | 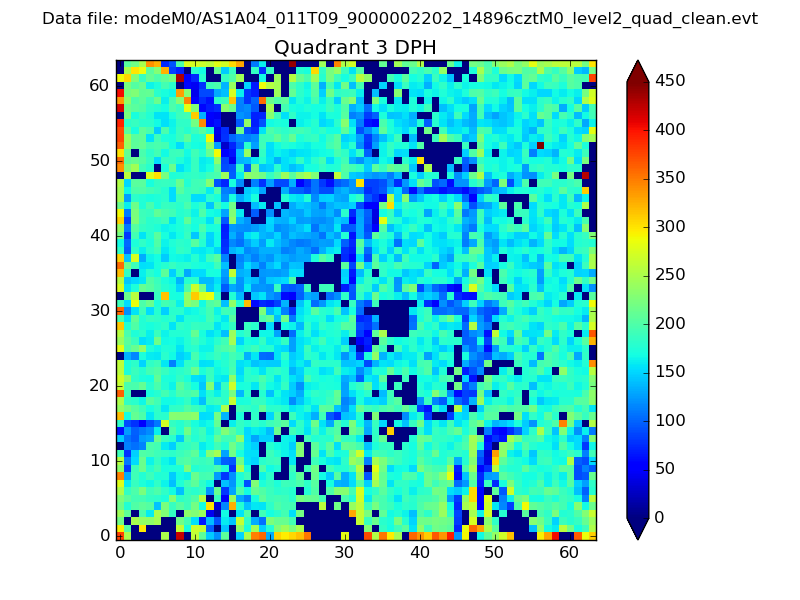 |
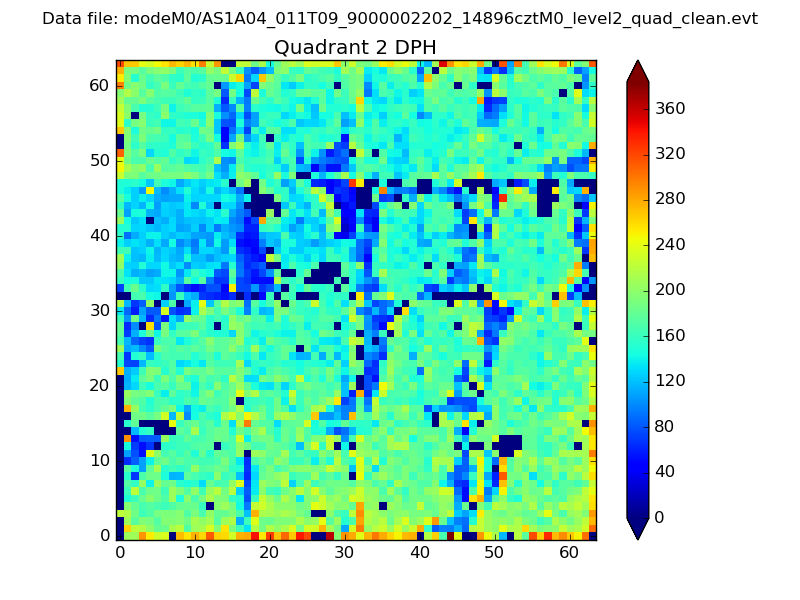 |
Quadrant C |
| Plot type | Count rate plots | Images |
|---|---|---|
| Comparison with Poisson distribution Blue bars denote a histogram of data divided into 1 sec bins. Red curve is a Poisson curve with rate = median count rate of data. |
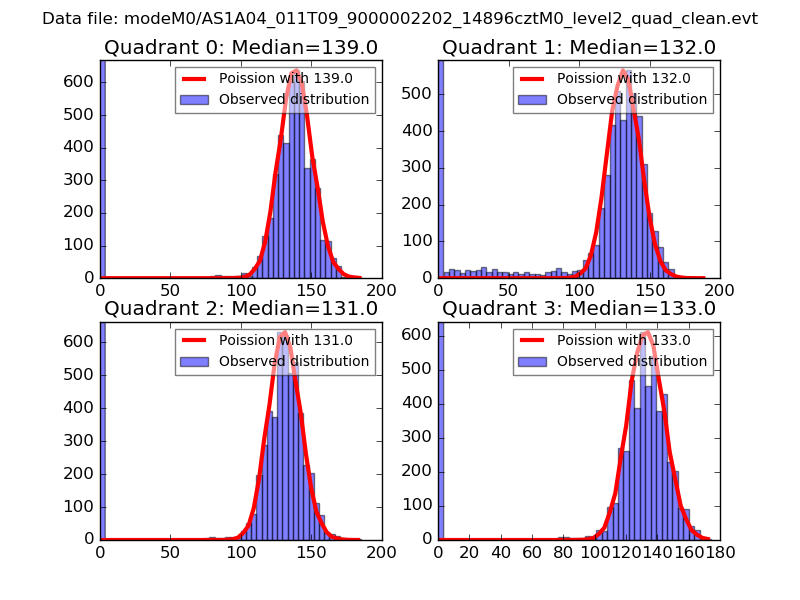 |
 |
| Quadrant-wise count rates Data is divided into 100 sec bins |
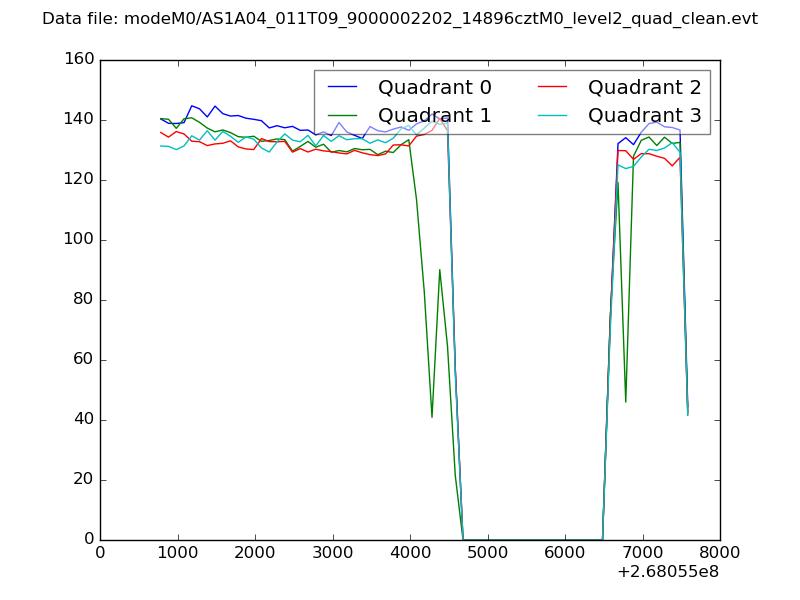 |
|
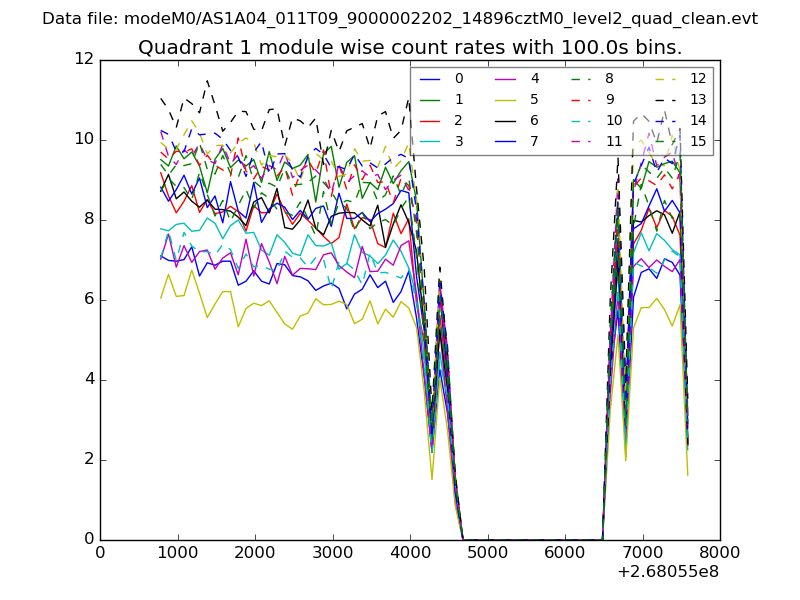
| Module-wise count rates for Quadrant A Data is divided into 100 sec bins |
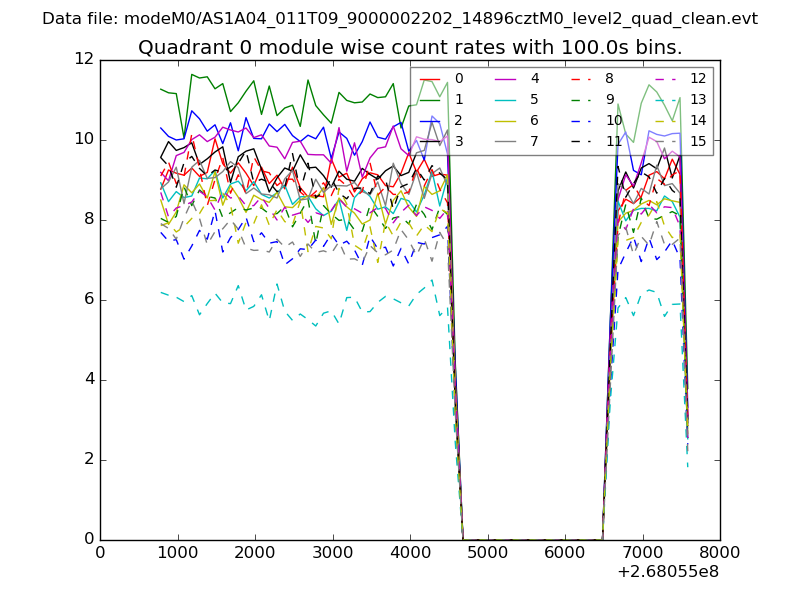 |
 |
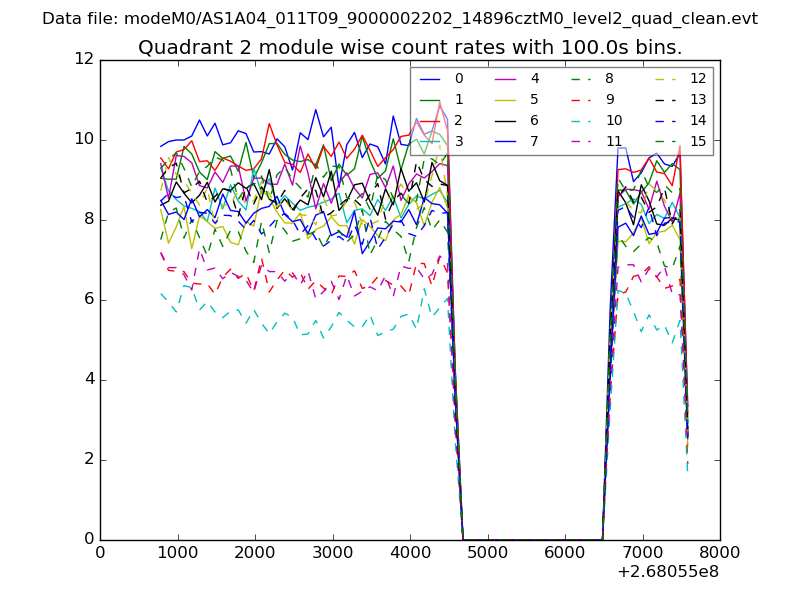
| Module-wise count rates for Quadrant B Data is divided into 100 sec bins |
 |
 |
| Module-wise count rates for Quadrant C Data is divided into 100 sec bins |
 |
 |
| Module-wise count rates for Quadrant D Data is divided into 100 sec bins |
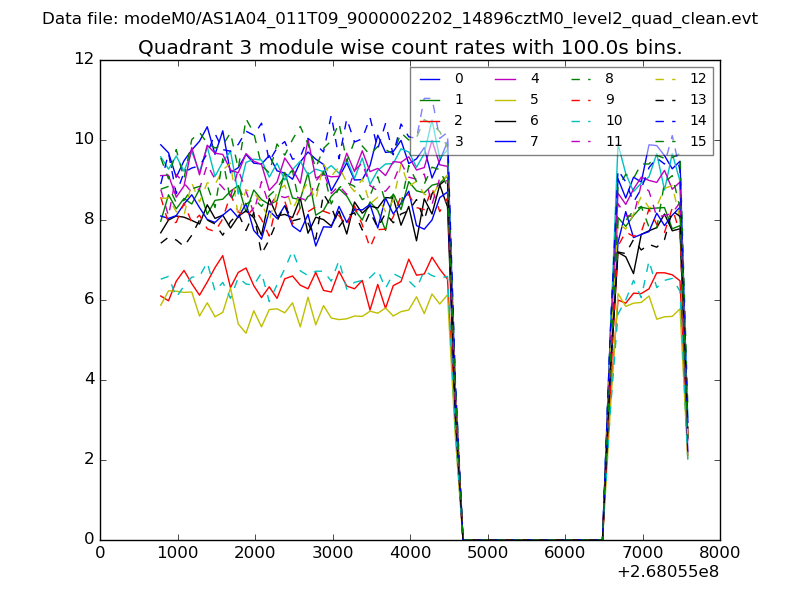 |
 |
| Parameter | Plot |
|---|---|
| CZT HV Monitor | 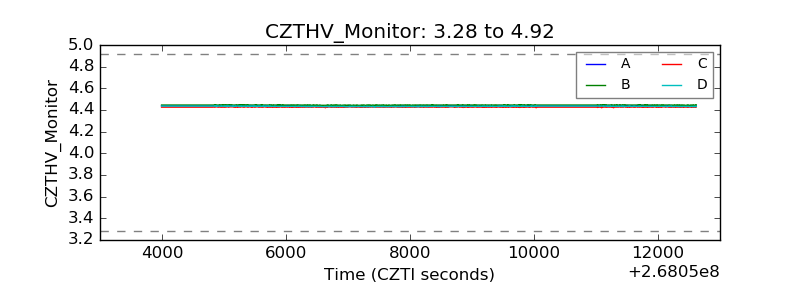 |
| D_VDD | 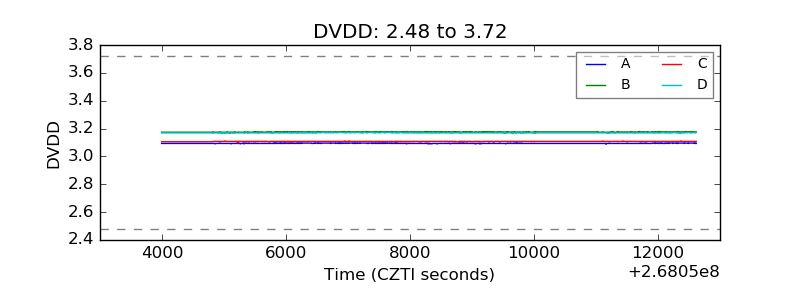 |
| Temperature 1 | 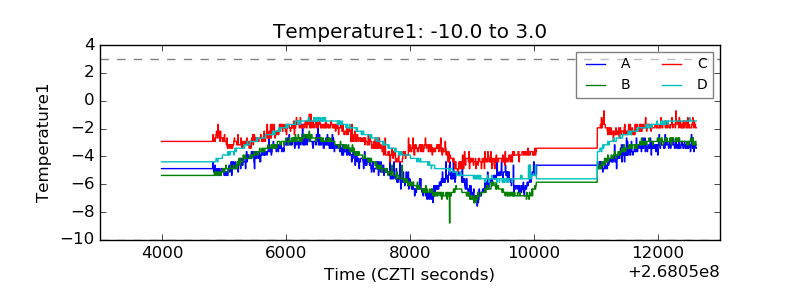 |
| Veto HV Monitor | 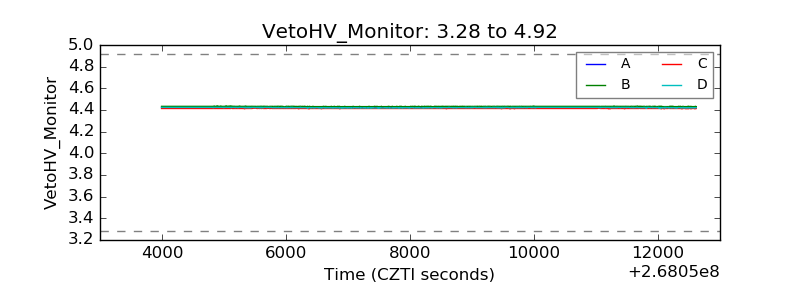 |
| Veto LLD | 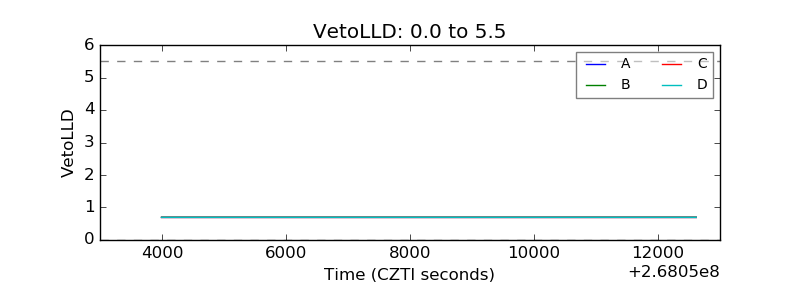 |
| Alpha Counter | 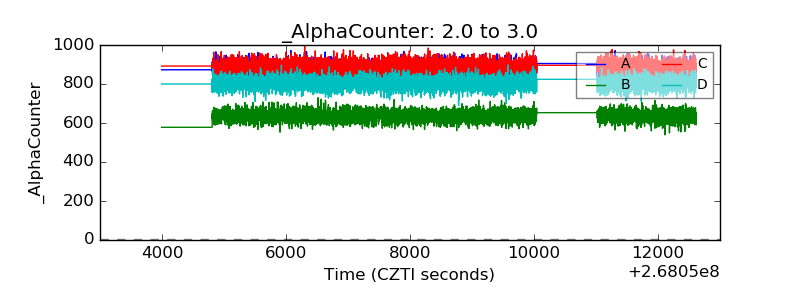 |
| _CPM_Rate | 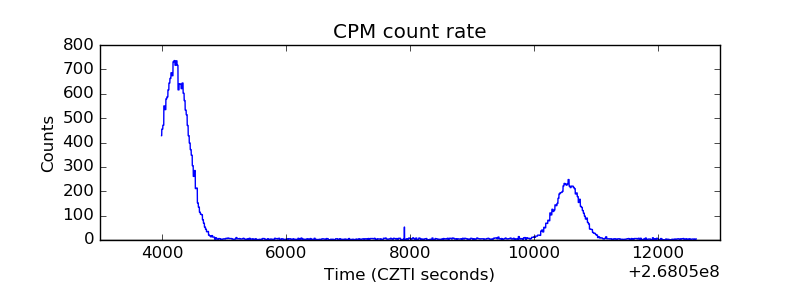 |
| CZT Counter | 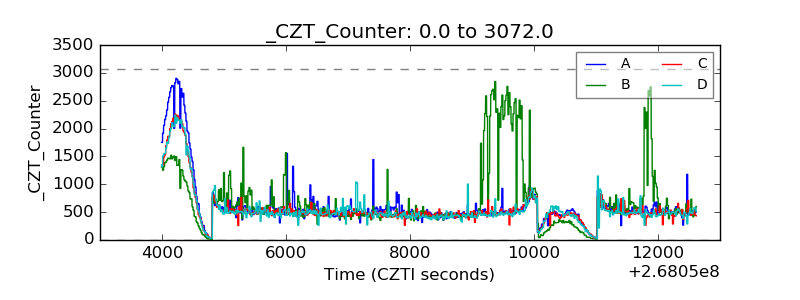 |
| +2.5 Volts monitor |  |
| +5 Volts monitor | 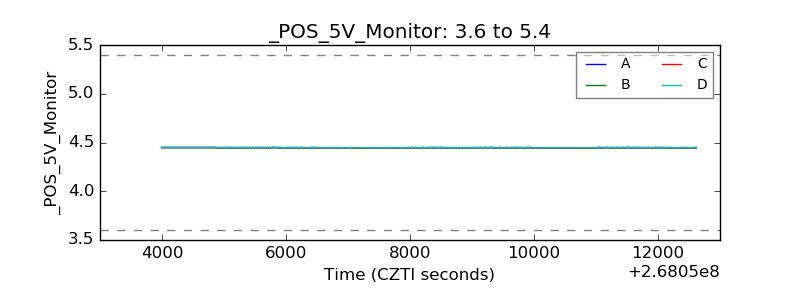 |
| _ROLL_ROT | 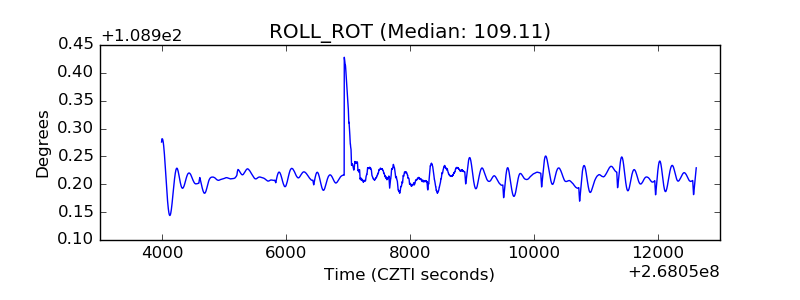 |
| _Roll_DEC |  |
| _Roll_RA | 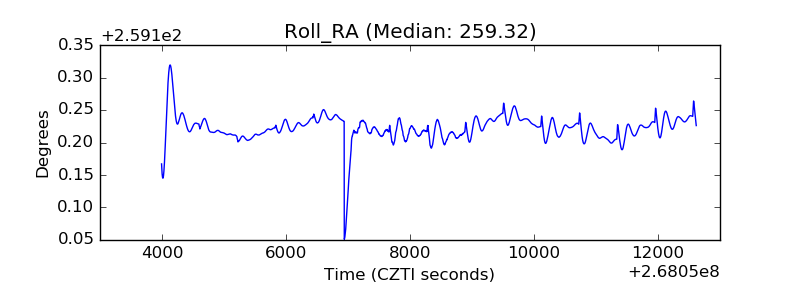 |
| Veto Counter | 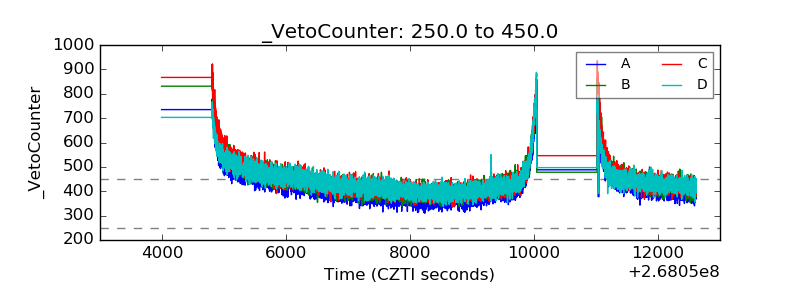 |