| Param | Original file | Final file |
|---|---|---|
| Filename | modeM0/AS1A04_011T09_9000002202_14897cztM0_level2.evt | modeM0/AS1A04_011T09_9000002202_14897cztM0_level2_quad_clean.evt |
| Size (bytes) | 539,769,600 | 101,350,080 |
| Size | 514.8 MB | 96.7 MB |
| Events in quadrant A | 3,162,825 | 681,125 |
| Events in quadrant B | 6,018,566 | 636,692 |
| Events in quadrant C | 3,129,024 | 646,364 |
| Events in quadrant D | 3,594,468 | 651,129 |
| Mode M9 | |||
|---|---|---|---|
| Quadrant | BADHDUFLAG | Total packets | Discarded packets |
| A | 0 | 6 | 0 |
| B | 0 | 6 | 0 |
| C | 0 | 6 | 0 |
| D | 0 | 6 | 0 |
| Mode M0 | |||
|---|---|---|---|
| Quadrant | BADHDUFLAG | Total packets | Discarded packets |
| A | 0 | 13552 | 2 |
| B | 0 | 22219 | 1 |
| C | 0 | 13328 | 1 |
| D | 0 | 15007 | 1 |
| Mode SS | |||
|---|---|---|---|
| Quadrant | BADHDUFLAG | Total packets | Discarded packets |
| A | 0 | 134 | 0 |
| B | 0 | 134 | 0 |
| C | 0 | 134 | 0 |
| D | 0 | 134 | 0 |
| Quadrant | Total seconds | Saturated seconds | Saturation percentage |
|---|---|---|---|
| A | 6504 | 86 | 1.322263% |
| B | 6504 | 1354 | 20.817958% |
| C | 6504 | 75 | 1.153137% |
| D | 6504 | 120 | 1.845018% |
Noise dominated data is calculated using 1-second bins in cleaned event files. If a bin has >2000 counts, and if more than 50% of those come from <1% of pixels, then it is considered to be noise-dominated and hence unusable.
| Quadrant | # 1 sec bins | Bins with >0 counts | Bins with >2000 counts | High rate bins dominated by noise | Noise dominated (total time) | Noise dominated (detector-on time) | Marked lightcurve |
|---|---|---|---|---|---|---|---|
| A | 7135 | 6506 | 1 | 1 | 0.01% | 0.02% | 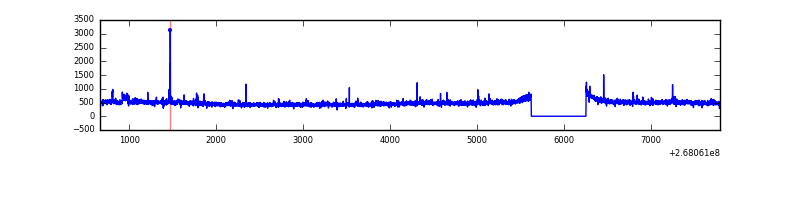 |
| B | 7135 | 6506 | 1035 | 1035 | 14.51% | 15.91% | 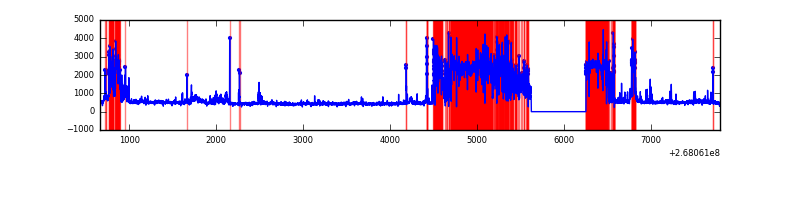 |
| C | 7135 | 6506 | 0 | 0 | 0.00% | 0.00% | 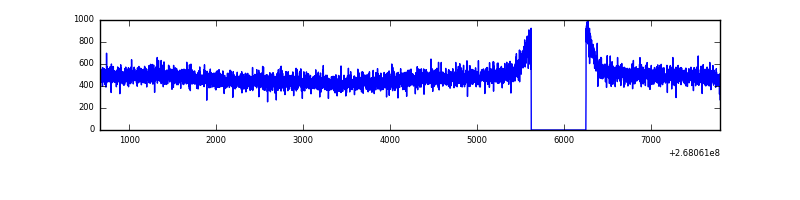 |
| D | 7135 | 6506 | 74 | 74 | 1.04% | 1.14% |  |
Top three noisy pixels from each quadrant. If the there are fewer than three noisy pixels in the level2.evt file, extra rows are filled as -1
| Pixel properties | Quadrant properties | ||||||
|---|---|---|---|---|---|---|---|
| Quadrant | DetID | PixID | Counts | Sigma | Mean | Median | Sigma |
| A | 12 | 189 | 57603 | 355.46 | 792 | 776 | 159.9 |
| A | 14 | 237 | 40261 | 246.98 | 792 | 776 | 159.9 |
| A | 4 | 2 | 8455 | 48.03 | 792 | 776 | 159.9 |
| B | 3 | 64 | 3087846 | 24437.78 | 661 | 642 | 126.3 |
| B | 0 | 229 | 172617 | 1361.32 | 661 | 642 | 126.3 |
| B | 0 | 189 | 70199 | 550.6 | 661 | 642 | 126.3 |
| C | 3 | 233 | 151893 | 854.12 | 763 | 766 | 176.9 |
| C | 13 | 61 | 5500 | 26.76 | 763 | 766 | 176.9 |
| C | 3 | 232 | 2006 | 7.01 | 763 | 766 | 176.9 |
| D | 7 | 254 | 559913 | 3062.76 | 769 | 750 | 182.6 |
| D | 13 | 104 | 87706 | 476.29 | 769 | 750 | 182.6 |
| D | 2 | 234 | 23541 | 124.84 | 769 | 750 | 182.6 |
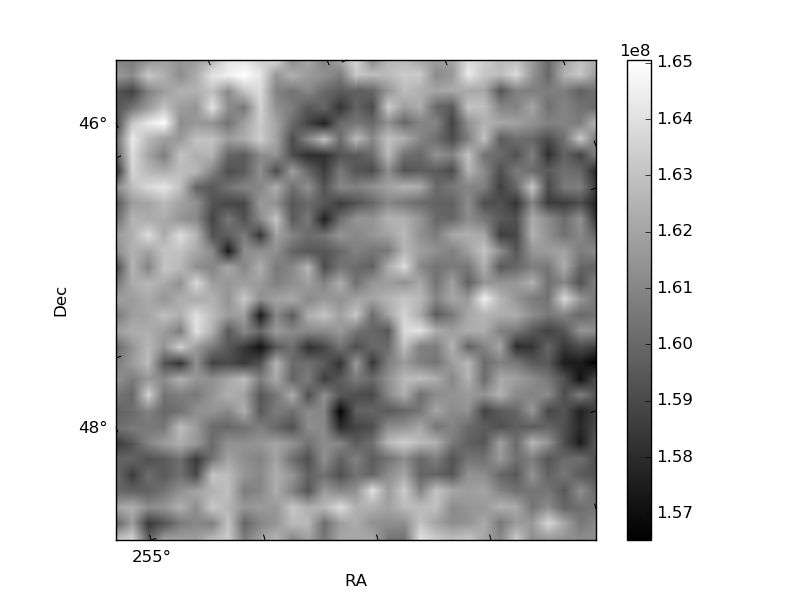
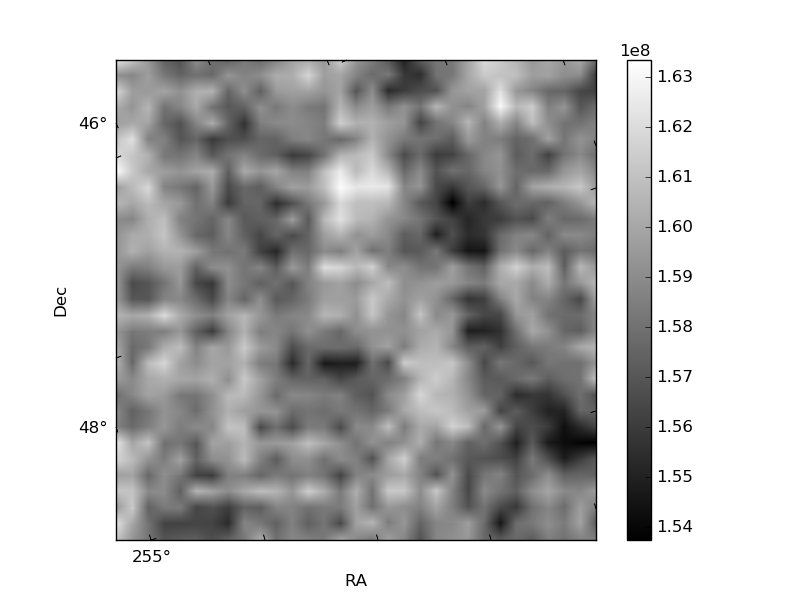
Histogram calculated using DETX and DETY for each event in the final _common_clean file
| Quadrant A | 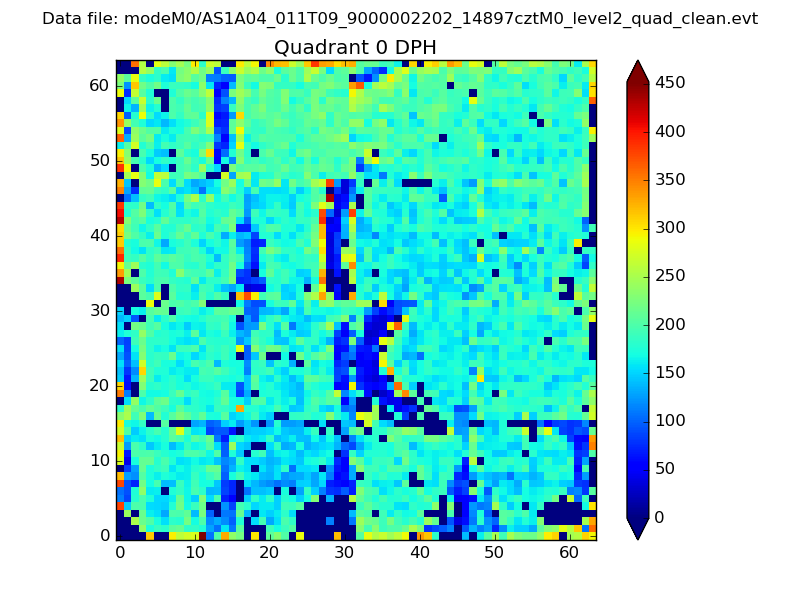 |
 |
Quadrant B |
|---|---|---|---|
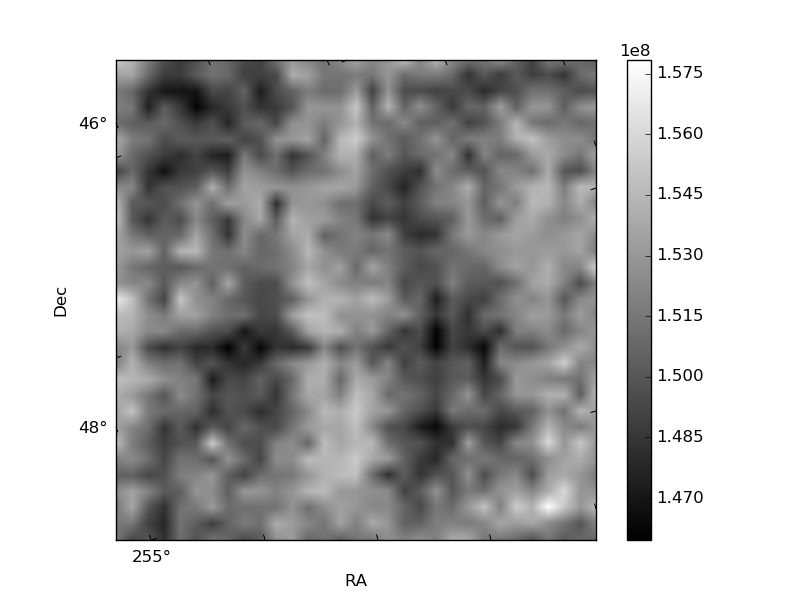
| Quadrant D |  |
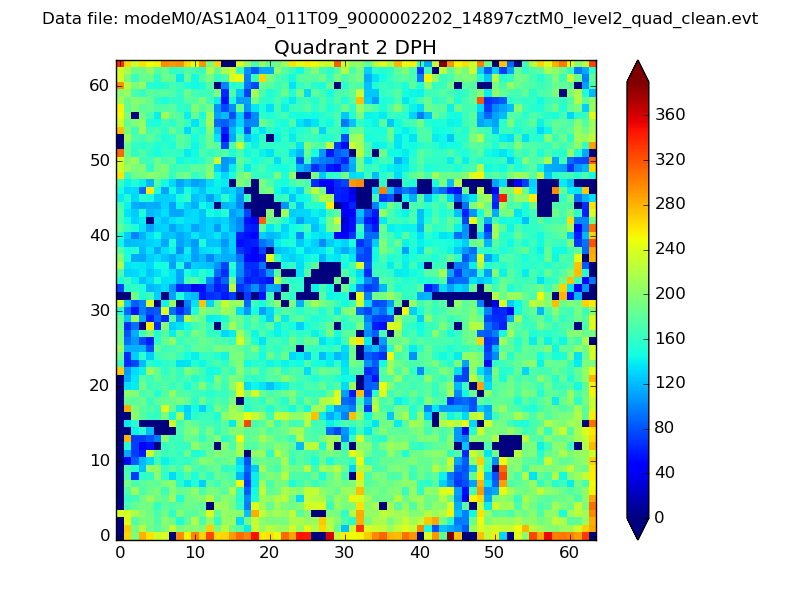 |
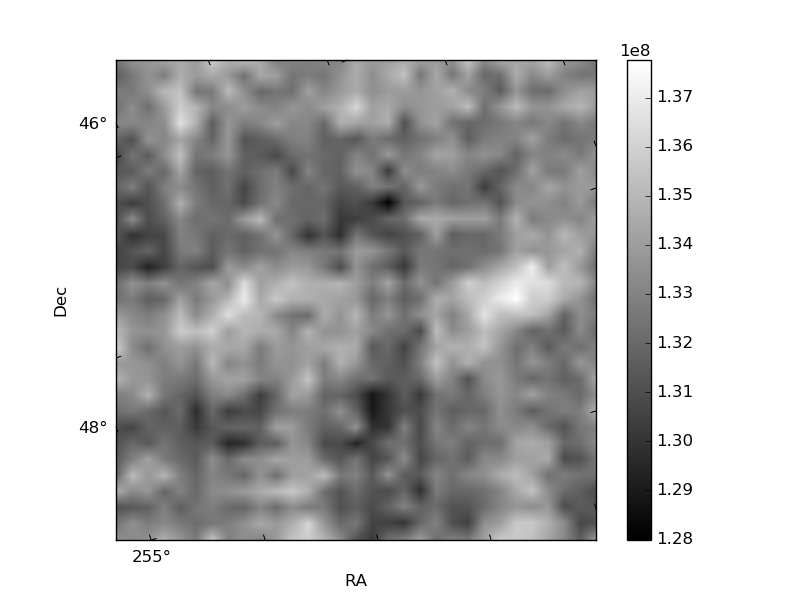
Quadrant C |
| Plot type | Count rate plots | Images |
|---|---|---|
| Comparison with Poisson distribution Blue bars denote a histogram of data divided into 1 sec bins. Red curve is a Poisson curve with rate = median count rate of data. |
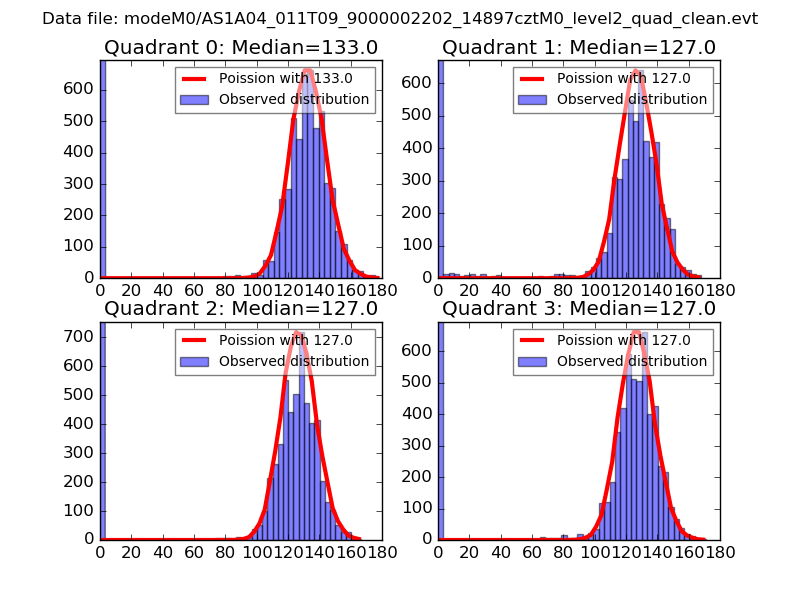 |
 |
| Quadrant-wise count rates Data is divided into 100 sec bins |
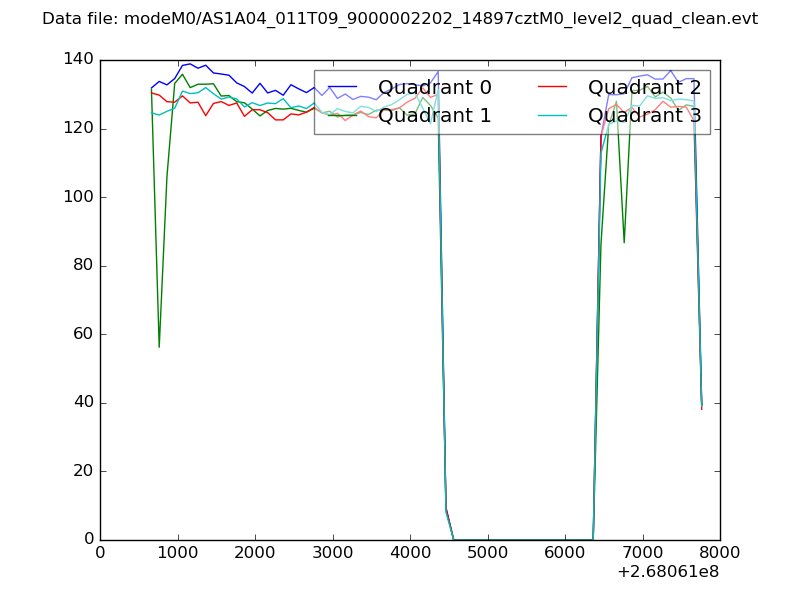 |
|
| Module-wise count rates for Quadrant A Data is divided into 100 sec bins |
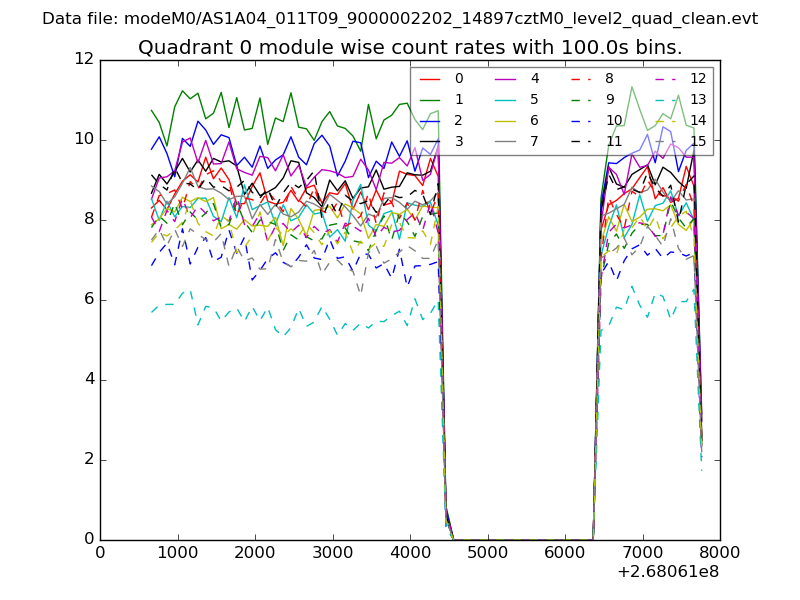 |
 |
| Module-wise count rates for Quadrant B Data is divided into 100 sec bins |
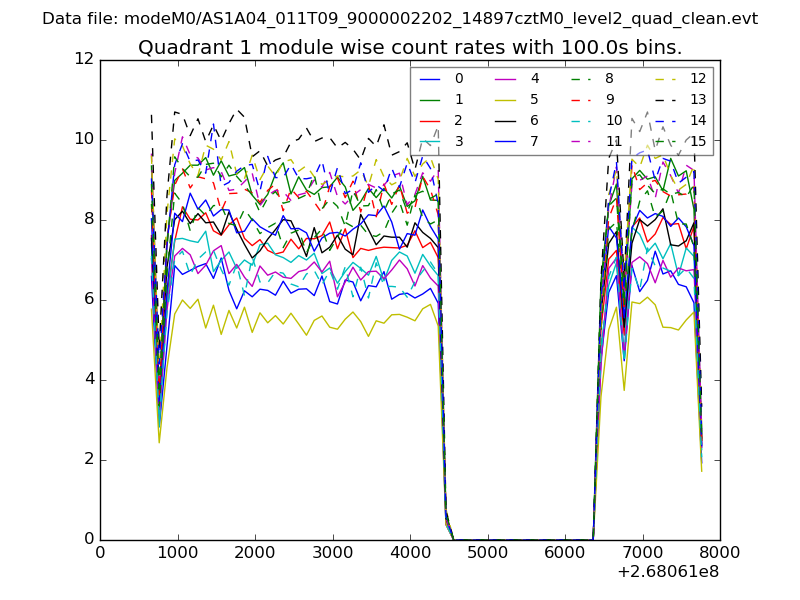 |
 |
| Module-wise count rates for Quadrant C Data is divided into 100 sec bins |
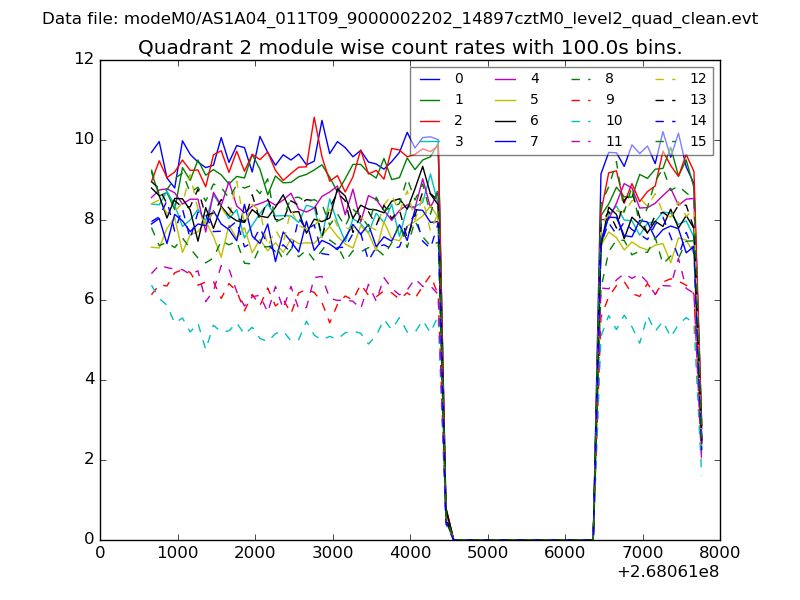 |
 |
| Module-wise count rates for Quadrant D Data is divided into 100 sec bins |
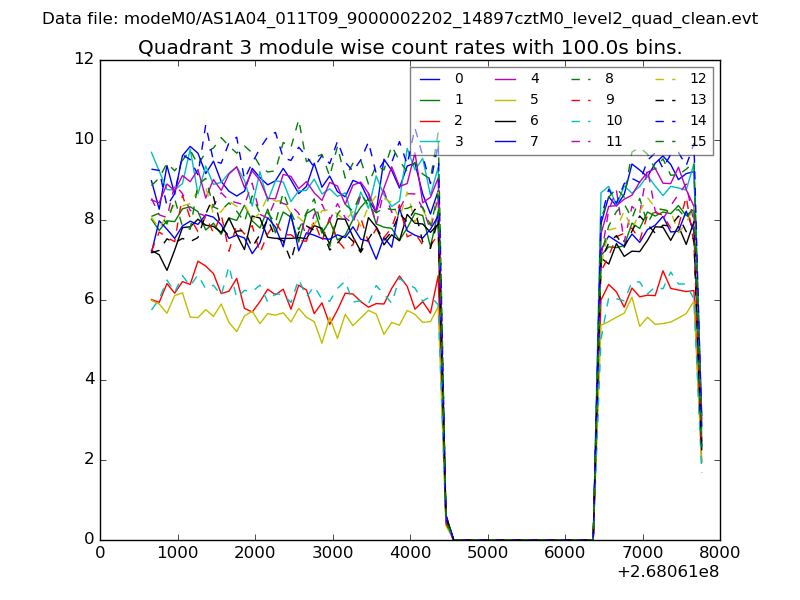 |
 |
| Parameter | Plot |
|---|---|
| CZT HV Monitor | 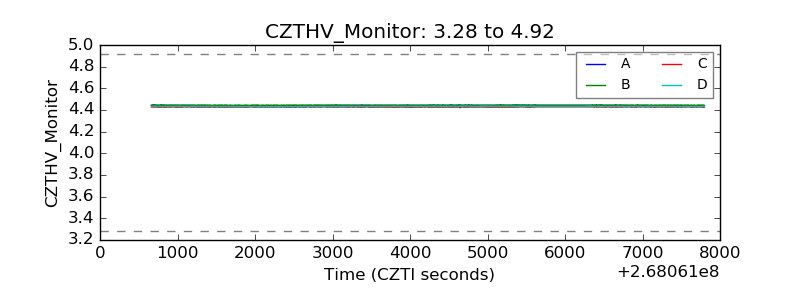 |
| D_VDD | 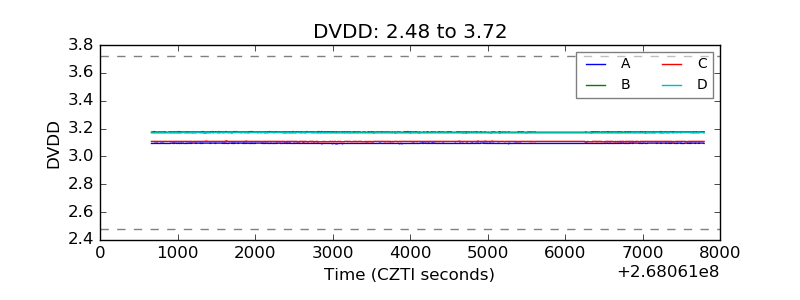 |
| Temperature 1 | 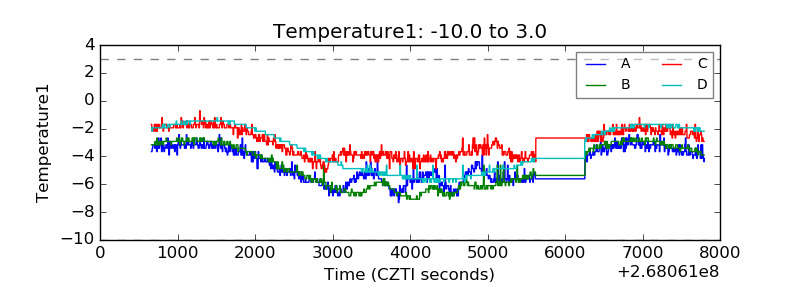 |
| Veto HV Monitor | 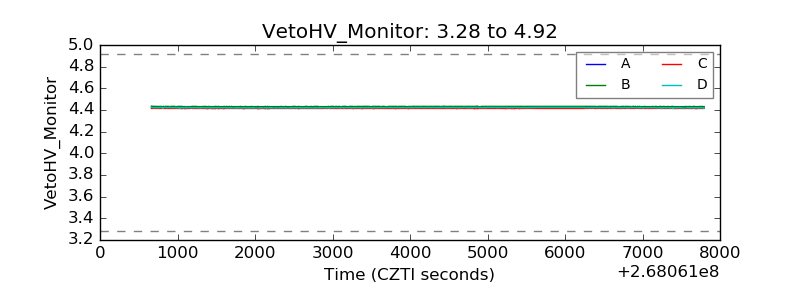 |
| Veto LLD |  |
| Alpha Counter | 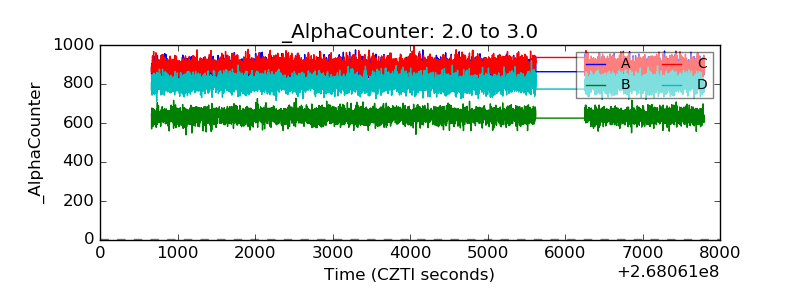 |
| _CPM_Rate | 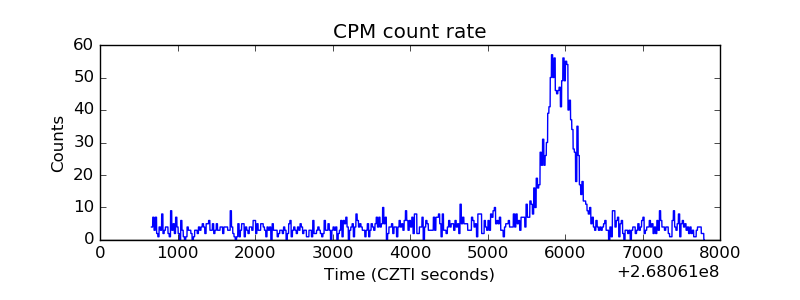 |
| CZT Counter | 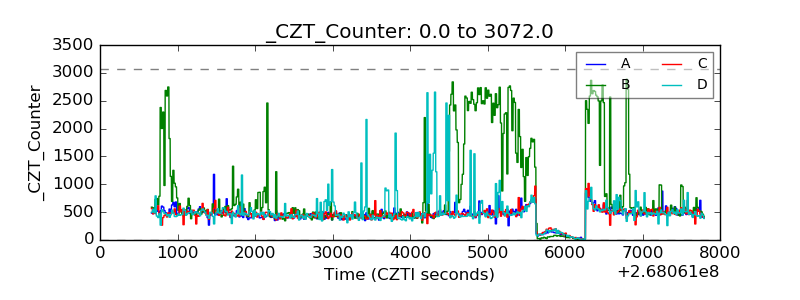 |
| +2.5 Volts monitor |  |
| +5 Volts monitor |  |
| _ROLL_ROT | 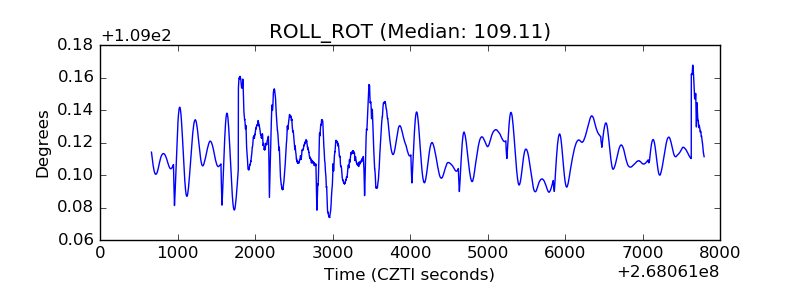 |
| _Roll_DEC | 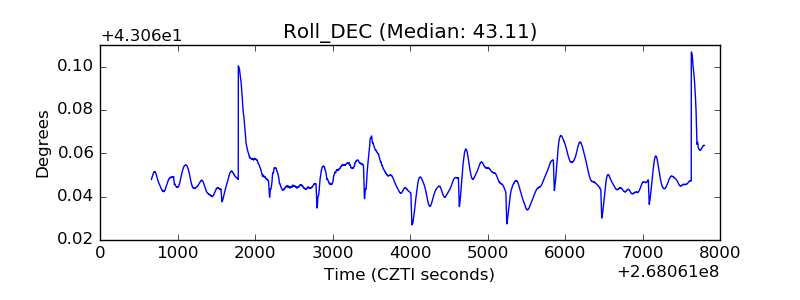 |
| _Roll_RA | 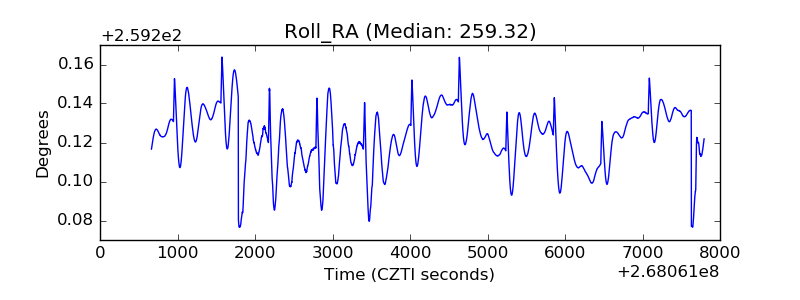 |
| Veto Counter | 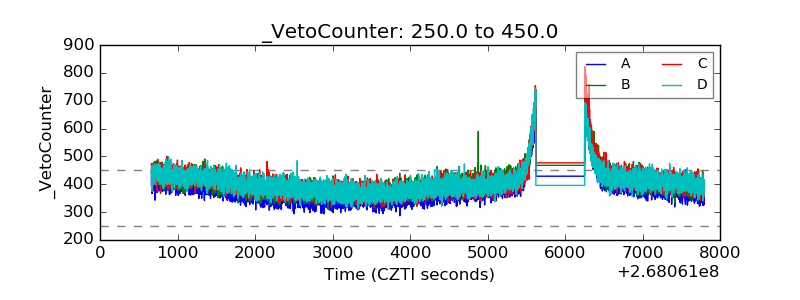 |