| Param | Original file | Final file |
|---|---|---|
| Filename | modeM0/AS1A04_011T09_9000002202_14898cztM0_level2.evt | modeM0/AS1A04_011T09_9000002202_14898cztM0_level2_quad_clean.evt |
| Size (bytes) | 583,030,080 | 106,384,320 |
| Size | 556.0 MB | 101.5 MB |
| Events in quadrant A | 3,782,280 | 701,094 |
| Events in quadrant B | 5,773,993 | 661,091 |
| Events in quadrant C | 3,690,865 | 666,468 |
| Events in quadrant D | 3,901,004 | 671,239 |
| Mode M9 | |||
|---|---|---|---|
| Quadrant | BADHDUFLAG | Total packets | Discarded packets |
| A | 0 | 7 | 0 |
| B | 0 | 7 | 0 |
| C | 0 | 7 | 0 |
| D | 0 | 7 | 0 |
| Mode M0 | |||
|---|---|---|---|
| Quadrant | BADHDUFLAG | Total packets | Discarded packets |
| A | 0 | 15978 | 3 |
| B | 0 | 22236 | 2 |
| C | 0 | 15665 | 2 |
| D | 0 | 16652 | 2 |
| Mode SS | |||
|---|---|---|---|
| Quadrant | BADHDUFLAG | Total packets | Discarded packets |
| A | 0 | 154 | 0 |
| B | 0 | 154 | 0 |
| C | 0 | 154 | 0 |
| D | 0 | 154 | 0 |
| Quadrant | Total seconds | Saturated seconds | Saturation percentage |
|---|---|---|---|
| A | 7493 | 135 | 1.801682% |
| B | 7493 | 941 | 12.558388% |
| C | 7493 | 101 | 1.347925% |
| D | 7493 | 127 | 1.694915% |
Noise dominated data is calculated using 1-second bins in cleaned event files. If a bin has >2000 counts, and if more than 50% of those come from <1% of pixels, then it is considered to be noise-dominated and hence unusable.
| Quadrant | # 1 sec bins | Bins with >0 counts | Bins with >2000 counts | High rate bins dominated by noise | Noise dominated (total time) | Noise dominated (detector-on time) | Marked lightcurve |
|---|---|---|---|---|---|---|---|
| A | 7754 | 7495 | 4 | 4 | 0.05% | 0.05% |  |
| B | 7754 | 7495 | 496 | 496 | 6.40% | 6.62% | 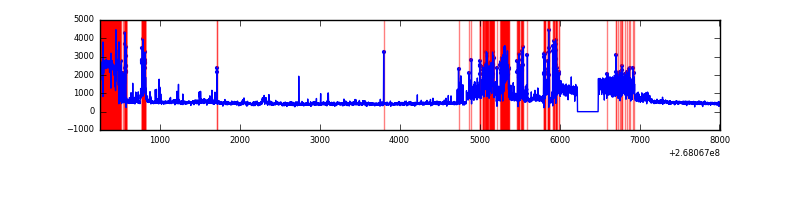 |
| C | 7754 | 7495 | 0 | 0 | 0.00% | 0.00% | 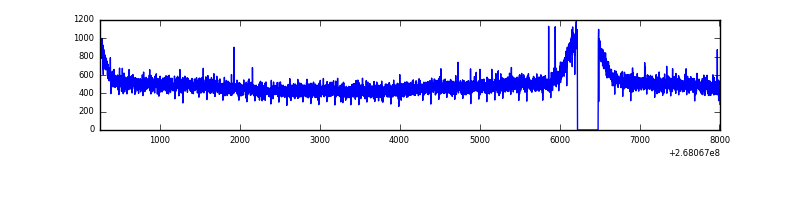 |
| D | 7754 | 7495 | 46 | 46 | 0.59% | 0.61% | 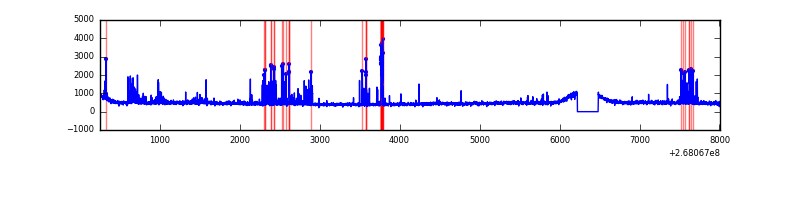 |
Top three noisy pixels from each quadrant. If the there are fewer than three noisy pixels in the level2.evt file, extra rows are filled as -1
| Pixel properties | Quadrant properties | ||||||
|---|---|---|---|---|---|---|---|
| Quadrant | DetID | PixID | Counts | Sigma | Mean | Median | Sigma |
| A | 12 | 189 | 109600 | 575.84 | 929 | 906 | 188.8 |
| A | 14 | 237 | 60800 | 317.31 | 929 | 906 | 188.8 |
| A | 9 | 143 | 20340 | 102.96 | 929 | 906 | 188.8 |
| B | 3 | 64 | 1384830 | 8489.2 | 848 | 824 | 163.0 |
| B | 10 | 16 | 762179 | 4669.99 | 848 | 824 | 163.0 |
| B | 0 | 189 | 164875 | 1006.25 | 848 | 824 | 163.0 |
| C | 3 | 233 | 186233 | 890.33 | 897 | 898 | 208.2 |
| C | 13 | 61 | 6262 | 25.77 | 897 | 898 | 208.2 |
| C | 10 | 22 | 3738 | 13.64 | 897 | 898 | 208.2 |
| D | 7 | 254 | 327013 | 1512.71 | 904 | 882 | 215.6 |
| D | 10 | 199 | 64251 | 293.93 | 904 | 882 | 215.6 |
| D | 13 | 104 | 46410 | 211.17 | 904 | 882 | 215.6 |
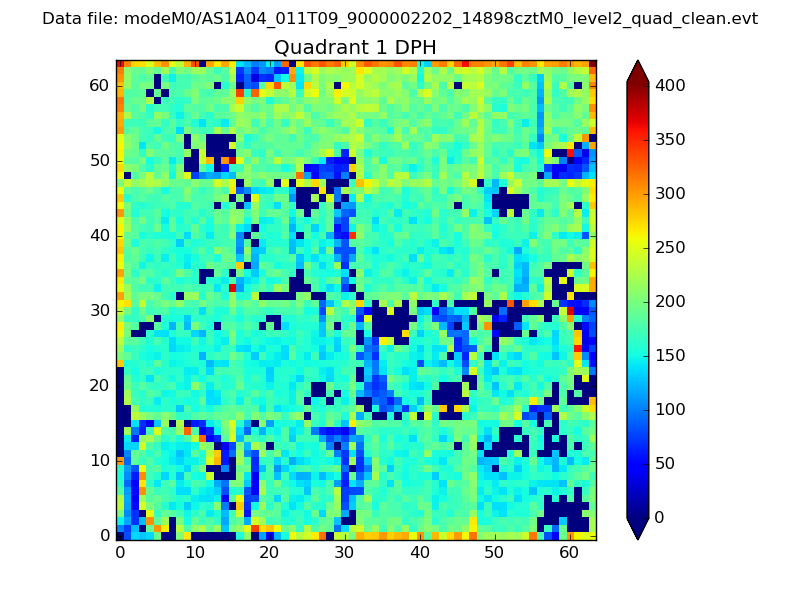
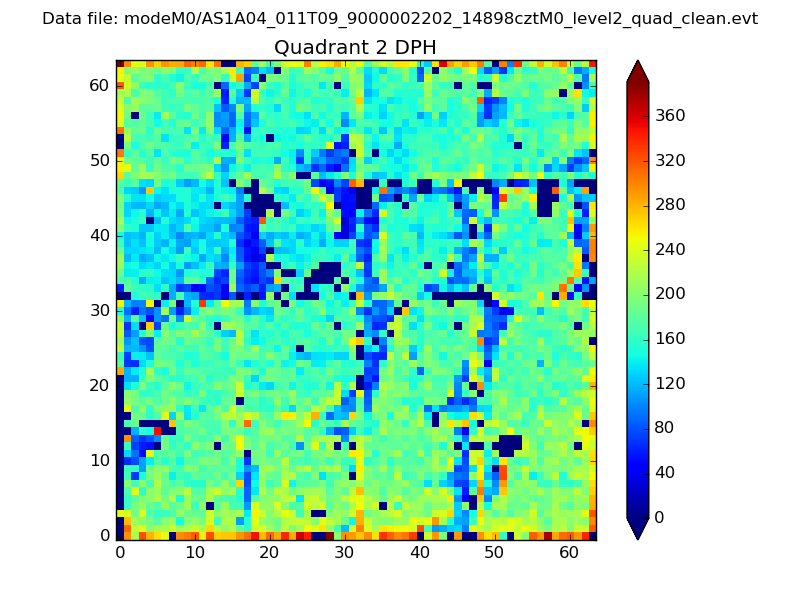
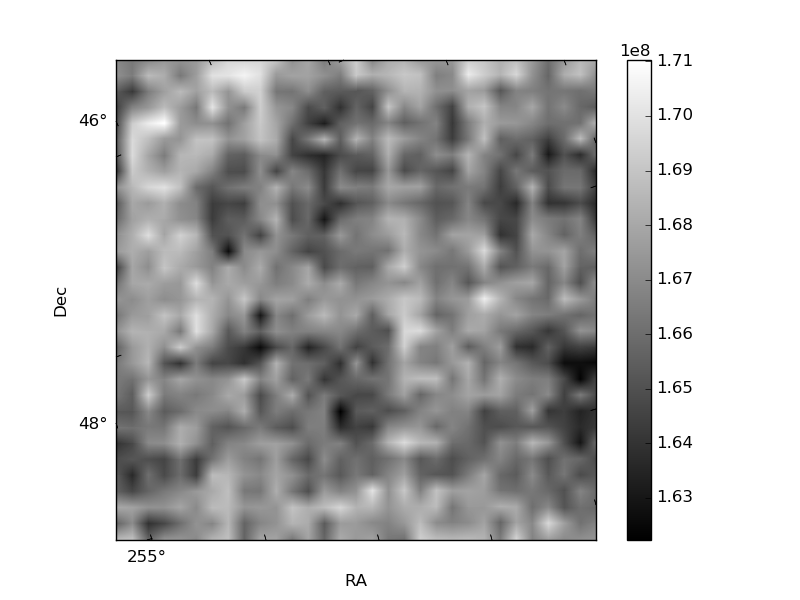
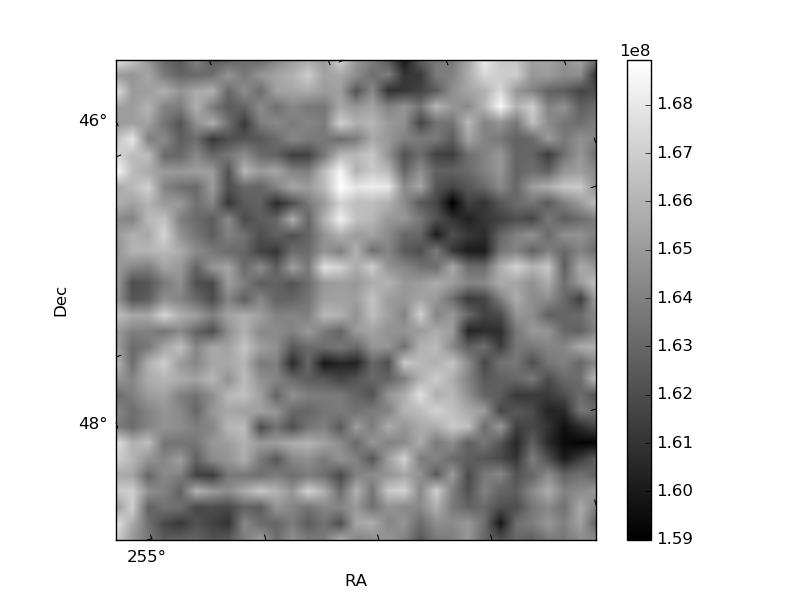
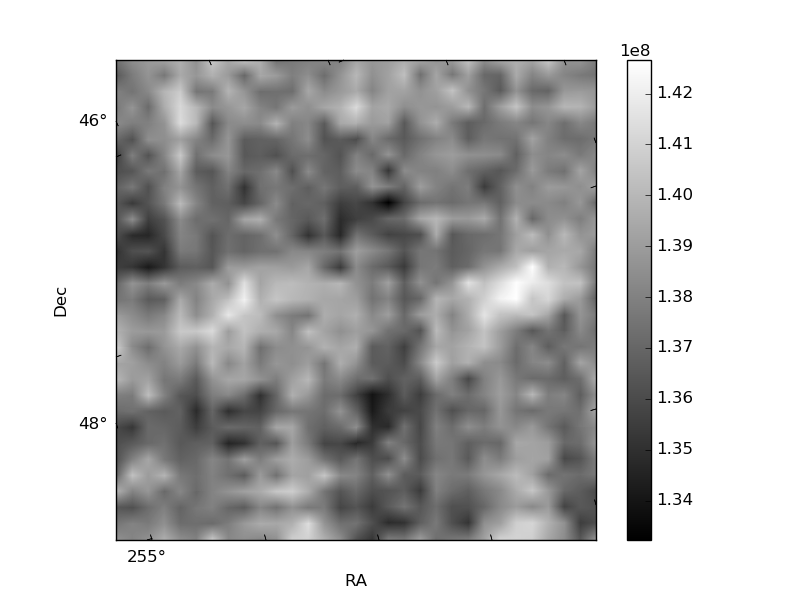
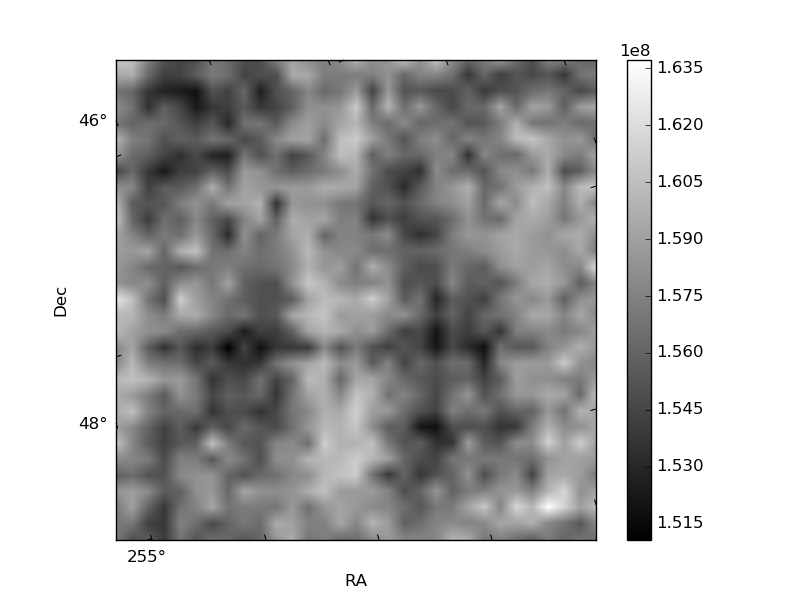
Histogram calculated using DETX and DETY for each event in the final _common_clean file
| Quadrant A | 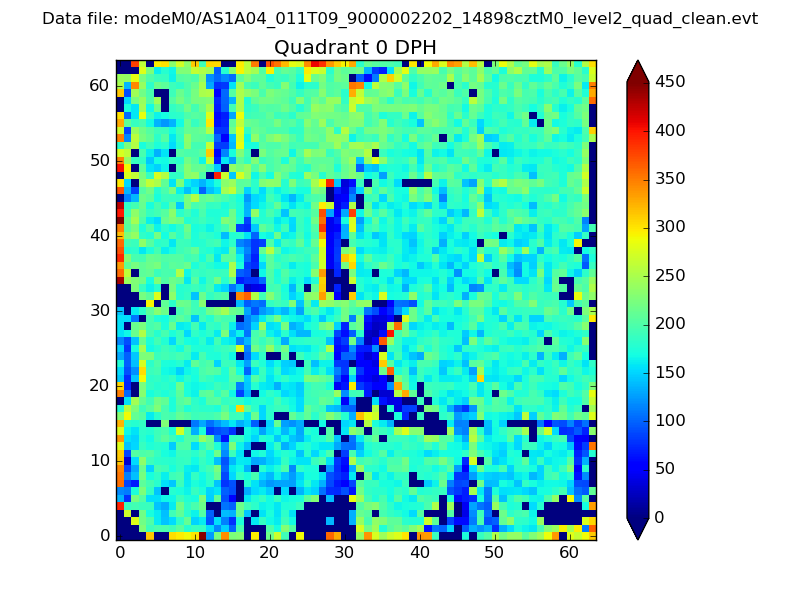 |
 |
Quadrant B |
|---|---|---|---|
| Quadrant D | 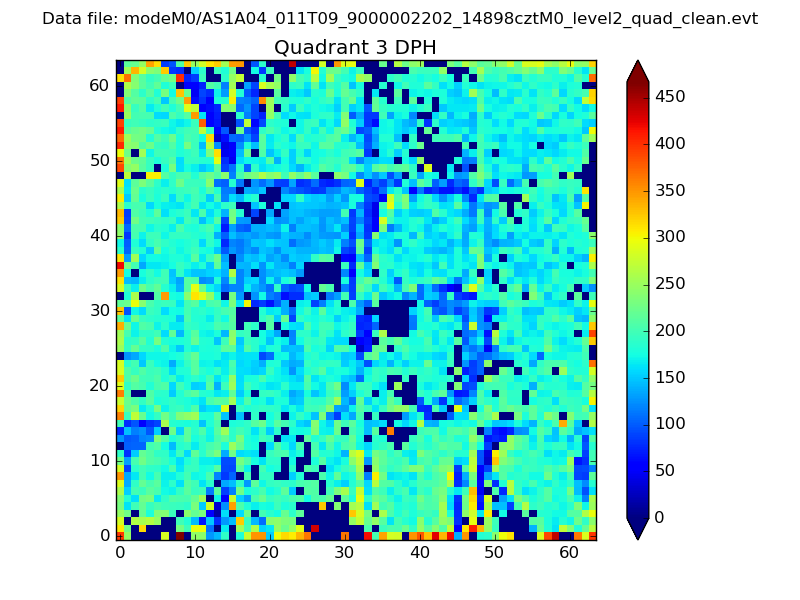 |
 |
Quadrant C |
| Plot type | Count rate plots | Images |
|---|---|---|
| Comparison with Poisson distribution Blue bars denote a histogram of data divided into 1 sec bins. Red curve is a Poisson curve with rate = median count rate of data. |
 |
 |
| Quadrant-wise count rates Data is divided into 100 sec bins |
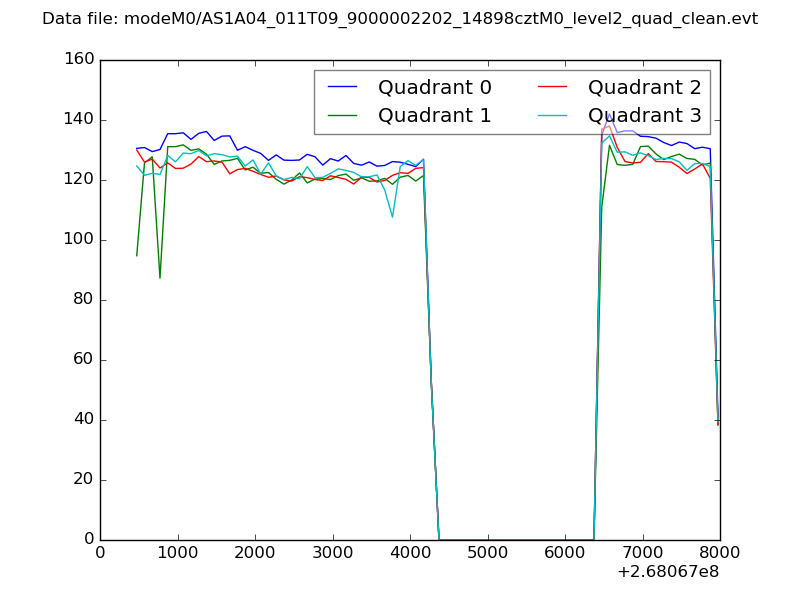 |
|
| Module-wise count rates for Quadrant A Data is divided into 100 sec bins |
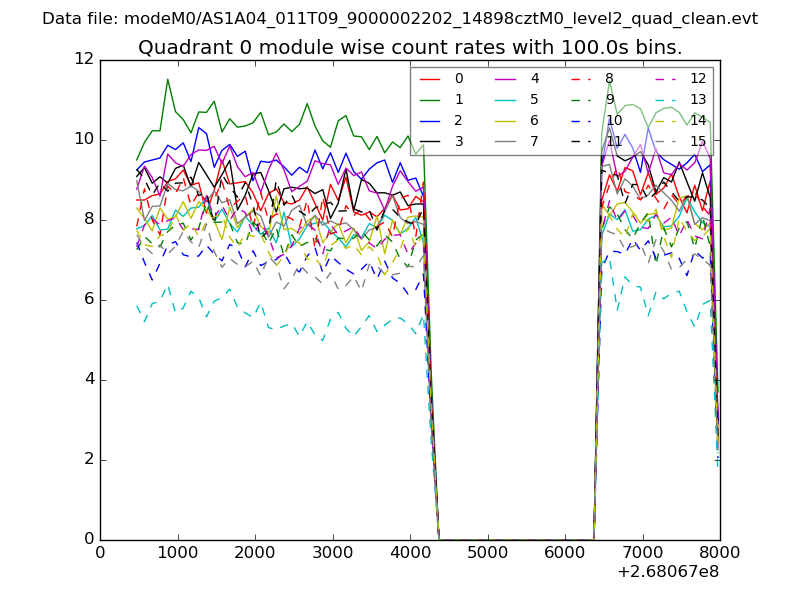 |
 |
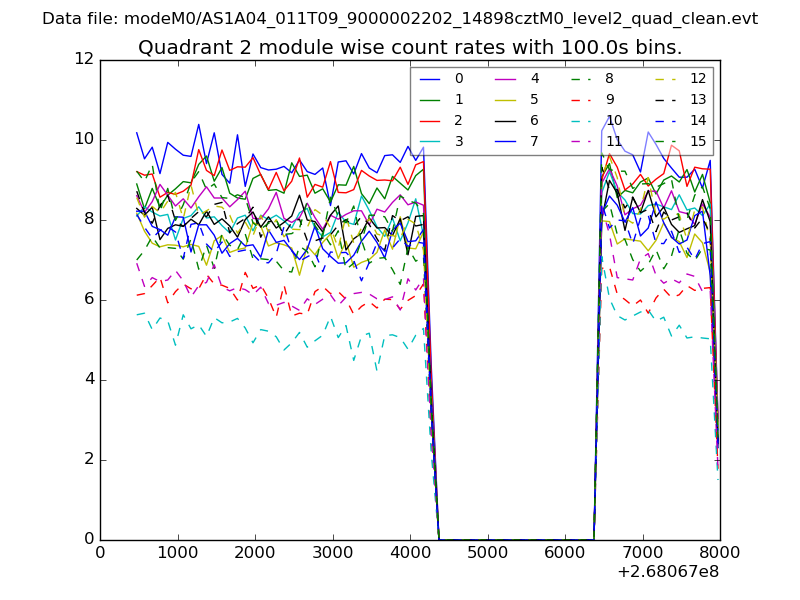
| Module-wise count rates for Quadrant B Data is divided into 100 sec bins |
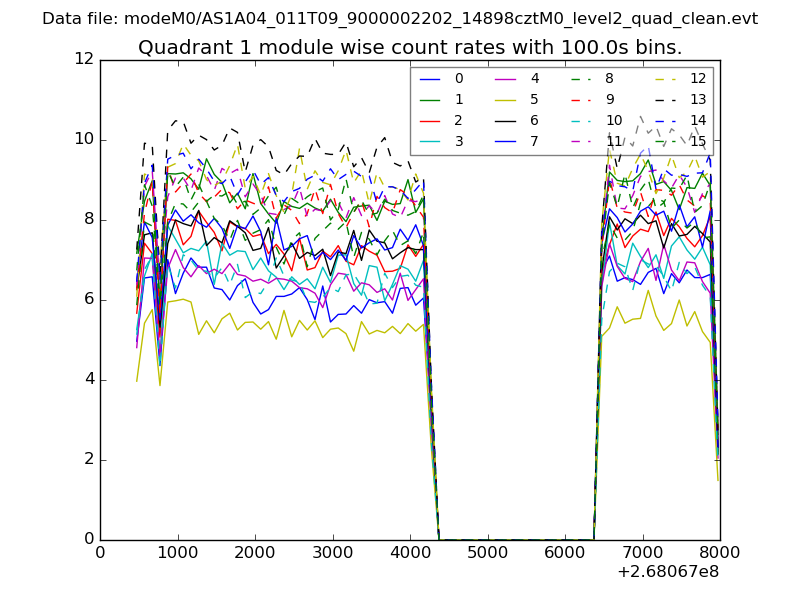 |
 |
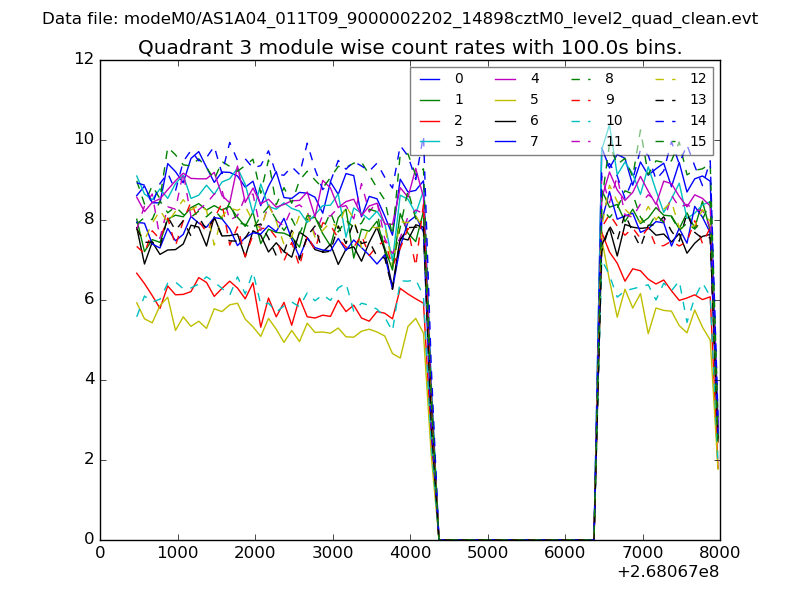
| Module-wise count rates for Quadrant C Data is divided into 100 sec bins |
 |
 |
| Module-wise count rates for Quadrant D Data is divided into 100 sec bins |
 |
 |
| Parameter | Plot |
|---|---|
| CZT HV Monitor | 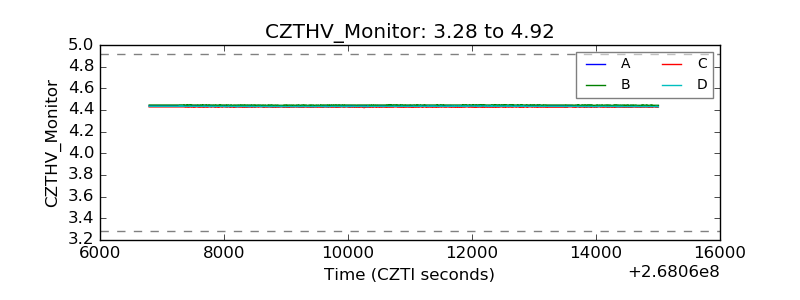 |
| D_VDD | 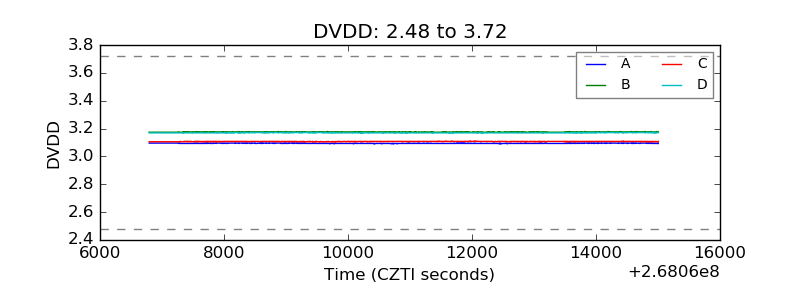 |
| Temperature 1 | 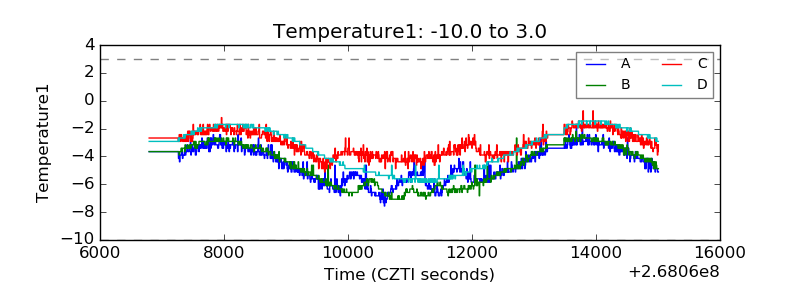 |
| Veto HV Monitor |  |
| Veto LLD | 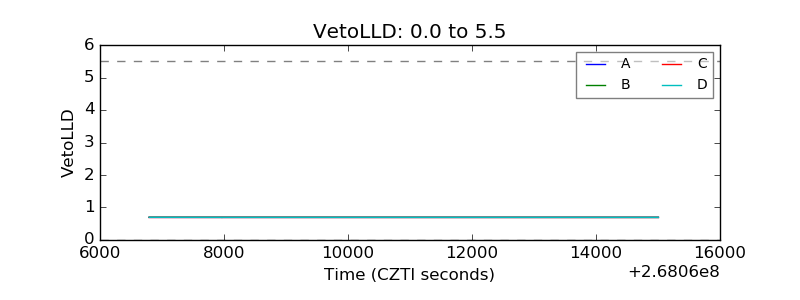 |
| Alpha Counter | 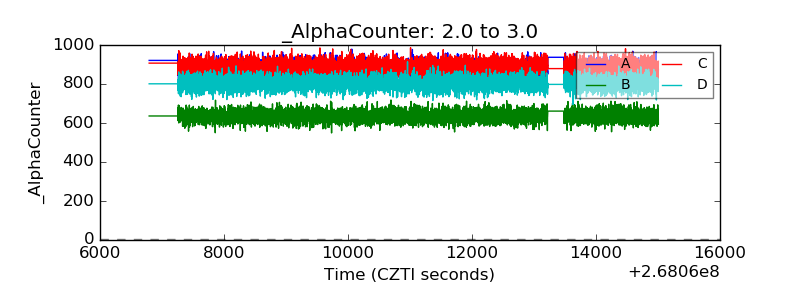 |
| _CPM_Rate | 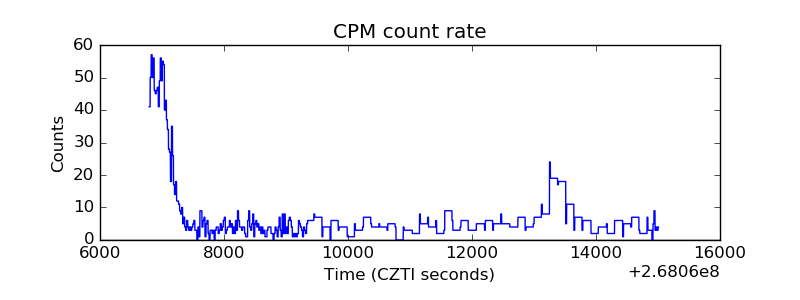 |
| CZT Counter | 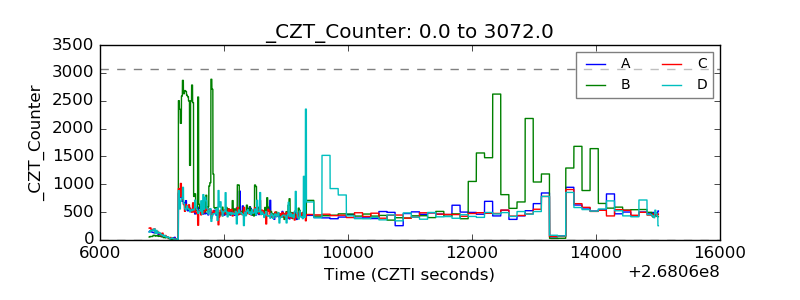 |
| +2.5 Volts monitor |  |
| +5 Volts monitor |  |
| _ROLL_ROT | 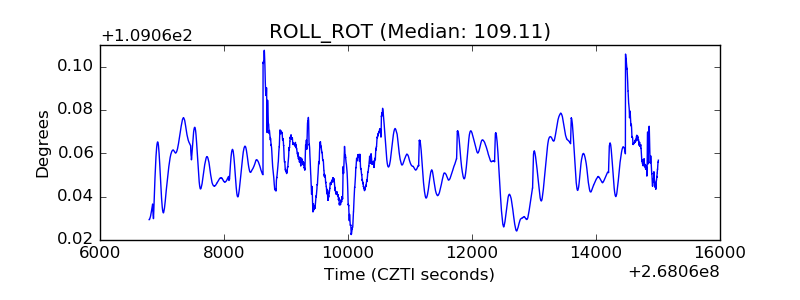 |
| _Roll_DEC |  |
| _Roll_RA | 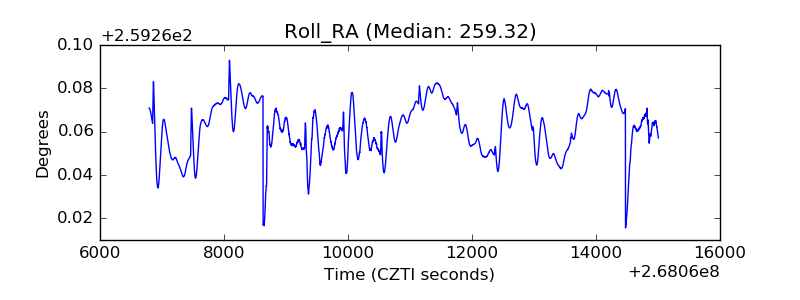 |
| Veto Counter | 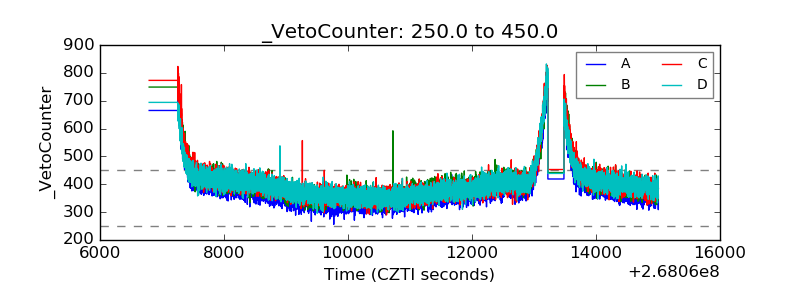 |