| Param | Original file | Final file |
|---|---|---|
| Filename | modeM0/AS1A04_011T09_9000002202_14903cztM0_level2.evt | modeM0/AS1A04_011T09_9000002202_14903cztM0_level2_quad_clean.evt |
| Size (bytes) | 576,135,360 | 99,230,400 |
| Size | 549.4 MB | 94.6 MB |
| Events in quadrant A | 3,369,420 | 686,939 |
| Events in quadrant B | 6,733,504 | 494,393 |
| Events in quadrant C | 3,409,058 | 659,533 |
| Events in quadrant D | 3,448,548 | 663,378 |
| Mode M9 | |||
|---|---|---|---|
| Quadrant | BADHDUFLAG | Total packets | Discarded packets |
| A | 0 | 17 | 0 |
| B | 0 | 17 | 0 |
| C | 0 | 17 | 0 |
| D | 0 | 17 | 0 |
| Mode M0 | |||
|---|---|---|---|
| Quadrant | BADHDUFLAG | Total packets | Discarded packets |
| A | 0 | 14789 | 3 |
| B | 0 | 24615 | 2 |
| C | 0 | 14772 | 2 |
| D | 0 | 15168 | 2 |
| Mode SS | |||
|---|---|---|---|
| Quadrant | BADHDUFLAG | Total packets | Discarded packets |
| A | 0 | 148 | 0 |
| B | 0 | 148 | 0 |
| C | 0 | 148 | 0 |
| D | 0 | 148 | 0 |
| Quadrant | Total seconds | Saturated seconds | Saturation percentage |
|---|---|---|---|
| A | 7181 | 44 | 0.612728% |
| B | 7181 | 1590 | 22.141763% |
| C | 7181 | 28 | 0.389918% |
| D | 7181 | 44 | 0.612728% |
Noise dominated data is calculated using 1-second bins in cleaned event files. If a bin has >2000 counts, and if more than 50% of those come from <1% of pixels, then it is considered to be noise-dominated and hence unusable.
| Quadrant | # 1 sec bins | Bins with >0 counts | Bins with >2000 counts | High rate bins dominated by noise | Noise dominated (total time) | Noise dominated (detector-on time) | Marked lightcurve |
|---|---|---|---|---|---|---|---|
| A | 8862 | 7184 | 0 | 0 | 0.00% | 0.00% | 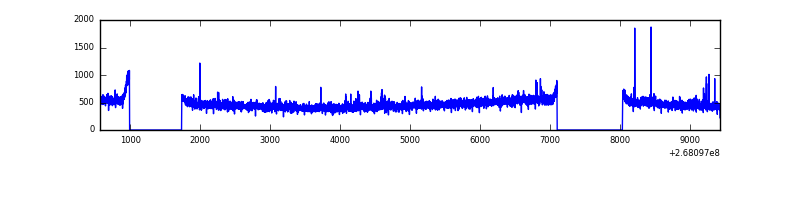 |
| B | 8862 | 7183 | 1335 | 1335 | 15.06% | 18.59% | 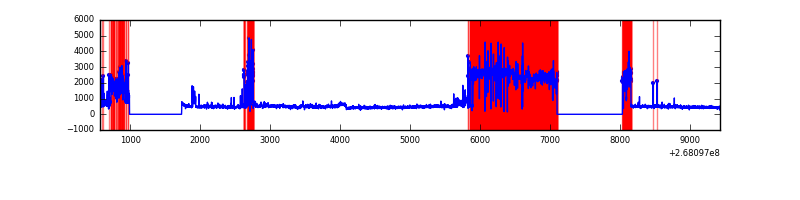 |
| C | 8862 | 7184 | 0 | 0 | 0.00% | 0.00% | 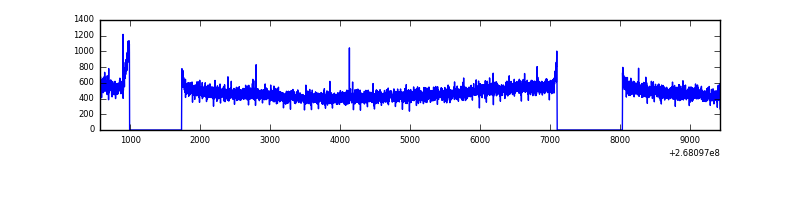 |
| D | 8862 | 7184 | 12 | 12 | 0.14% | 0.17% | 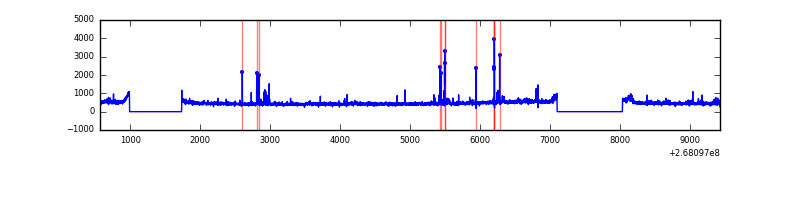 |
Top three noisy pixels from each quadrant. If the there are fewer than three noisy pixels in the level2.evt file, extra rows are filled as -1
| Pixel properties | Quadrant properties | ||||||
|---|---|---|---|---|---|---|---|
| Quadrant | DetID | PixID | Counts | Sigma | Mean | Median | Sigma |
| A | 12 | 189 | 47547 | 270.56 | 857 | 841 | 172.6 |
| A | 11 | 29 | 12622 | 68.24 | 857 | 841 | 172.6 |
| A | 0 | 226 | 7532 | 38.76 | 857 | 841 | 172.6 |
| B | 10 | 16 | 3890803 | 29203.89 | 692 | 673 | 133.2 |
| B | 0 | 229 | 48982 | 362.66 | 692 | 673 | 133.2 |
| B | 4 | 173 | 29308 | 214.97 | 692 | 673 | 133.2 |
| C | 3 | 233 | 164531 | 844.65 | 831 | 834 | 193.8 |
| C | 13 | 61 | 5843 | 25.84 | 831 | 834 | 193.8 |
| C | 8 | 222 | 2982 | 11.08 | 831 | 834 | 193.8 |
| D | 7 | 254 | 134729 | 676.69 | 831 | 810 | 197.9 |
| D | 10 | 70 | 107323 | 538.21 | 831 | 810 | 197.9 |
| D | 13 | 104 | 35942 | 177.52 | 831 | 810 | 197.9 |
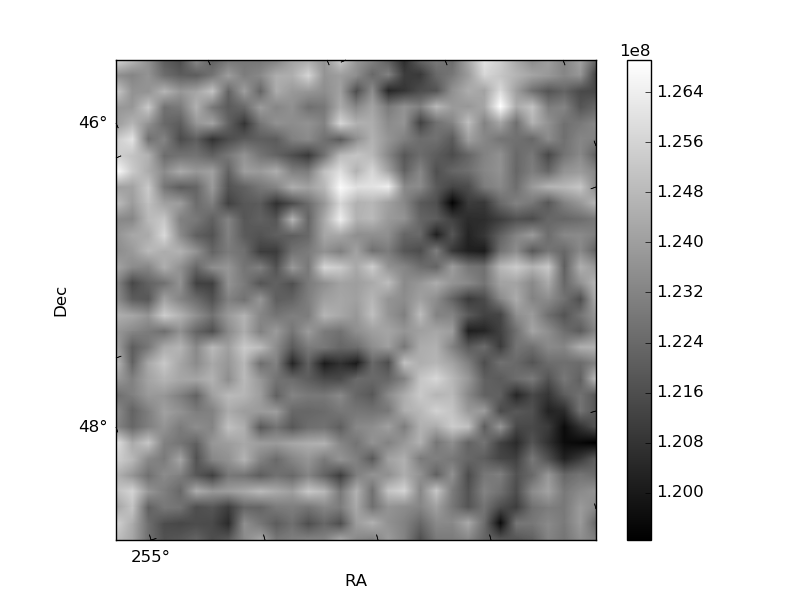
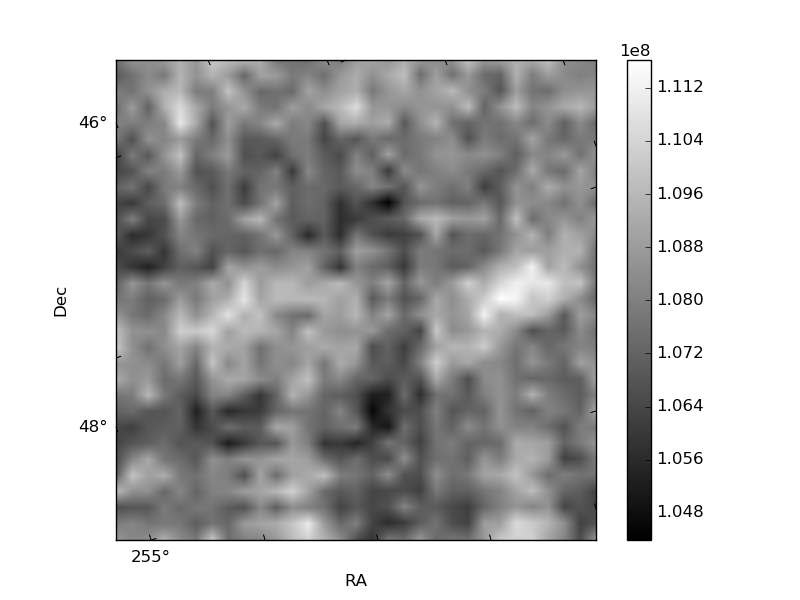
Histogram calculated using DETX and DETY for each event in the final _common_clean file
| Quadrant A | 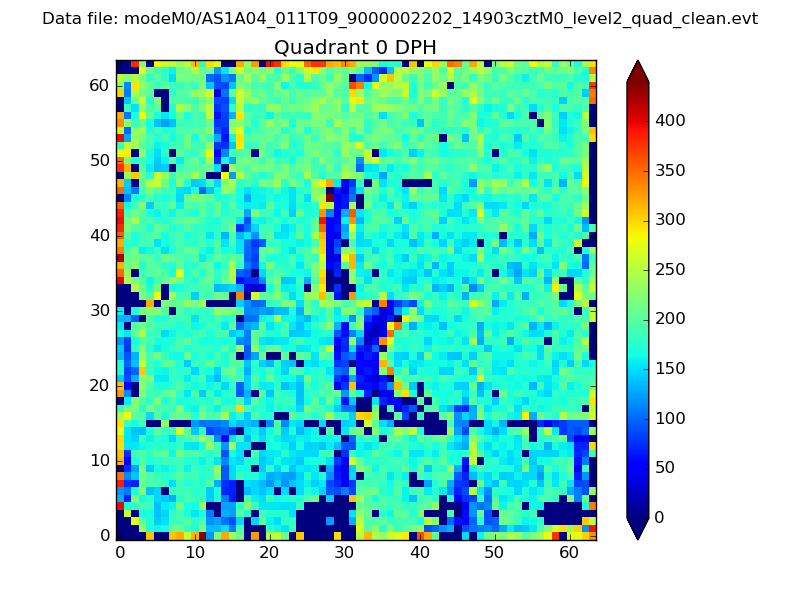 |
 |
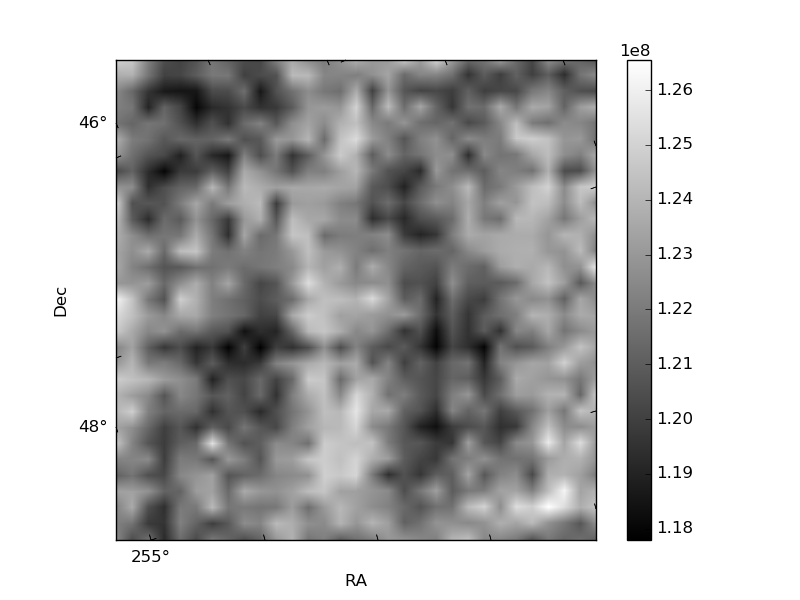
Quadrant B |
|---|---|---|---|
| Quadrant D |  |
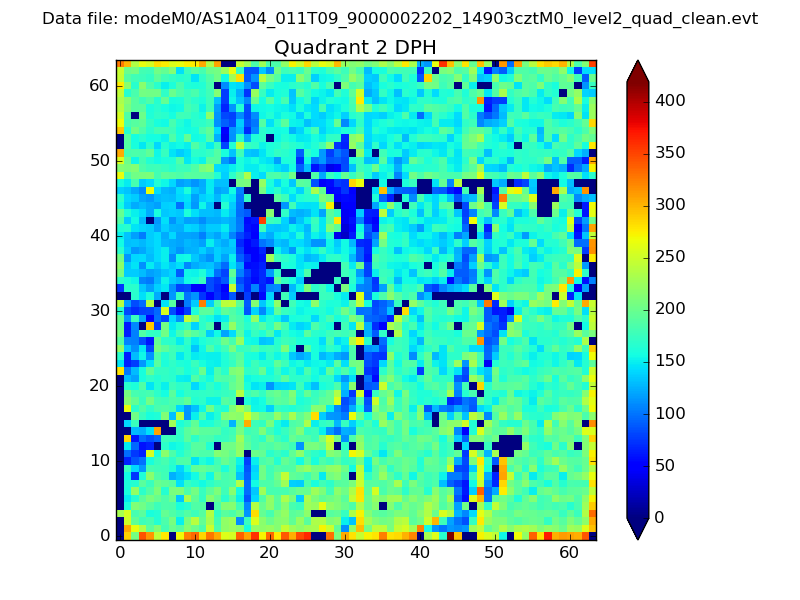 |
Quadrant C |
| Plot type | Count rate plots | Images |
|---|---|---|
| Comparison with Poisson distribution Blue bars denote a histogram of data divided into 1 sec bins. Red curve is a Poisson curve with rate = median count rate of data. |
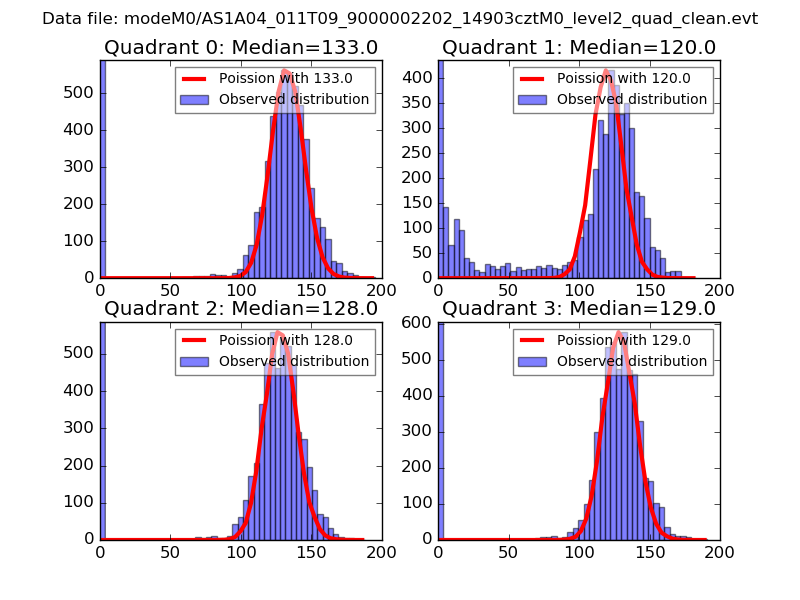 |
 |
| Quadrant-wise count rates Data is divided into 100 sec bins |
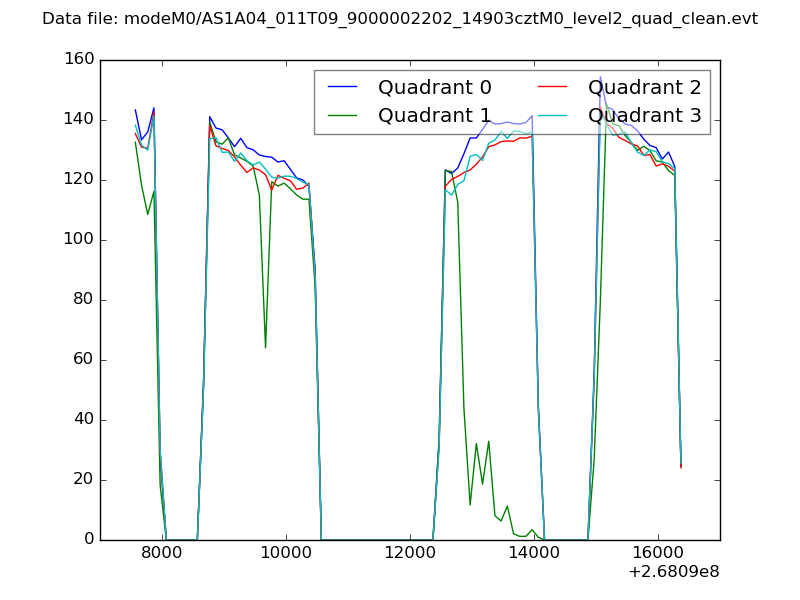 |
|
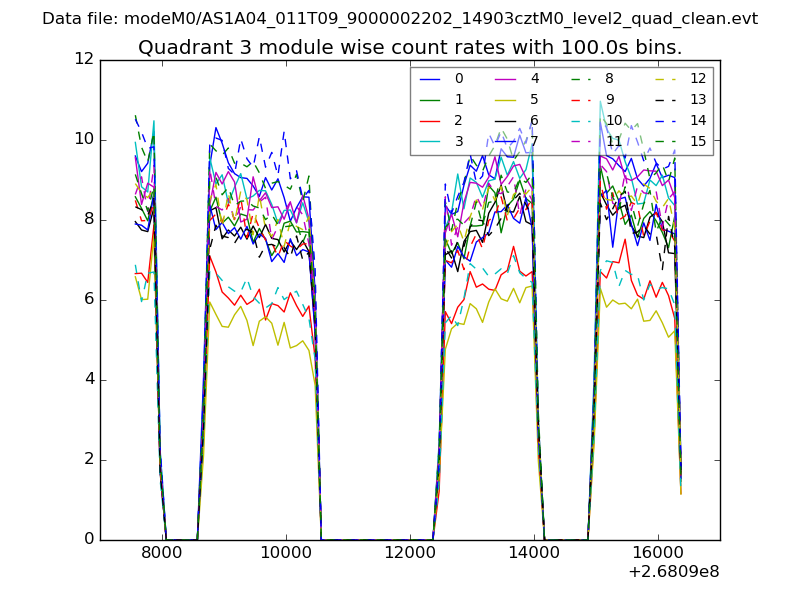
| Module-wise count rates for Quadrant A Data is divided into 100 sec bins |
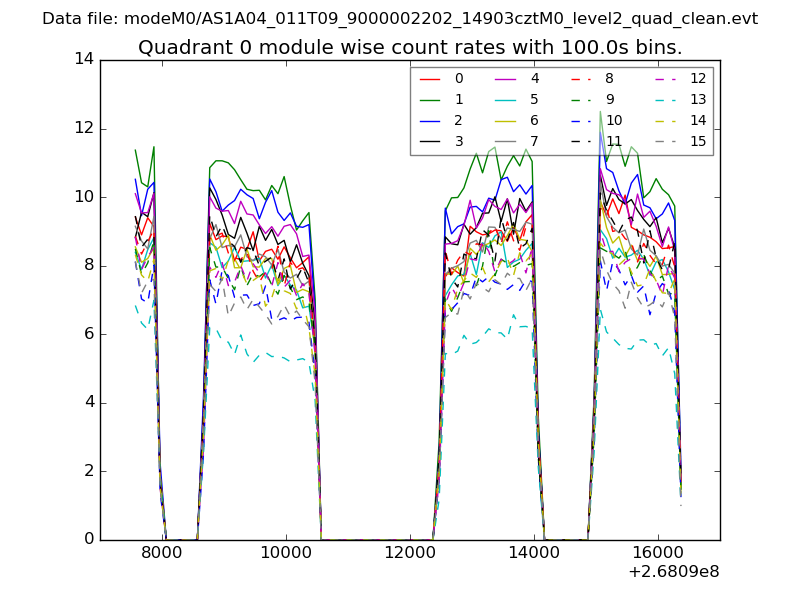 |
 |
| Module-wise count rates for Quadrant B Data is divided into 100 sec bins |
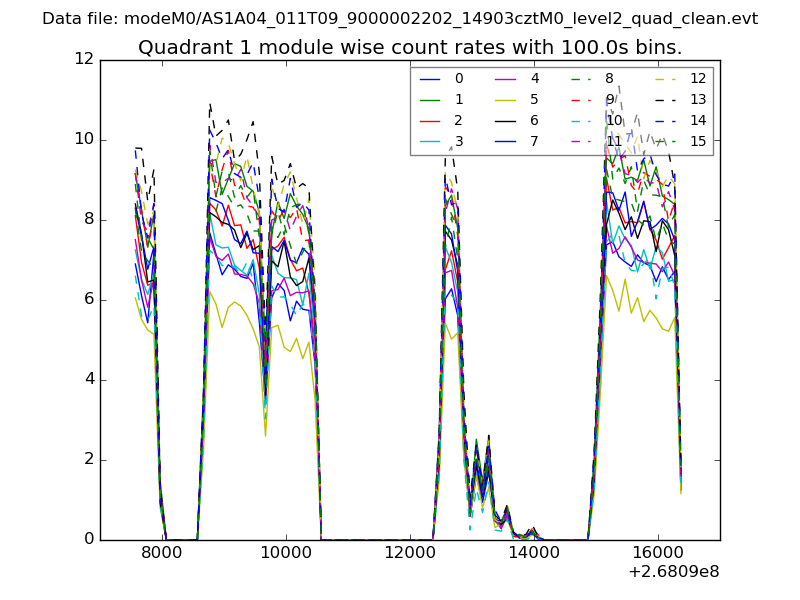 |
 |
| Module-wise count rates for Quadrant C Data is divided into 100 sec bins |
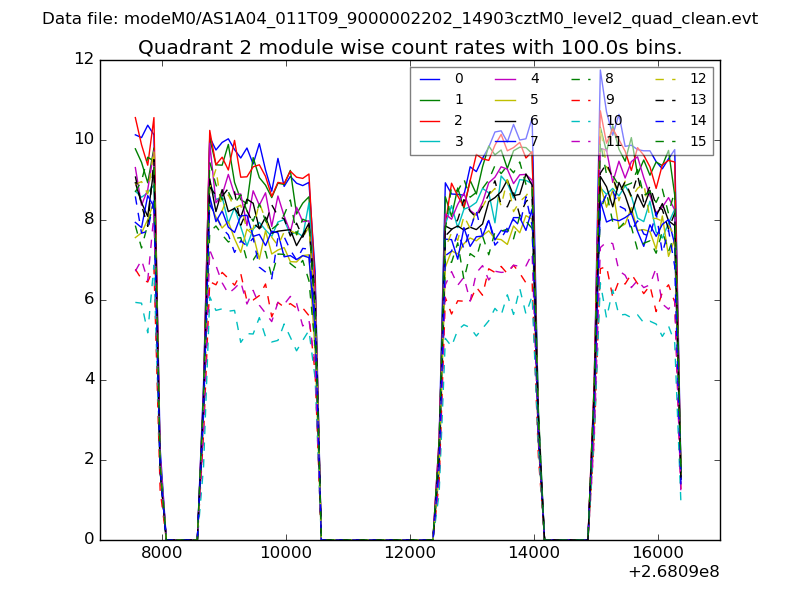 |
 |
| Module-wise count rates for Quadrant D Data is divided into 100 sec bins |
 |
 |
| Parameter | Plot |
|---|---|
| CZT HV Monitor | 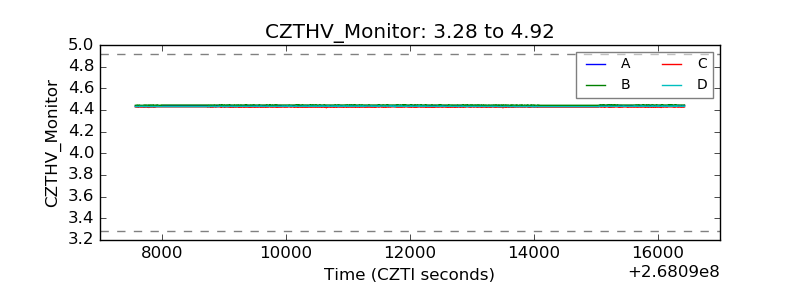 |
| D_VDD | 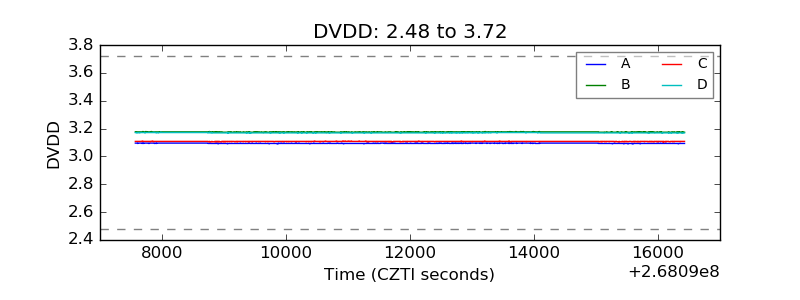 |
| Temperature 1 | 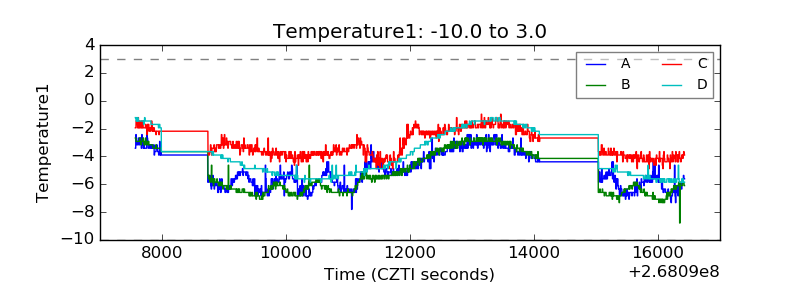 |
| Veto HV Monitor | 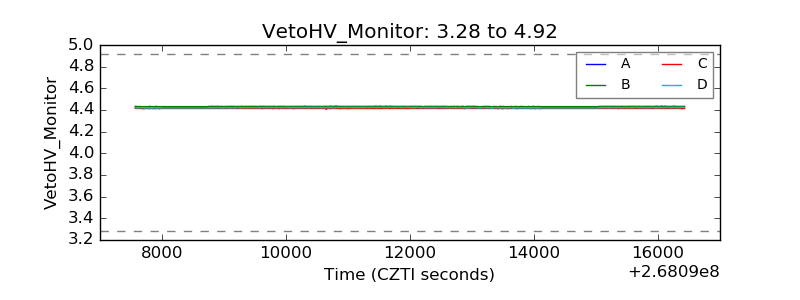 |
| Veto LLD | 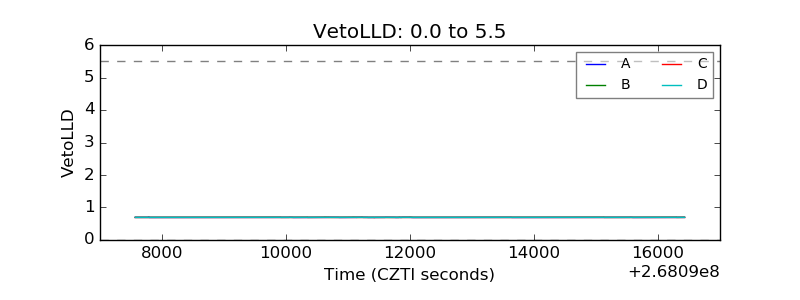 |
| Alpha Counter | 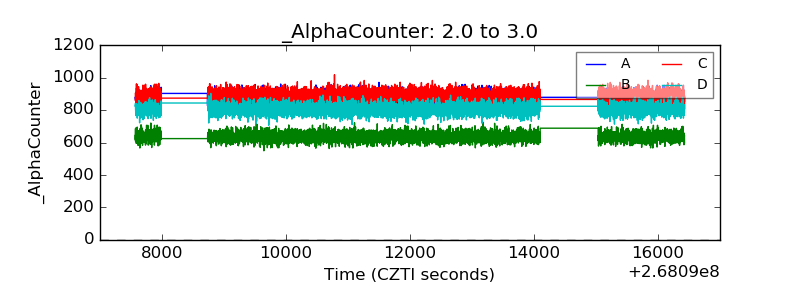 |
| _CPM_Rate | 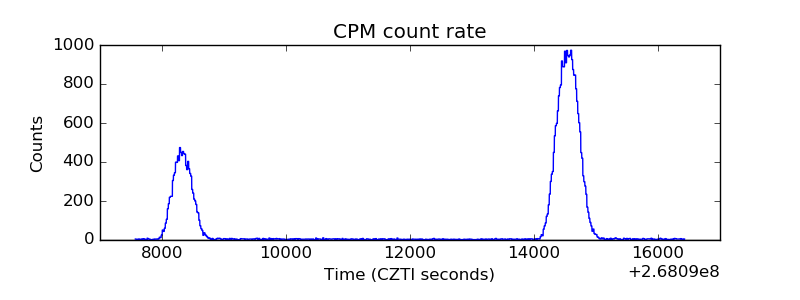 |
| CZT Counter | 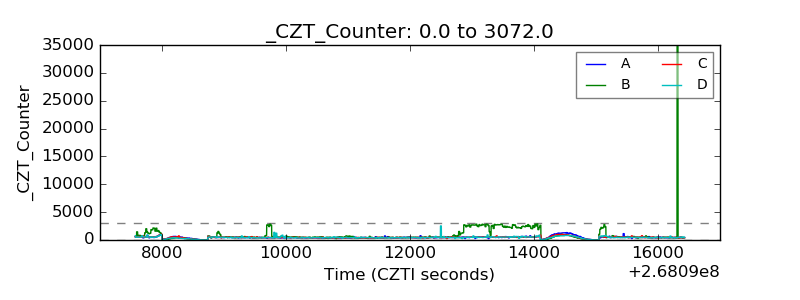 |
| +2.5 Volts monitor |  |
| +5 Volts monitor |  |
| _ROLL_ROT | 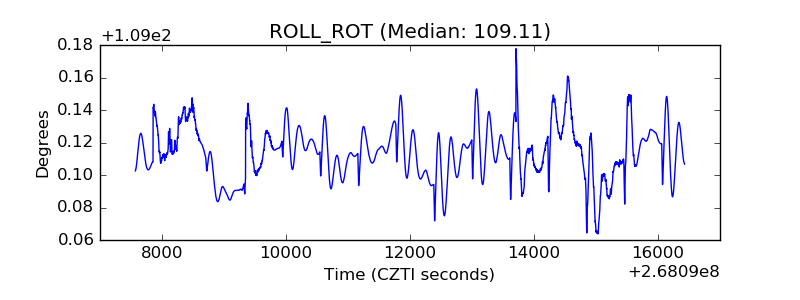 |
| _Roll_DEC | 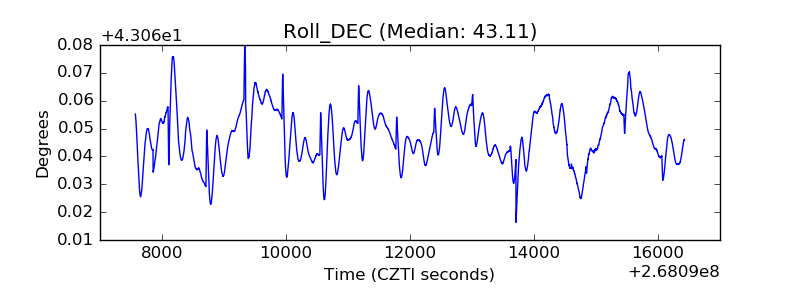 |
| _Roll_RA | 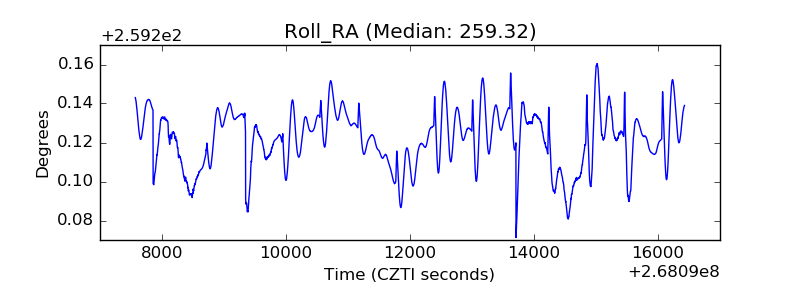 |
| Veto Counter | 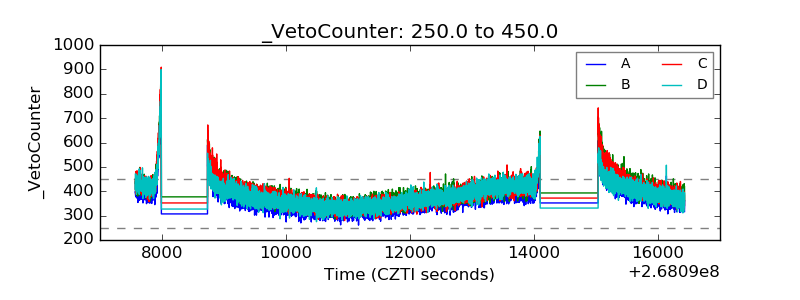 |