| Param | Original file | Final file |
|---|---|---|
| Filename | modeM0/AS1A04_011T09_9000002202_14904cztM0_level2.evt | modeM0/AS1A04_011T09_9000002202_14904cztM0_level2_quad_clean.evt |
| Size (bytes) | 447,897,600 | 88,280,640 |
| Size | 427.1 MB | 84.2 MB |
| Events in quadrant A | 3,045,704 | 575,455 |
| Events in quadrant B | 3,871,700 | 544,758 |
| Events in quadrant C | 3,061,396 | 550,660 |
| Events in quadrant D | 3,148,035 | 553,142 |
| Mode M9 | |||
|---|---|---|---|
| Quadrant | BADHDUFLAG | Total packets | Discarded packets |
| A | 0 | 20 | 0 |
| B | 0 | 20 | 0 |
| C | 0 | 20 | 0 |
| D | 0 | 20 | 0 |
| Mode M0 | |||
|---|---|---|---|
| Quadrant | BADHDUFLAG | Total packets | Discarded packets |
| A | 0 | 13160 | 3 |
| B | 0 | 15573 | 2 |
| C | 0 | 13145 | 2 |
| D | 0 | 13751 | 2 |
| Mode SS | |||
|---|---|---|---|
| Quadrant | BADHDUFLAG | Total packets | Discarded packets |
| A | 0 | 132 | 0 |
| B | 0 | 132 | 0 |
| C | 0 | 132 | 0 |
| D | 0 | 132 | 0 |
| Quadrant | Total seconds | Saturated seconds | Saturation percentage |
|---|---|---|---|
| A | 6443 | 11 | 0.170728% |
| B | 6443 | 197 | 3.057582% |
| C | 6443 | 7 | 0.108645% |
| D | 6443 | 38 | 0.589787% |
Noise dominated data is calculated using 1-second bins in cleaned event files. If a bin has >2000 counts, and if more than 50% of those come from <1% of pixels, then it is considered to be noise-dominated and hence unusable.
| Quadrant | # 1 sec bins | Bins with >0 counts | Bins with >2000 counts | High rate bins dominated by noise | Noise dominated (total time) | Noise dominated (detector-on time) | Marked lightcurve |
|---|---|---|---|---|---|---|---|
| A | 8464 | 6446 | 0 | 0 | 0.00% | 0.00% | 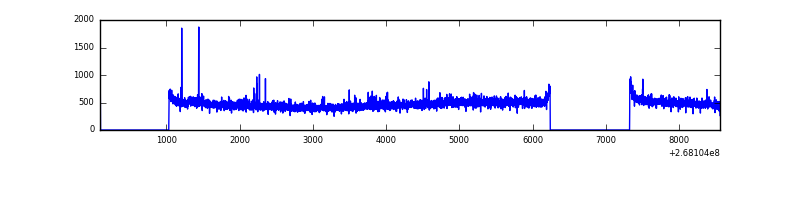 |
| B | 8464 | 6445 | 121 | 121 | 1.43% | 1.88% | 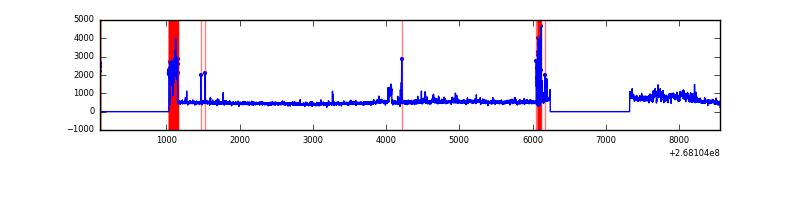 |
| C | 8464 | 6446 | 0 | 0 | 0.00% | 0.00% |  |
| D | 8464 | 6446 | 25 | 25 | 0.30% | 0.39% | 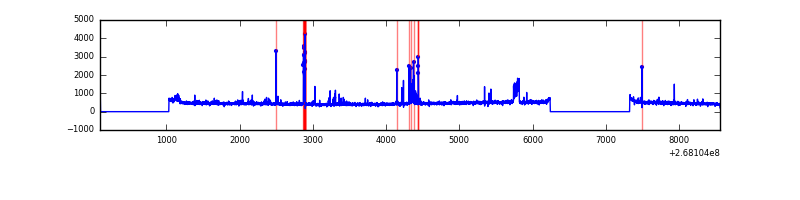 |
Top three noisy pixels from each quadrant. If the there are fewer than three noisy pixels in the level2.evt file, extra rows are filled as -1
| Pixel properties | Quadrant properties | ||||||
|---|---|---|---|---|---|---|---|
| Quadrant | DetID | PixID | Counts | Sigma | Mean | Median | Sigma |
| A | 3 | 1 | 18859 | 115.16 | 776 | 762 | 157.1 |
| A | 11 | 29 | 14109 | 84.94 | 776 | 762 | 157.1 |
| A | 12 | 189 | 12538 | 74.94 | 776 | 762 | 157.1 |
| B | 10 | 16 | 755703 | 5219.24 | 757 | 739 | 144.7 |
| B | 0 | 229 | 75721 | 518.37 | 757 | 739 | 144.7 |
| B | 0 | 189 | 34539 | 233.67 | 757 | 739 | 144.7 |
| C | 3 | 233 | 140518 | 803.28 | 749 | 754 | 174.0 |
| C | 13 | 61 | 5332 | 26.31 | 749 | 754 | 174.0 |
| C | 7 | 247 | 2805 | 11.79 | 749 | 754 | 174.0 |
| D | 7 | 254 | 116291 | 651.67 | 748 | 732 | 177.3 |
| D | 10 | 199 | 51985 | 289.03 | 748 | 732 | 177.3 |
| D | 13 | 104 | 51679 | 287.3 | 748 | 732 | 177.3 |
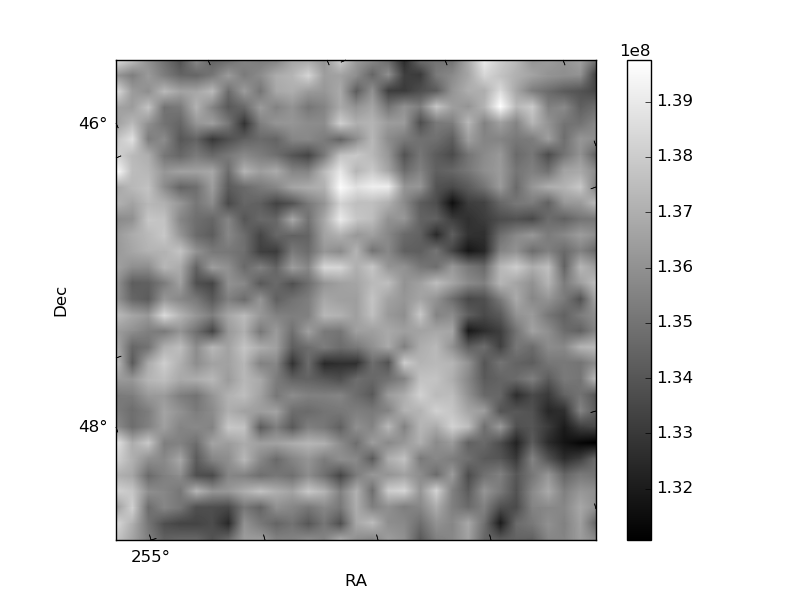
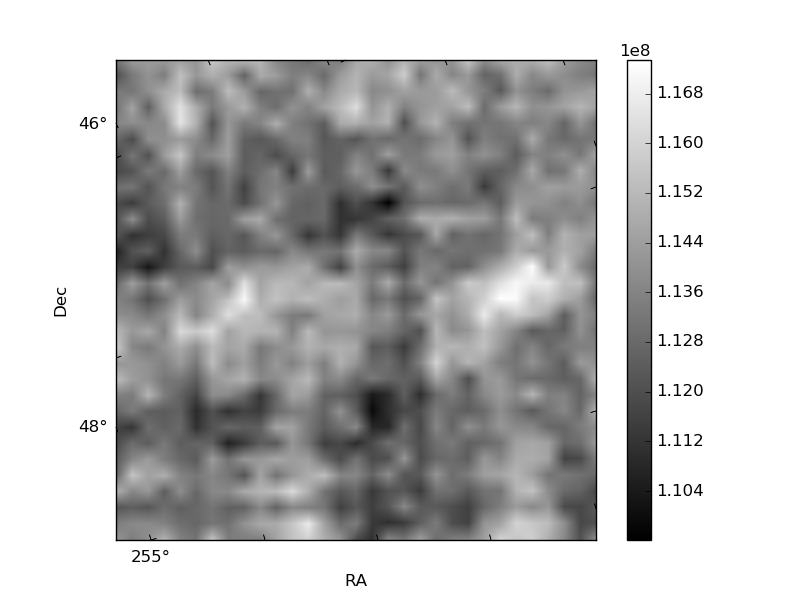
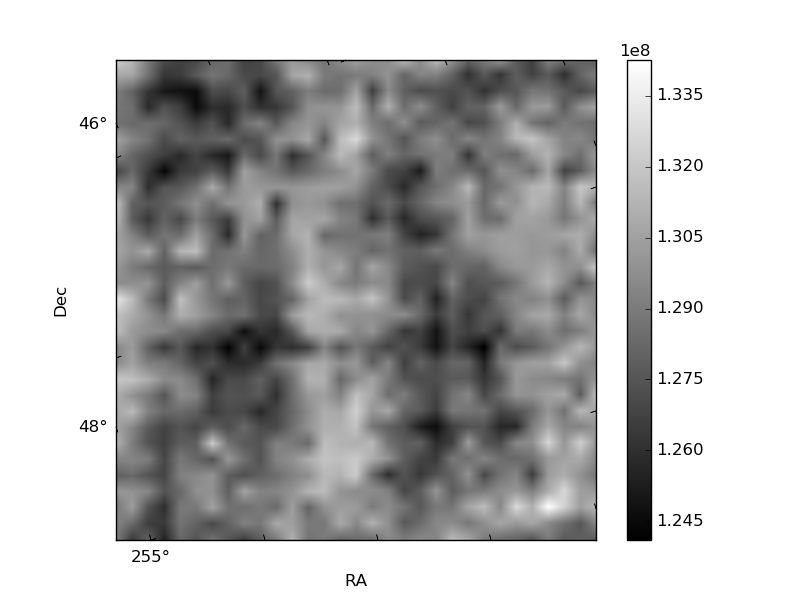
Histogram calculated using DETX and DETY for each event in the final _common_clean file
| Quadrant A |  |
 |
Quadrant B |
|---|---|---|---|
| Quadrant D | 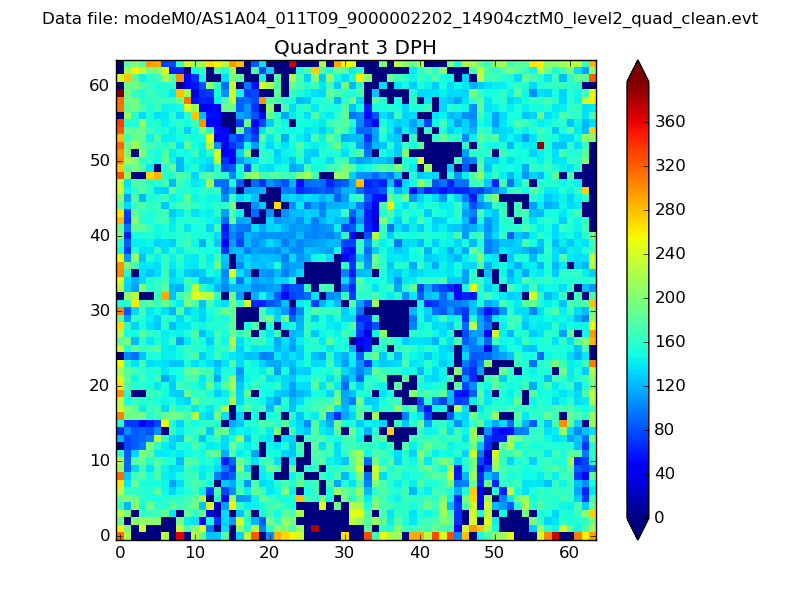 |
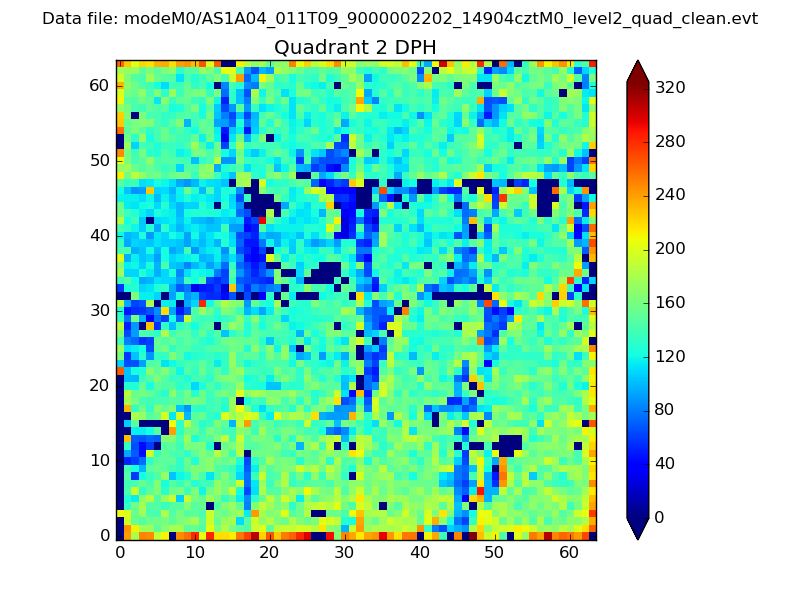 |
Quadrant C |
| Plot type | Count rate plots | Images |
|---|---|---|
| Comparison with Poisson distribution Blue bars denote a histogram of data divided into 1 sec bins. Red curve is a Poisson curve with rate = median count rate of data. |
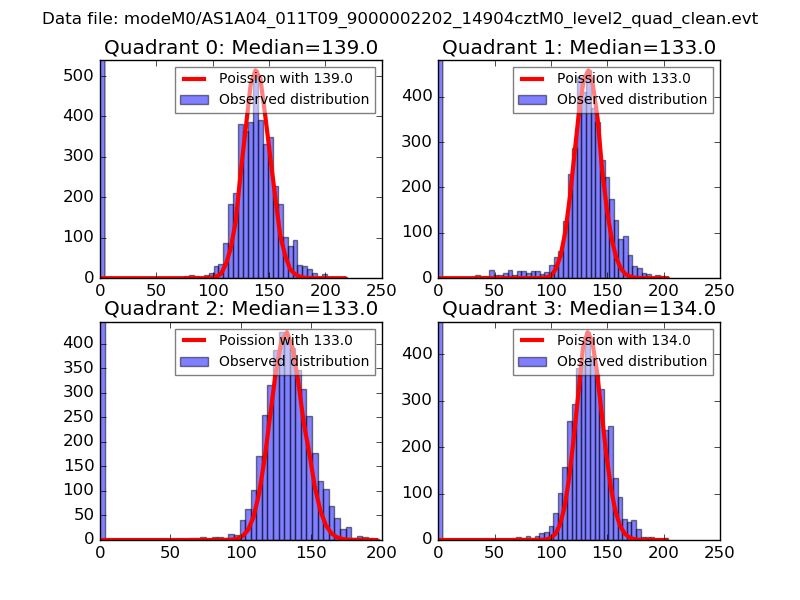 |
 |
| Quadrant-wise count rates Data is divided into 100 sec bins |
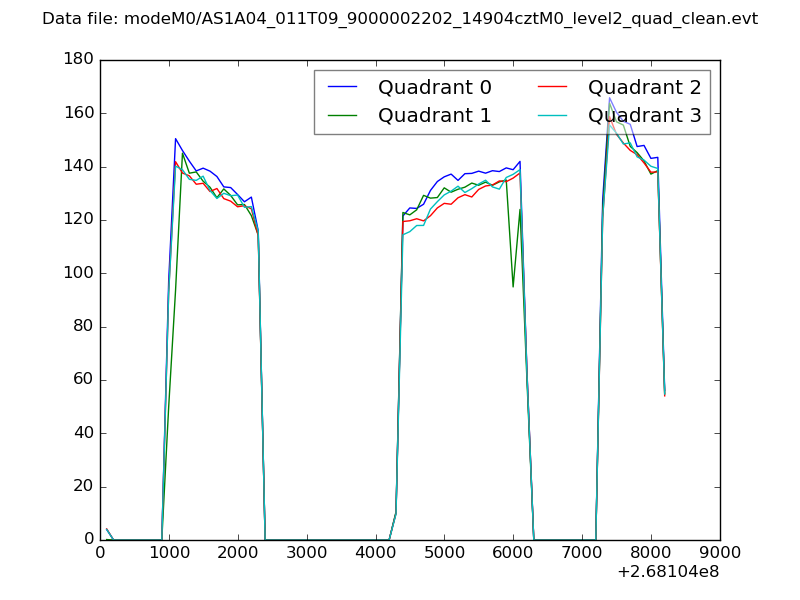 |
|
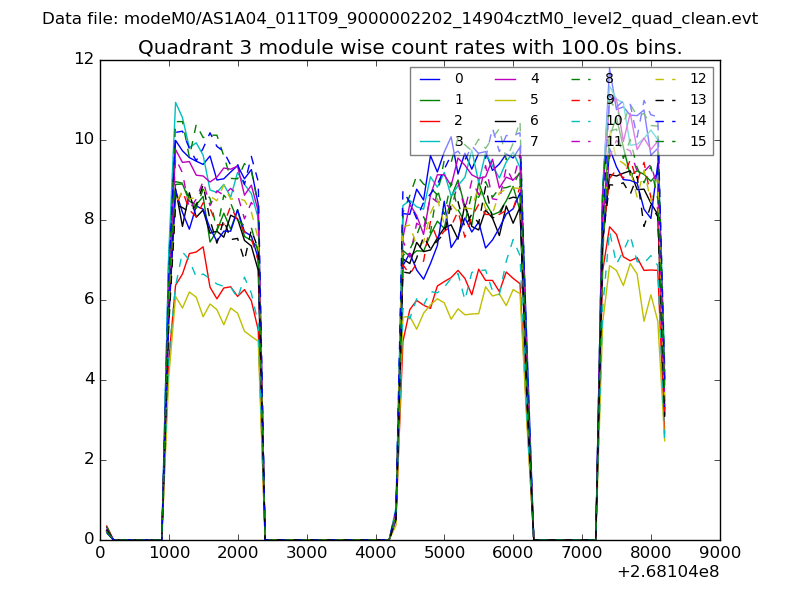
| Module-wise count rates for Quadrant A Data is divided into 100 sec bins |
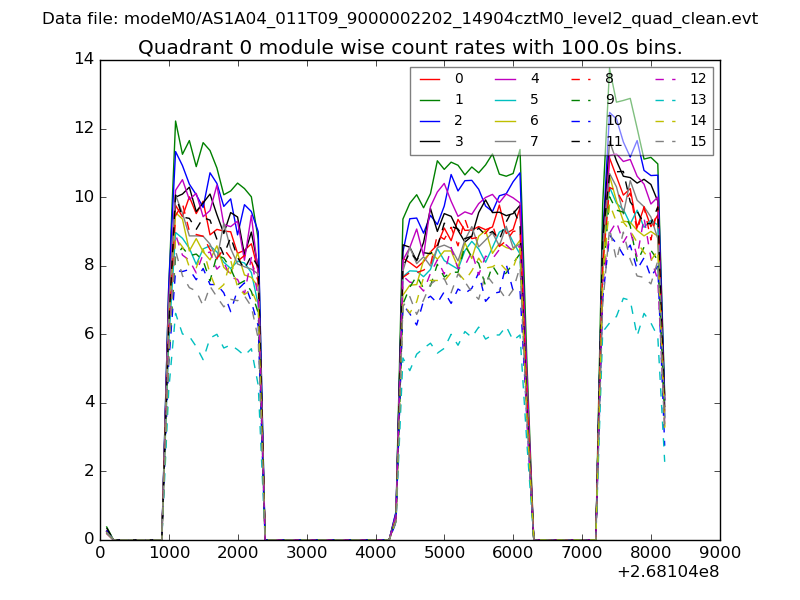 |
 |
| Module-wise count rates for Quadrant B Data is divided into 100 sec bins |
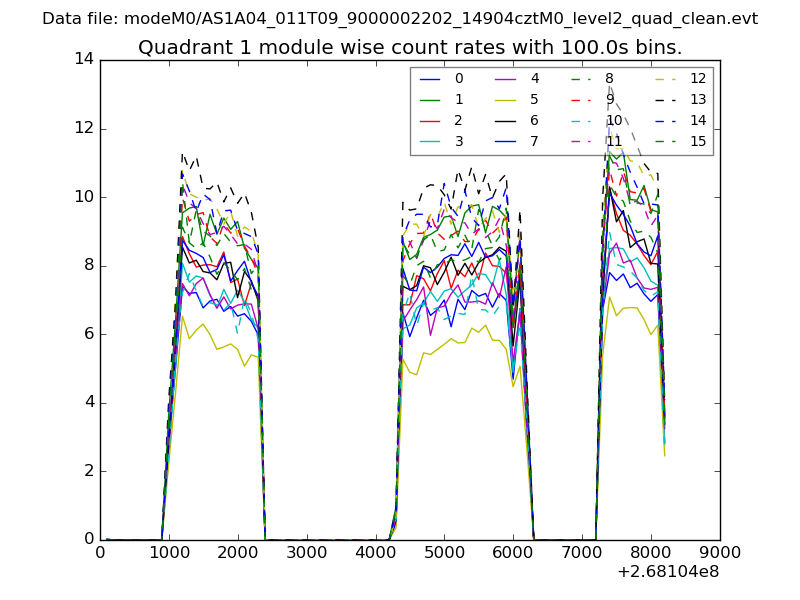 |
 |
| Module-wise count rates for Quadrant C Data is divided into 100 sec bins |
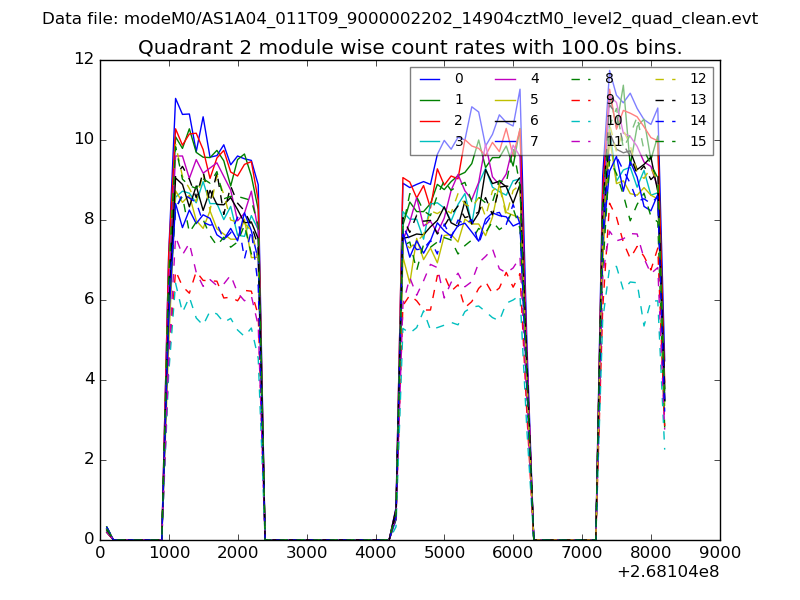 |
 |
| Module-wise count rates for Quadrant D Data is divided into 100 sec bins |
 |
 |
| Parameter | Plot |
|---|---|
| CZT HV Monitor | 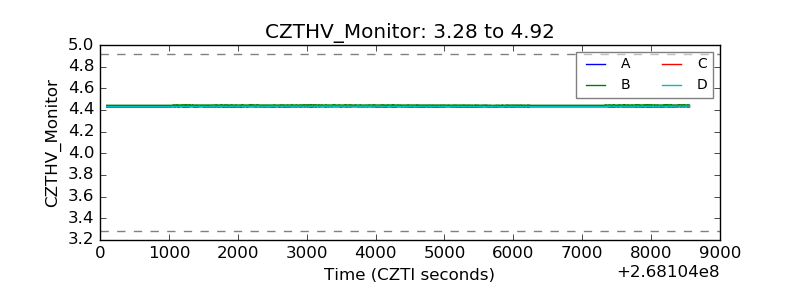 |
| D_VDD | 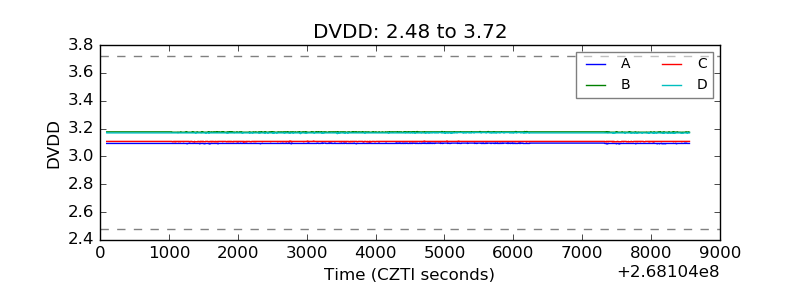 |
| Temperature 1 | 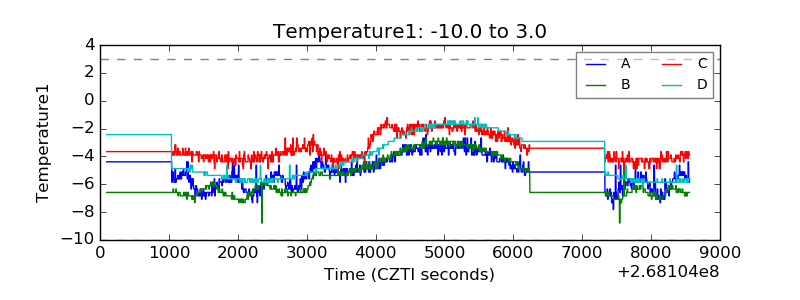 |
| Veto HV Monitor | 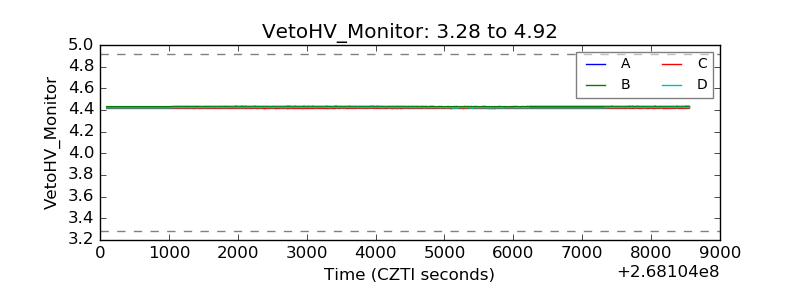 |
| Veto LLD | 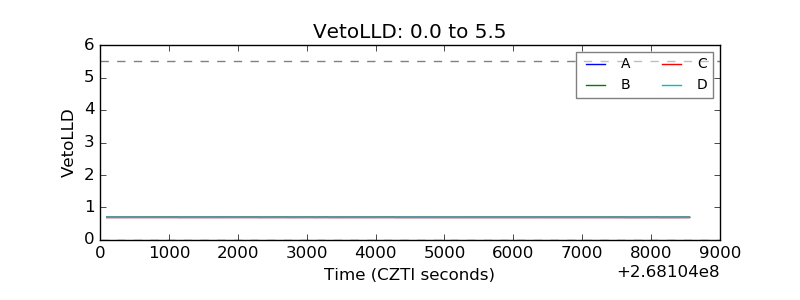 |
| Alpha Counter | 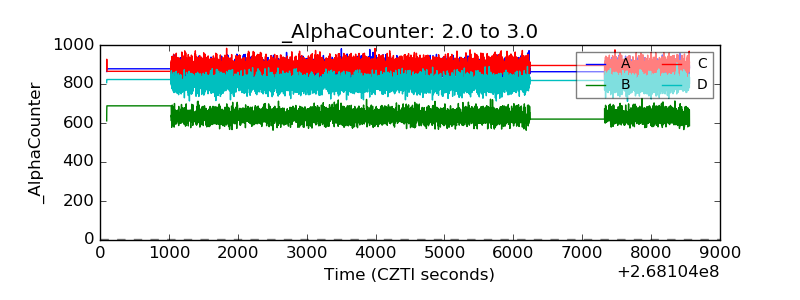 |
| _CPM_Rate | 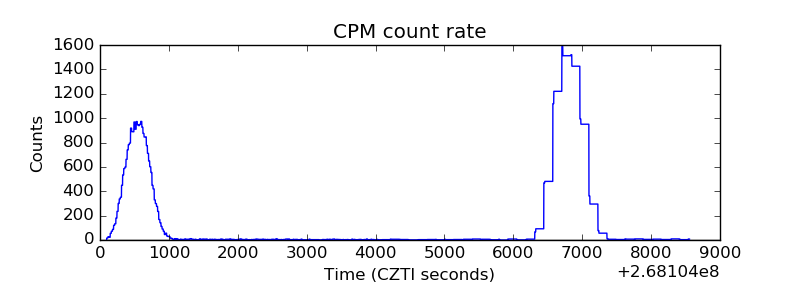 |
| CZT Counter | 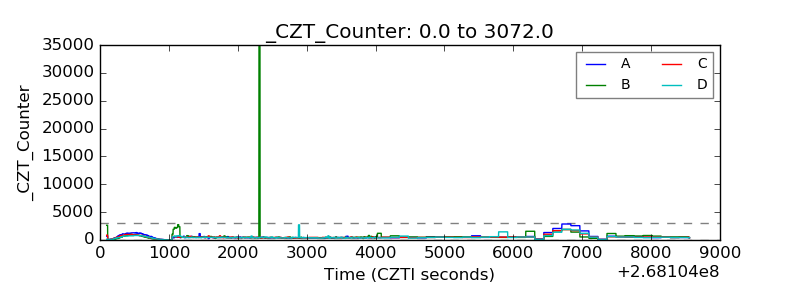 |
| +2.5 Volts monitor |  |
| +5 Volts monitor |  |
| _ROLL_ROT |  |
| _Roll_DEC | 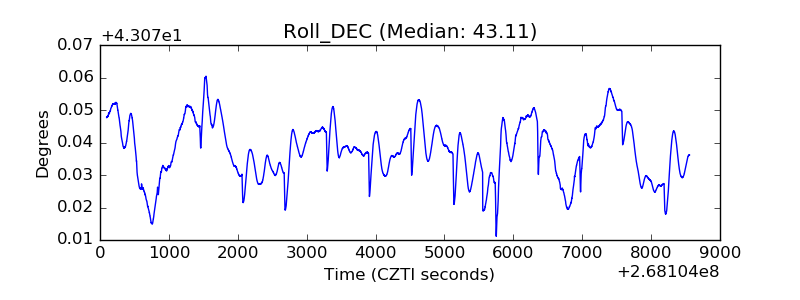 |
| _Roll_RA | 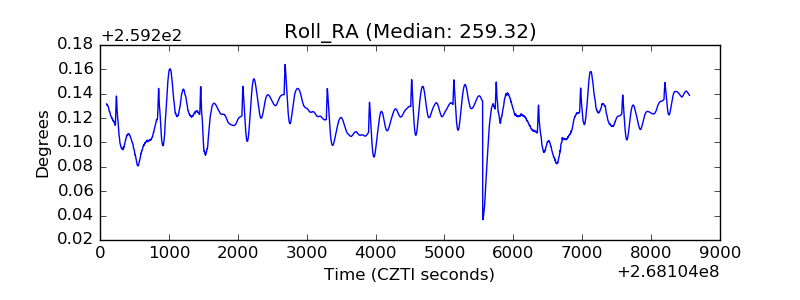 |
| Veto Counter | 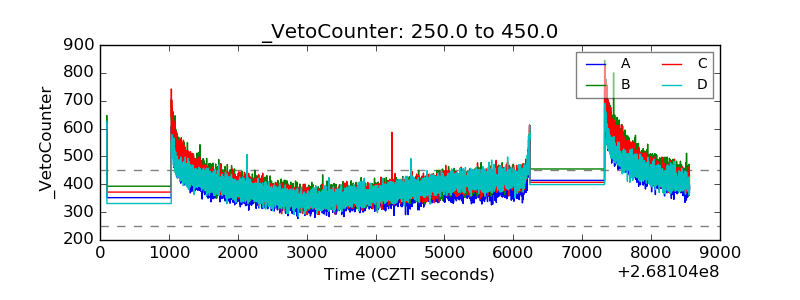 |