| Param | Original file | Final file |
|---|---|---|
| Filename | modeM0/AS1A04_011T09_9000002202_14906cztM0_level2.evt | modeM0/AS1A04_011T09_9000002202_14906cztM0_level2_quad_clean.evt |
| Size (bytes) | 479,903,040 | 81,671,040 |
| Size | 457.7 MB | 77.9 MB |
| Events in quadrant A | 3,136,989 | 527,821 |
| Events in quadrant B | 4,721,328 | 492,327 |
| Events in quadrant C | 3,179,287 | 500,968 |
| Events in quadrant D | 3,060,430 | 504,064 |
| Mode M9 | |||
|---|---|---|---|
| Quadrant | BADHDUFLAG | Total packets | Discarded packets |
| A | 0 | 14 | 0 |
| B | 0 | 14 | 0 |
| C | 0 | 14 | 0 |
| D | 0 | 15 | 0 |
| Mode M0 | |||
|---|---|---|---|
| Quadrant | BADHDUFLAG | Total packets | Discarded packets |
| A | 0 | 13286 | 3 |
| B | 0 | 18166 | 2 |
| C | 0 | 13368 | 2 |
| D | 0 | 13331 | 2 |
| Mode SS | |||
|---|---|---|---|
| Quadrant | BADHDUFLAG | Total packets | Discarded packets |
| A | 0 | 132 | 0 |
| B | 0 | 132 | 0 |
| C | 0 | 132 | 0 |
| D | 0 | 132 | 0 |
| Quadrant | Total seconds | Saturated seconds | Saturation percentage |
|---|---|---|---|
| A | 6412 | 30 | 0.467873% |
| B | 6412 | 390 | 6.082346% |
| C | 6412 | 38 | 0.592639% |
| D | 6412 | 19 | 0.296319% |
Noise dominated data is calculated using 1-second bins in cleaned event files. If a bin has >2000 counts, and if more than 50% of those come from <1% of pixels, then it is considered to be noise-dominated and hence unusable.
| Quadrant | # 1 sec bins | Bins with >0 counts | Bins with >2000 counts | High rate bins dominated by noise | Noise dominated (total time) | Noise dominated (detector-on time) | Marked lightcurve |
|---|---|---|---|---|---|---|---|
| A | 7593 | 6414 | 0 | 0 | 0.00% | 0.00% |  |
| B | 7593 | 6414 | 228 | 228 | 3.00% | 3.55% | 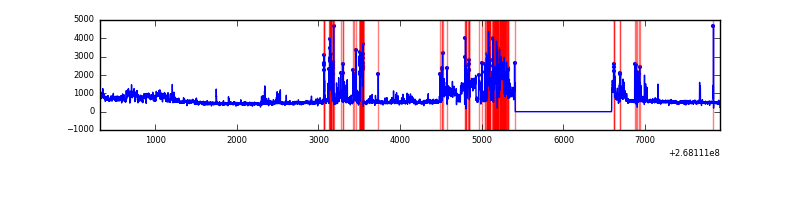 |
| C | 7593 | 6414 | 13 | 13 | 0.17% | 0.20% |  |
| D | 7593 | 6414 | 2 | 2 | 0.03% | 0.03% | 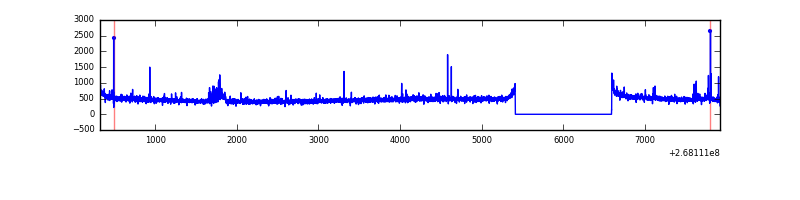 |
Top three noisy pixels from each quadrant. If the there are fewer than three noisy pixels in the level2.evt file, extra rows are filled as -1
| Pixel properties | Quadrant properties | ||||||
|---|---|---|---|---|---|---|---|
| Quadrant | DetID | PixID | Counts | Sigma | Mean | Median | Sigma |
| A | 11 | 29 | 13381 | 77.52 | 810 | 794 | 162.4 |
| A | 0 | 226 | 7024 | 38.37 | 810 | 794 | 162.4 |
| A | 3 | 1 | 6750 | 36.68 | 810 | 794 | 162.4 |
| B | 10 | 16 | 1170883 | 7956.74 | 782 | 764 | 147.1 |
| B | 3 | 64 | 286843 | 1945.32 | 782 | 764 | 147.1 |
| B | 0 | 229 | 134661 | 910.49 | 782 | 764 | 147.1 |
| C | 3 | 233 | 165984 | 933.09 | 771 | 778 | 177.1 |
| C | 13 | 61 | 5510 | 26.73 | 771 | 778 | 177.1 |
| C | 7 | 247 | 4849 | 22.99 | 771 | 778 | 177.1 |
| D | 13 | 104 | 52935 | 283.4 | 774 | 755 | 184.1 |
| D | 7 | 254 | 24179 | 127.22 | 774 | 755 | 184.1 |
| D | 2 | 234 | 23151 | 121.64 | 774 | 755 | 184.1 |
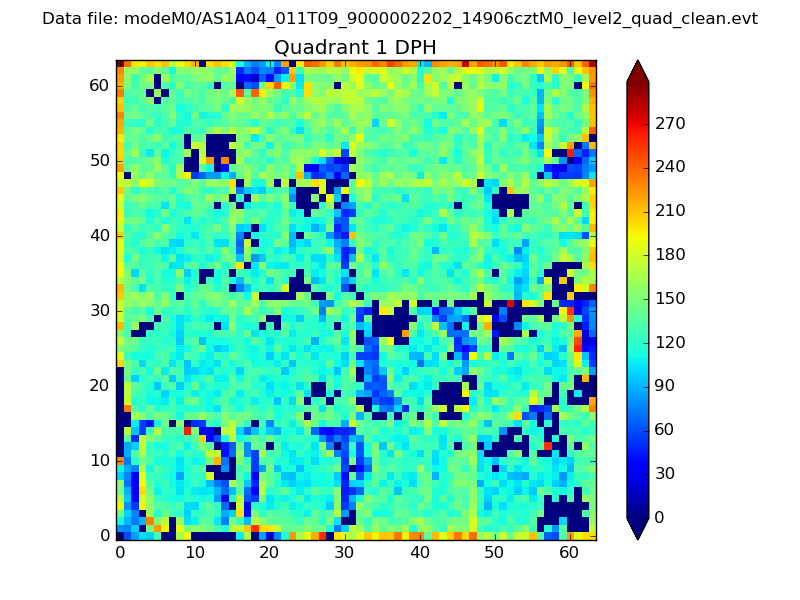
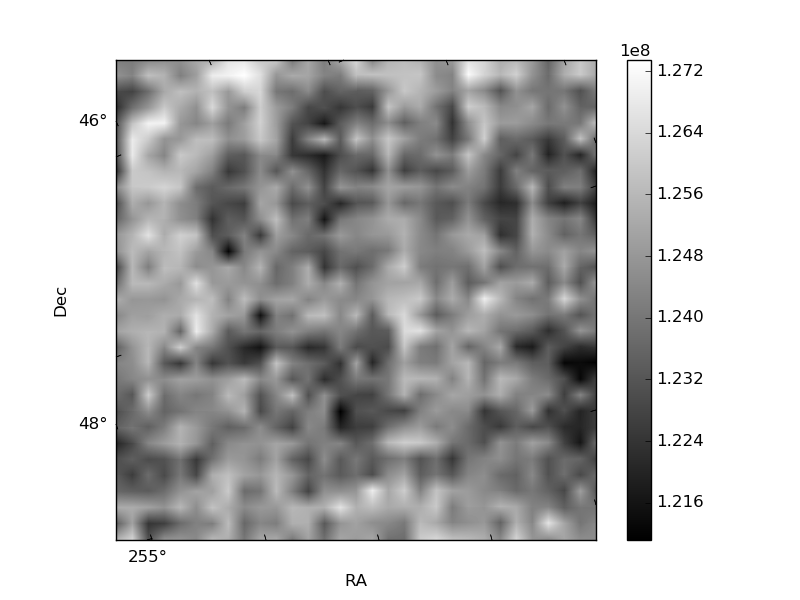
Histogram calculated using DETX and DETY for each event in the final _common_clean file
| Quadrant A |  |
 |
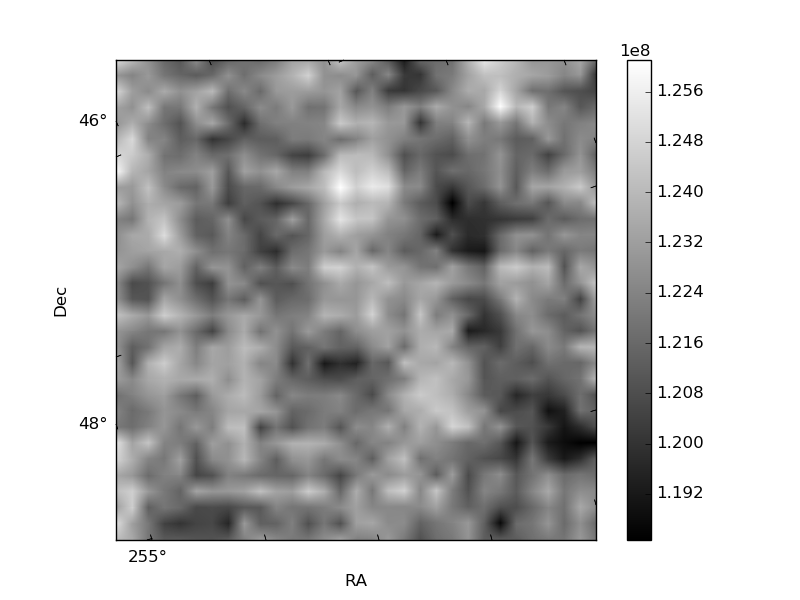
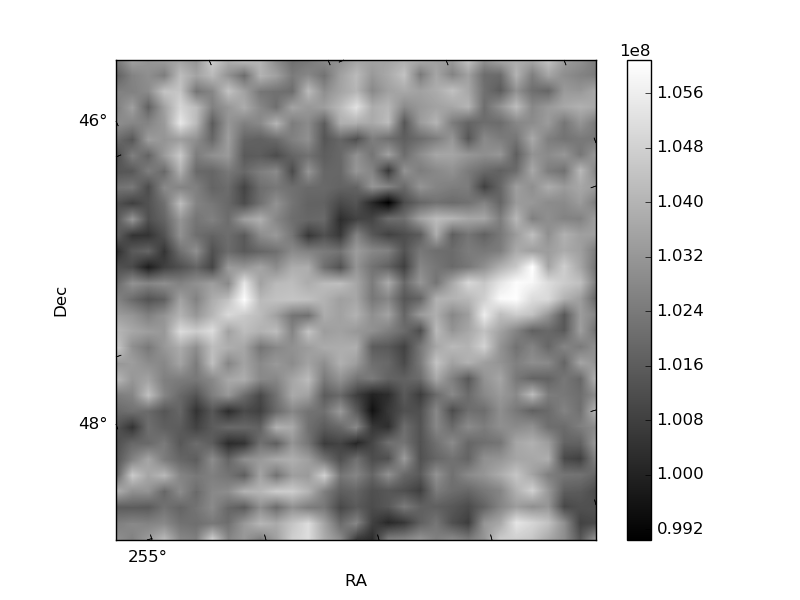
Quadrant B |
|---|---|---|---|
| Quadrant D | 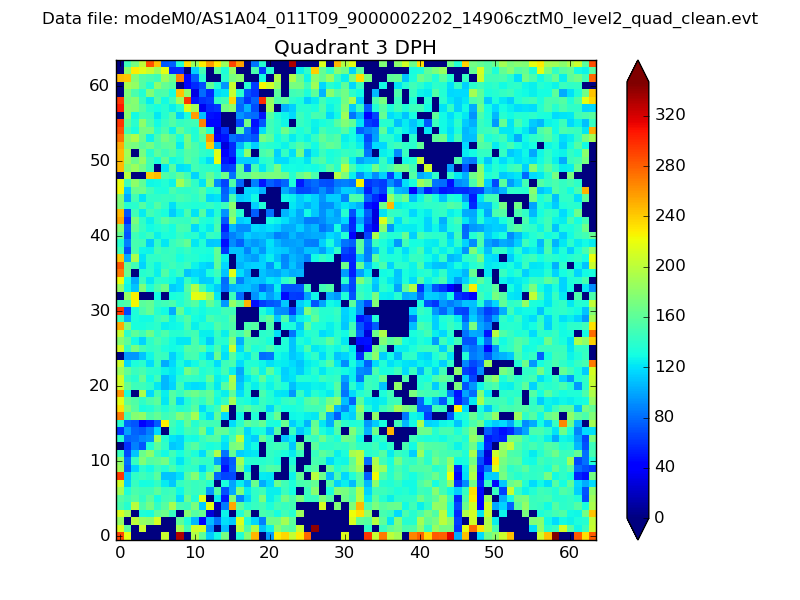 |
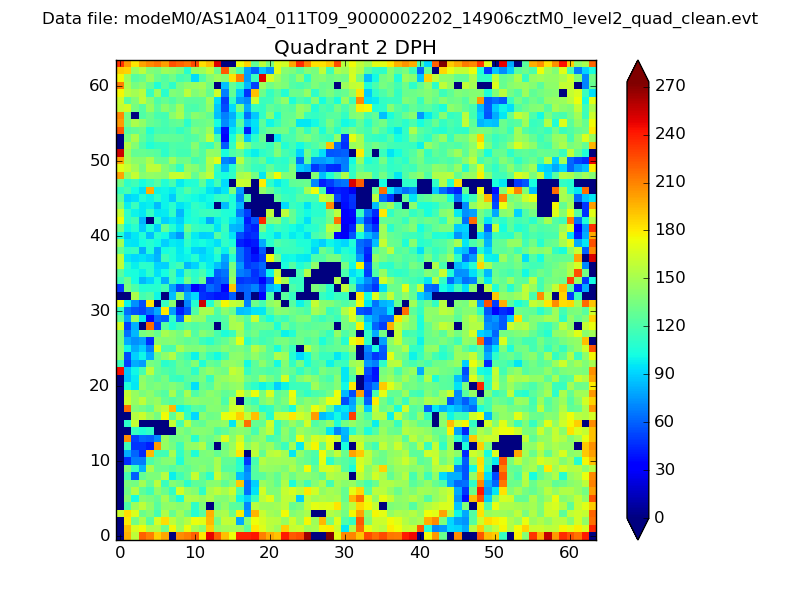 |
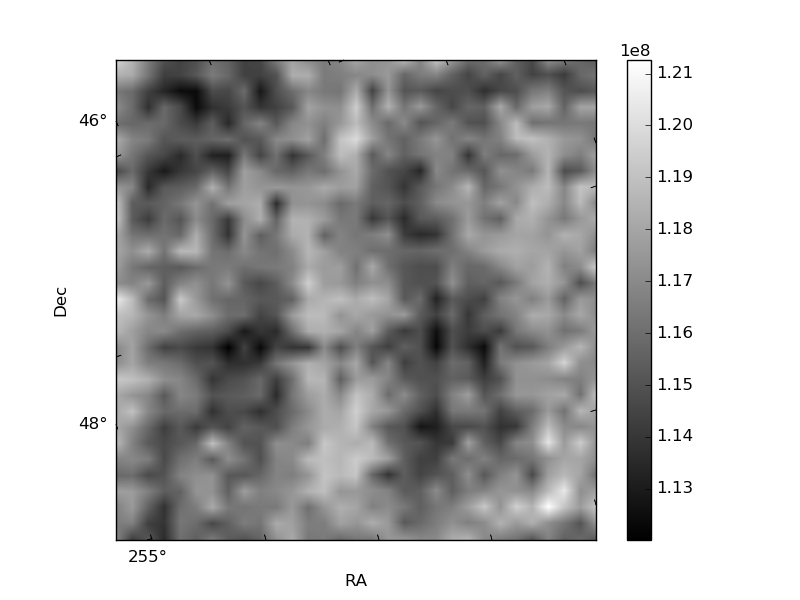
Quadrant C |
| Plot type | Count rate plots | Images |
|---|---|---|
| Comparison with Poisson distribution Blue bars denote a histogram of data divided into 1 sec bins. Red curve is a Poisson curve with rate = median count rate of data. |
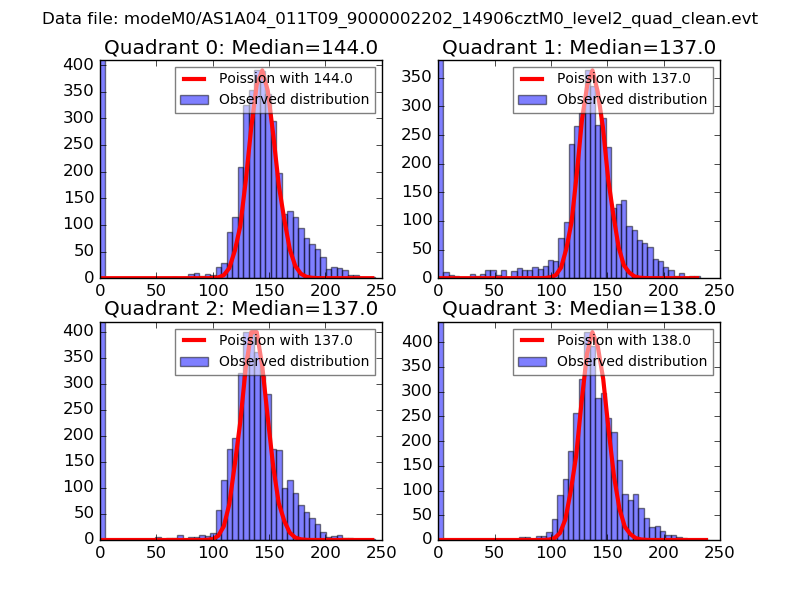 |
 |
| Quadrant-wise count rates Data is divided into 100 sec bins |
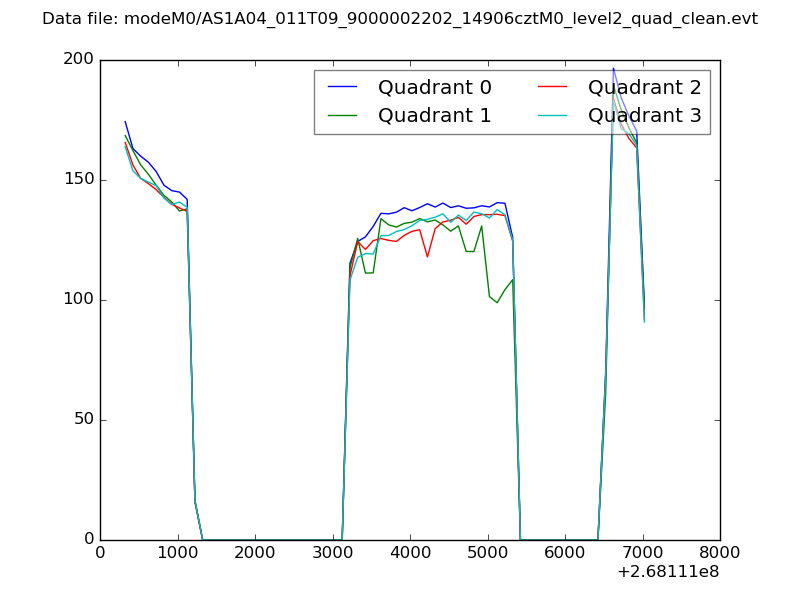 |
|
| Module-wise count rates for Quadrant A Data is divided into 100 sec bins |
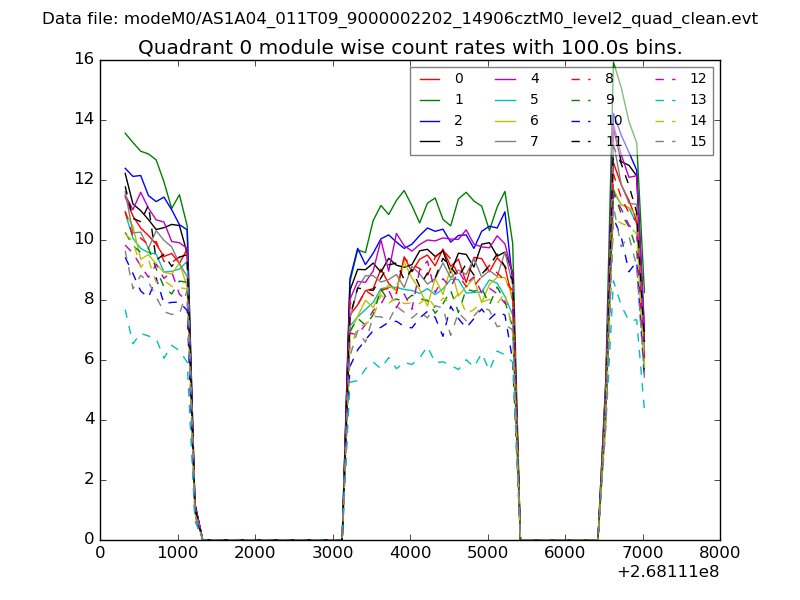 |
 |
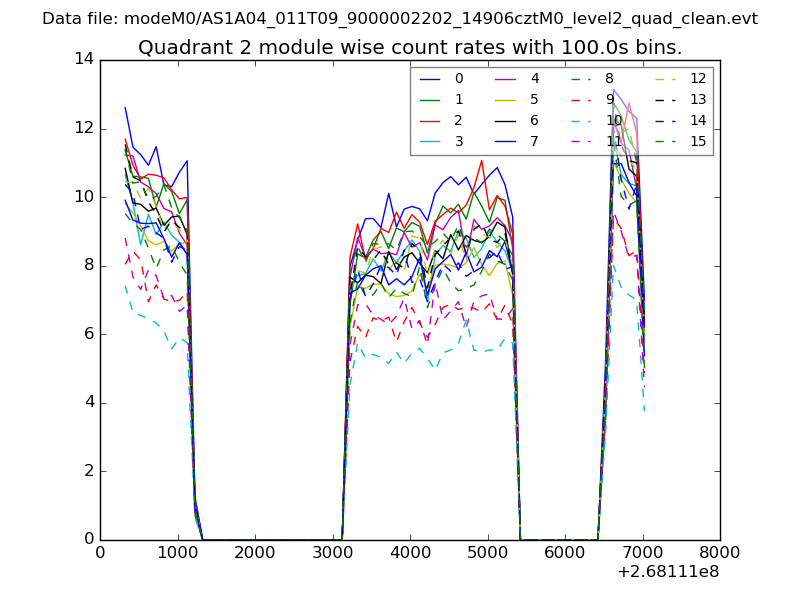
| Module-wise count rates for Quadrant B Data is divided into 100 sec bins |
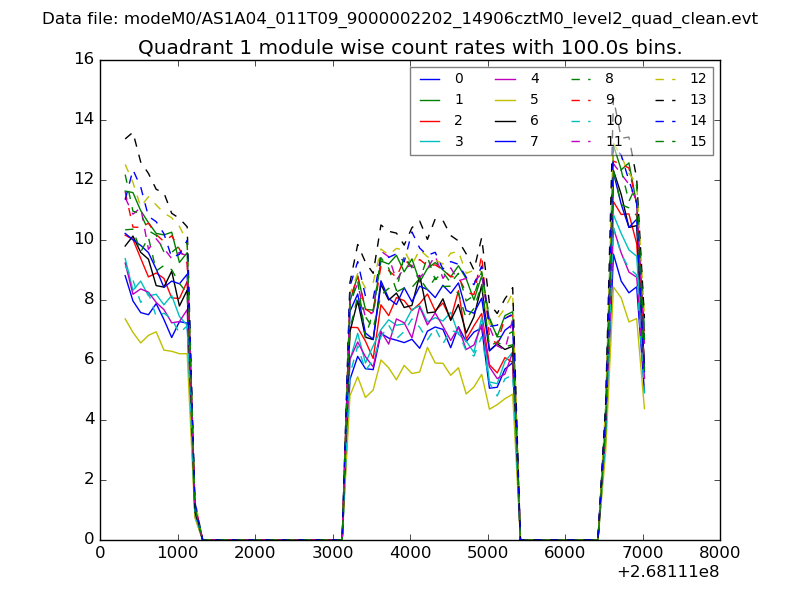 |
 |
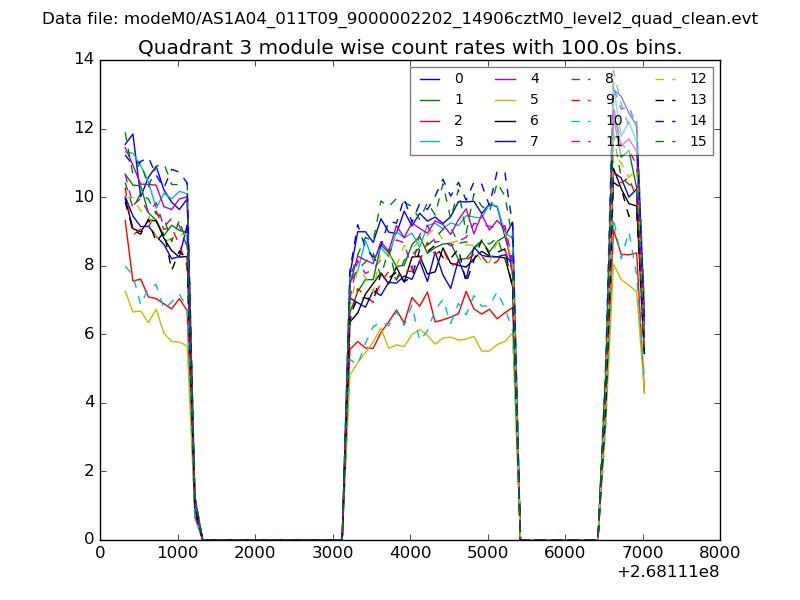
| Module-wise count rates for Quadrant C Data is divided into 100 sec bins |
 |
 |
| Module-wise count rates for Quadrant D Data is divided into 100 sec bins |
 |
 |
| Parameter | Plot |
|---|---|
| CZT HV Monitor | 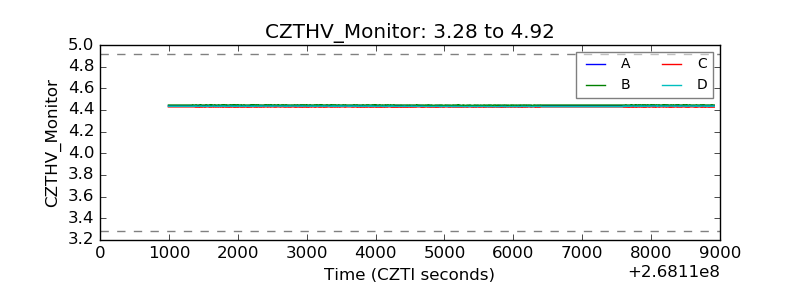 |
| D_VDD | 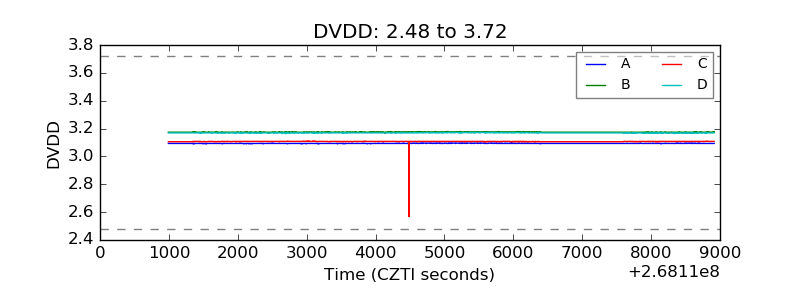 |
| Temperature 1 | 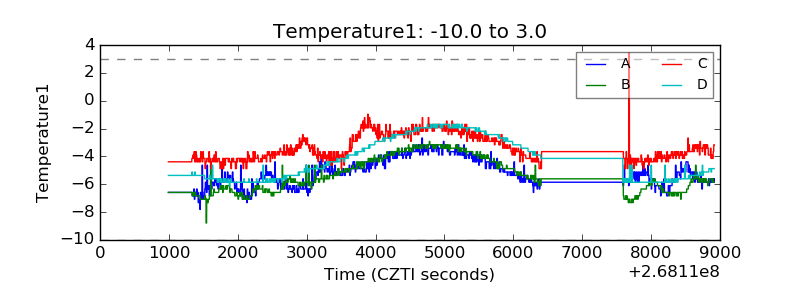 |
| Veto HV Monitor | 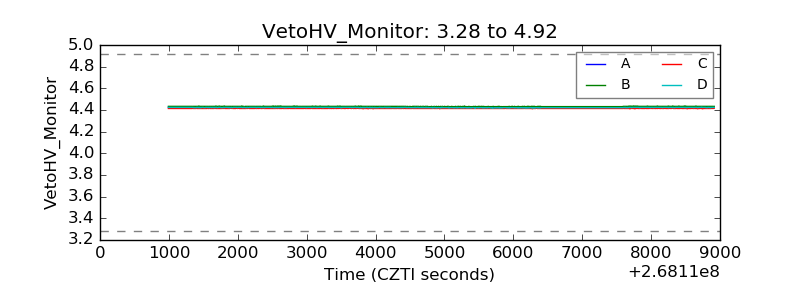 |
| Veto LLD | 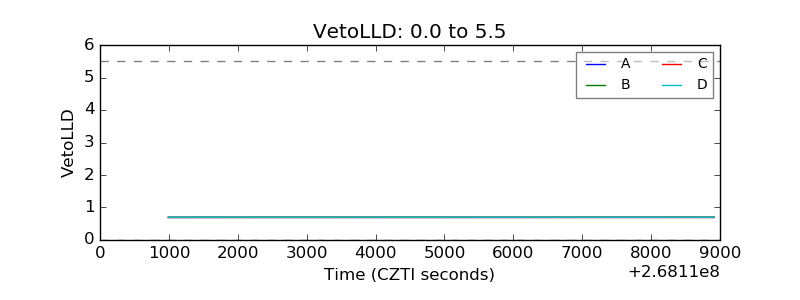 |
| Alpha Counter | 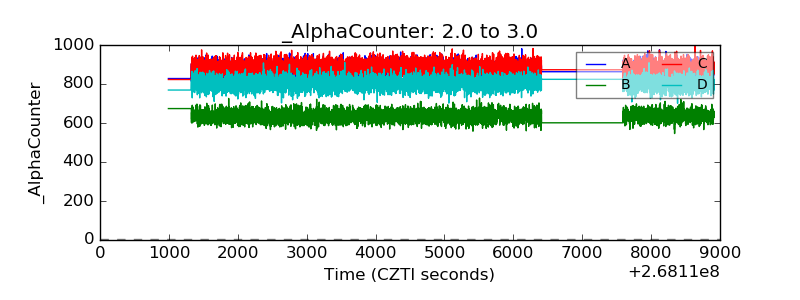 |
| _CPM_Rate | 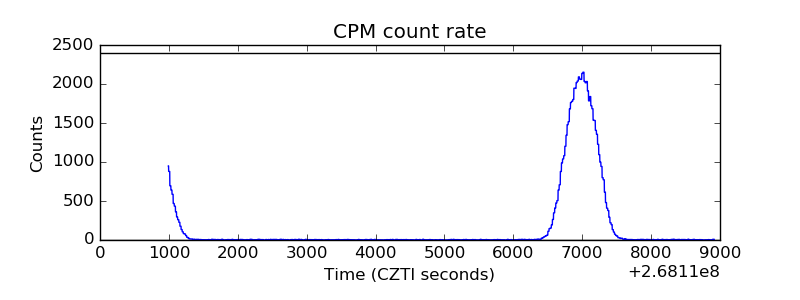 |
| CZT Counter | 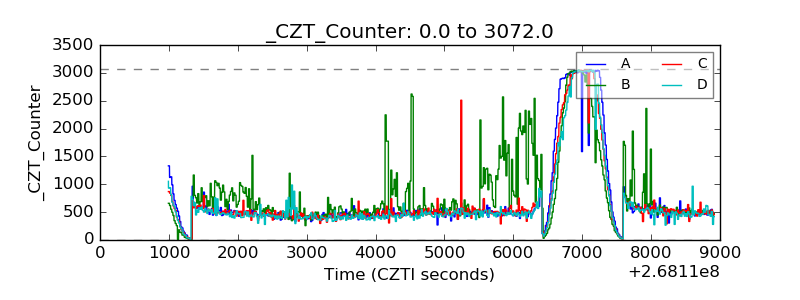 |
| +2.5 Volts monitor |  |
| +5 Volts monitor |  |
| _ROLL_ROT | 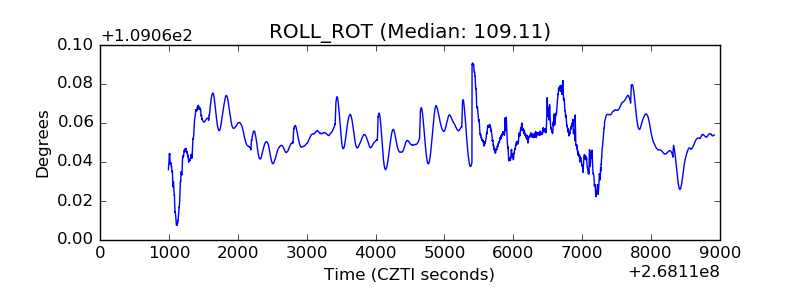 |
| _Roll_DEC | 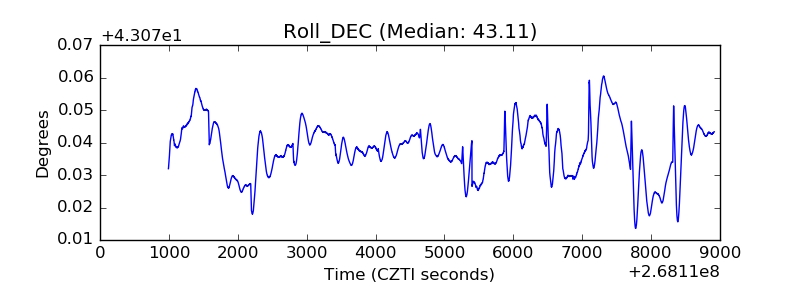 |
| _Roll_RA | 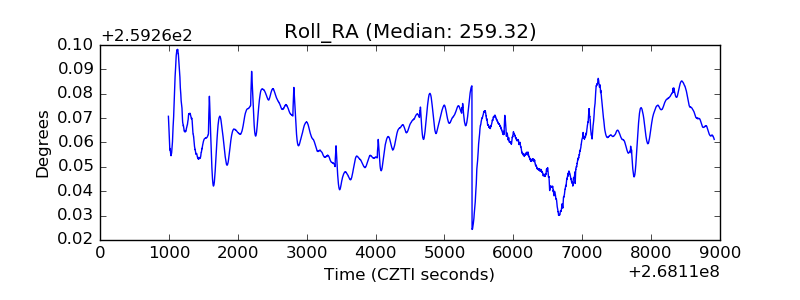 |
| Veto Counter | 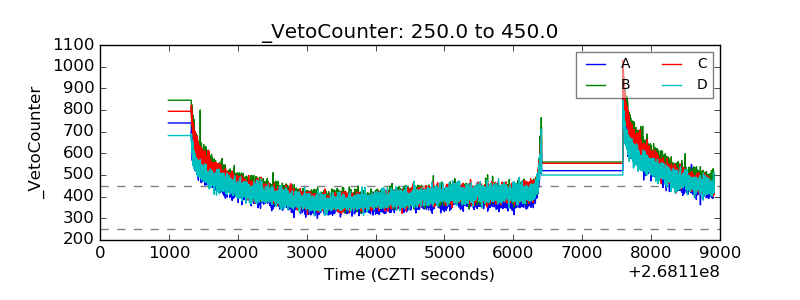 |