| Param | Original file | Final file |
|---|---|---|
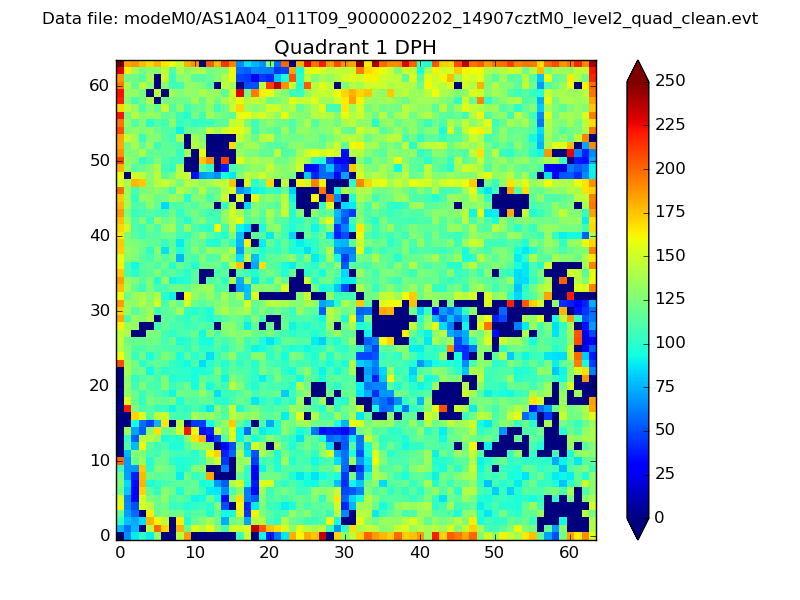
| Filename | modeM0/AS1A04_011T09_9000002202_14907cztM0_level2.evt | modeM0/AS1A04_011T09_9000002202_14907cztM0_level2_quad_clean.evt |
| Size (bytes) | 464,941,440 | 73,471,680 |
| Size | 443.4 MB | 70.1 MB |
| Events in quadrant A | 3,232,274 | 463,391 |
| Events in quadrant B | 3,547,355 | 448,914 |
| Events in quadrant C | 3,412,358 | 434,633 |
| Events in quadrant D | 3,462,992 | 440,112 |
| Mode M9 | |||
|---|---|---|---|
| Quadrant | BADHDUFLAG | Total packets | Discarded packets |
| A | 0 | 13 | 0 |
| B | 0 | 13 | 0 |
| C | 0 | 13 | 0 |
| D | 0 | 13 | 0 |
| Mode M0 | |||
|---|---|---|---|
| Quadrant | BADHDUFLAG | Total packets | Discarded packets |
| A | 0 | 13369 | 3 |
| B | 0 | 14320 | 2 |
| C | 0 | 13866 | 2 |
| D | 0 | 14276 | 2 |
| Mode SS | |||
|---|---|---|---|
| Quadrant | BADHDUFLAG | Total packets | Discarded packets |
| A | 0 | 128 | 0 |
| B | 0 | 128 | 0 |
| C | 0 | 128 | 0 |
| D | 0 | 128 | 0 |
| Quadrant | Total seconds | Saturated seconds | Saturation percentage |
|---|---|---|---|
| A | 6268 | 58 | 0.925335% |
| B | 6268 | 121 | 1.930440% |
| C | 6268 | 41 | 0.654116% |
| D | 6269 | 76 | 1.212315% |
Noise dominated data is calculated using 1-second bins in cleaned event files. If a bin has >2000 counts, and if more than 50% of those come from <1% of pixels, then it is considered to be noise-dominated and hence unusable.
| Quadrant | # 1 sec bins | Bins with >0 counts | Bins with >2000 counts | High rate bins dominated by noise | Noise dominated (total time) | Noise dominated (detector-on time) | Marked lightcurve |
|---|---|---|---|---|---|---|---|
| A | 7534 | 6270 | 0 | 0 | 0.00% | 0.00% |  |
| B | 7534 | 6270 | 23 | 23 | 0.31% | 0.37% | 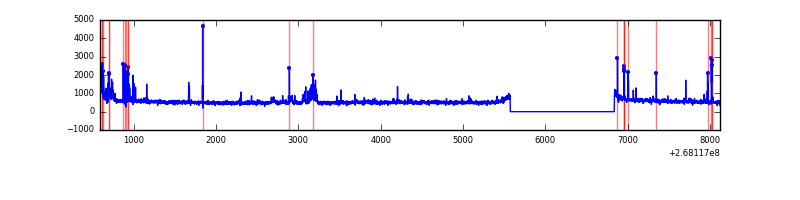 |
| C | 7534 | 6270 | 9 | 9 | 0.12% | 0.14% | 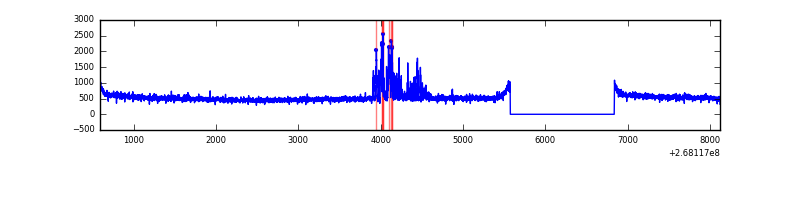 |
| D | 7535 | 6271 | 42 | 42 | 0.56% | 0.67% | 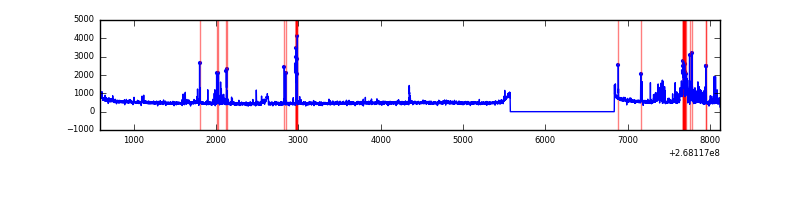 |
Top three noisy pixels from each quadrant. If the there are fewer than three noisy pixels in the level2.evt file, extra rows are filled as -1
| Pixel properties | Quadrant properties | ||||||
|---|---|---|---|---|---|---|---|
| Quadrant | DetID | PixID | Counts | Sigma | Mean | Median | Sigma |
| A | 3 | 1 | 13173 | 74.51 | 836 | 821 | 165.8 |
| A | 0 | 226 | 7460 | 40.05 | 836 | 821 | 165.8 |
| A | 12 | 194 | 6158 | 32.19 | 836 | 821 | 165.8 |
| B | 10 | 16 | 143325 | 931.19 | 822 | 804 | 153.1 |
| B | 3 | 64 | 98507 | 638.36 | 822 | 804 | 153.1 |
| B | 0 | 229 | 51927 | 334.02 | 822 | 804 | 153.1 |
| C | 3 | 233 | 333625 | 1848.73 | 788 | 793 | 180.0 |
| C | 13 | 61 | 5621 | 26.82 | 788 | 793 | 180.0 |
| C | 14 | 220 | 2847 | 11.41 | 788 | 793 | 180.0 |
| D | 7 | 254 | 137976 | 732.88 | 793 | 775 | 187.2 |
| D | 2 | 136 | 86004 | 455.27 | 793 | 775 | 187.2 |
| D | 10 | 70 | 81687 | 432.21 | 793 | 775 | 187.2 |
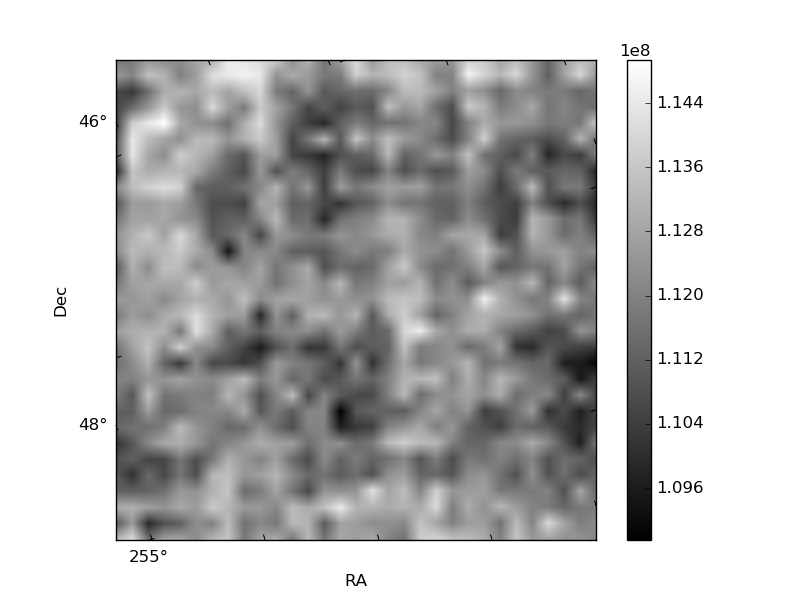
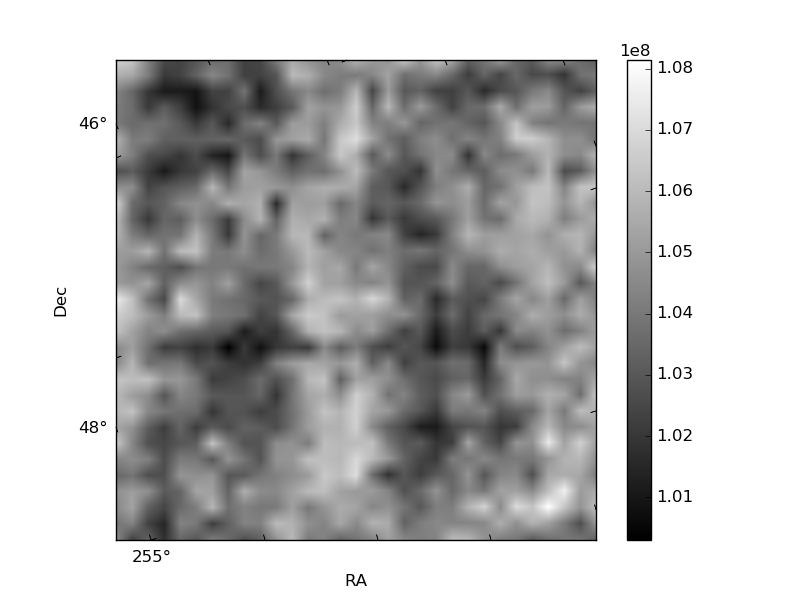
Histogram calculated using DETX and DETY for each event in the final _common_clean file
| Quadrant A |  |
 |
Quadrant B |
|---|---|---|---|
| Quadrant D | 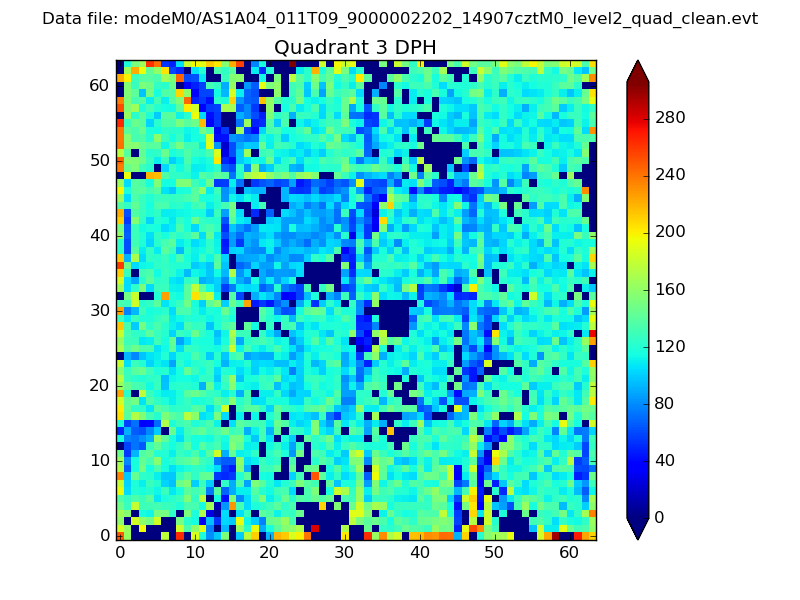 |
 |
Quadrant C |
| Plot type | Count rate plots | Images |
|---|---|---|
| Comparison with Poisson distribution Blue bars denote a histogram of data divided into 1 sec bins. Red curve is a Poisson curve with rate = median count rate of data. |
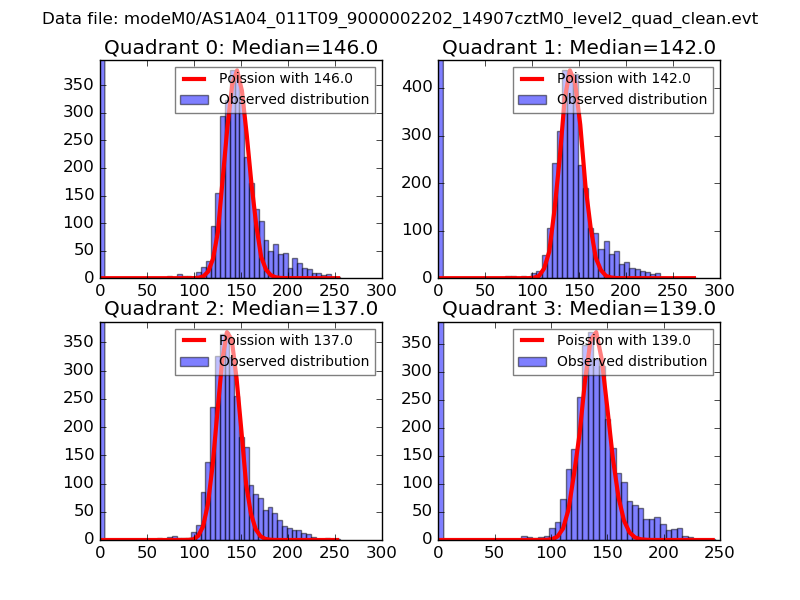 |
 |
| Quadrant-wise count rates Data is divided into 100 sec bins |
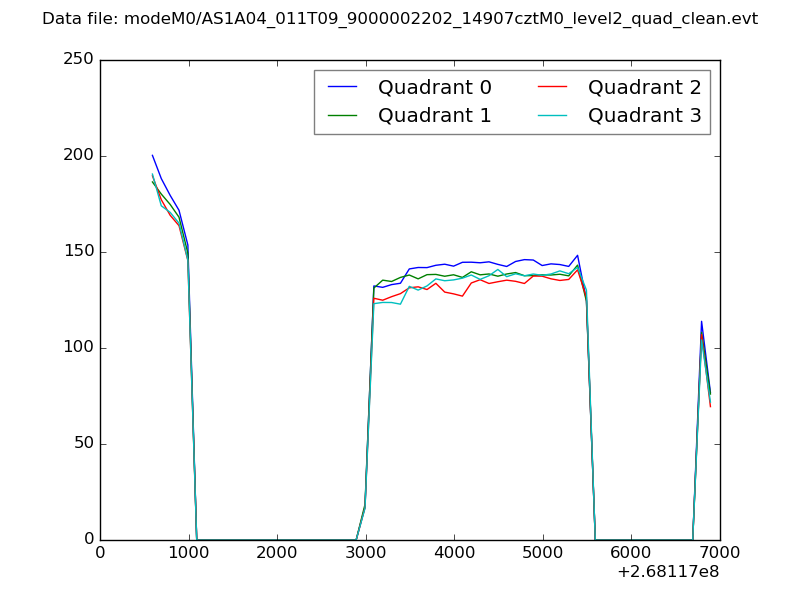 |
|
| Module-wise count rates for Quadrant A Data is divided into 100 sec bins |
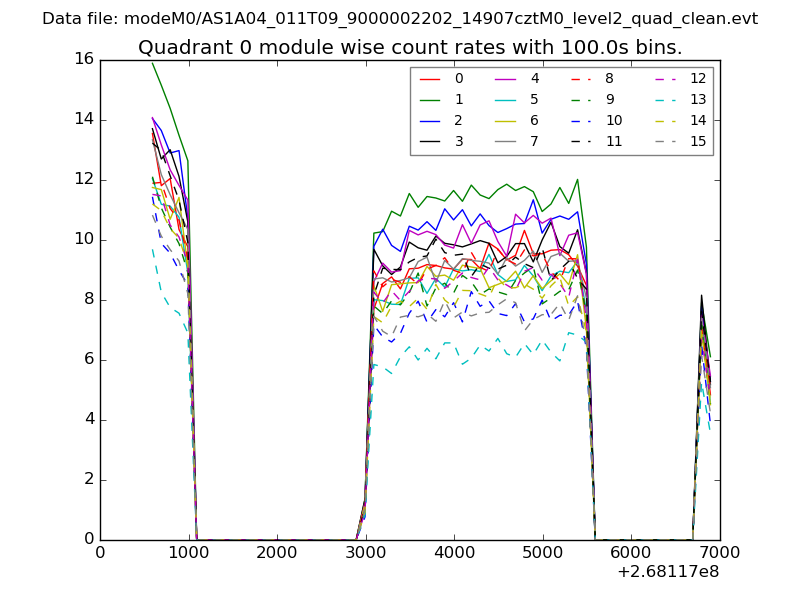 |
 |
| Module-wise count rates for Quadrant B Data is divided into 100 sec bins |
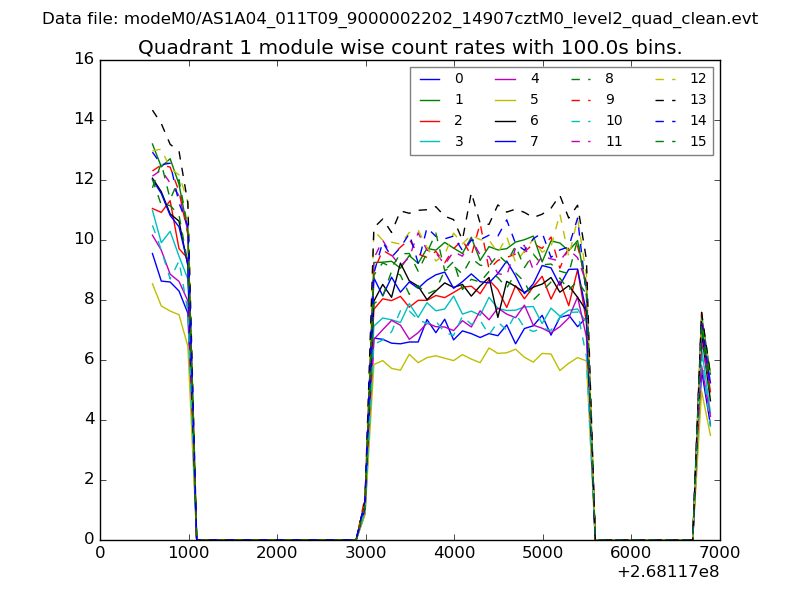 |
 |
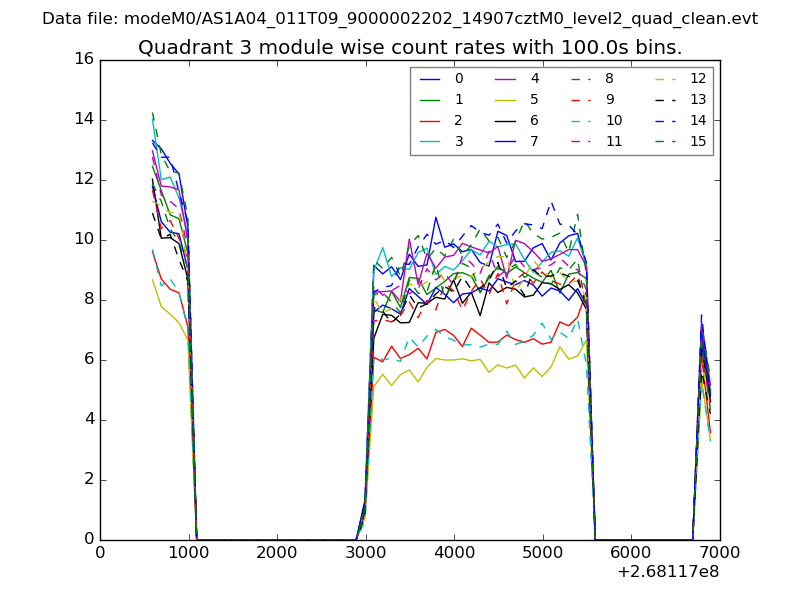
| Module-wise count rates for Quadrant C Data is divided into 100 sec bins |
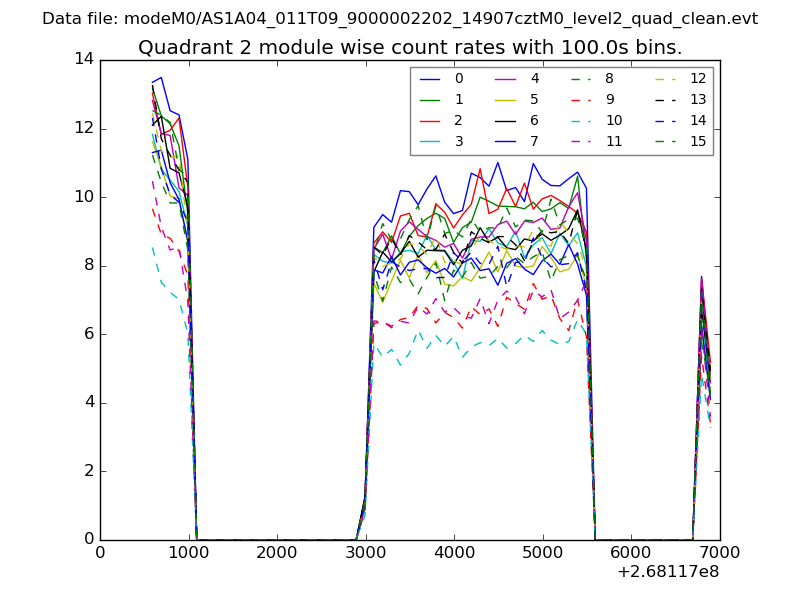 |
 |
| Module-wise count rates for Quadrant D Data is divided into 100 sec bins |
 |
 |
| Parameter | Plot |
|---|---|
| CZT HV Monitor | 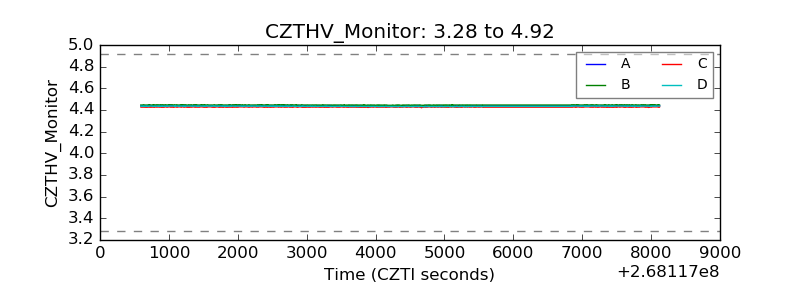 |
| D_VDD | 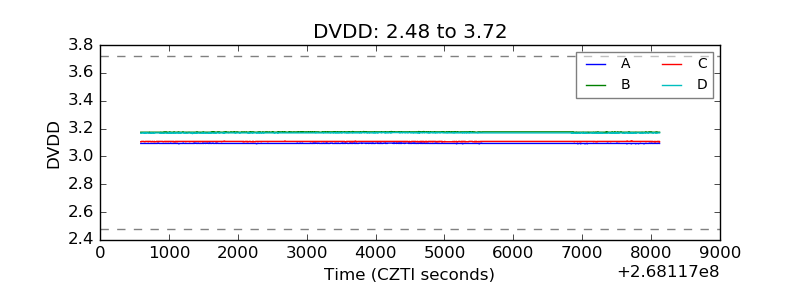 |
| Temperature 1 | 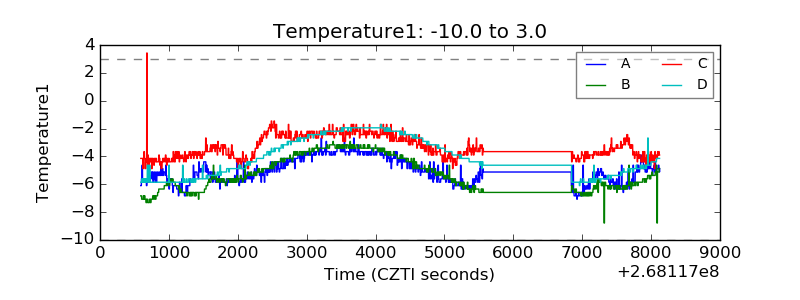 |
| Veto HV Monitor | 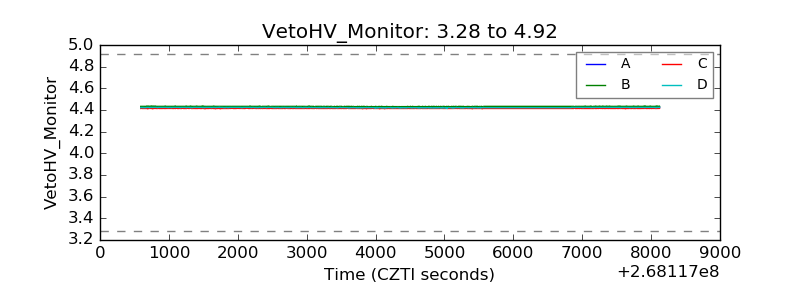 |
| Veto LLD | 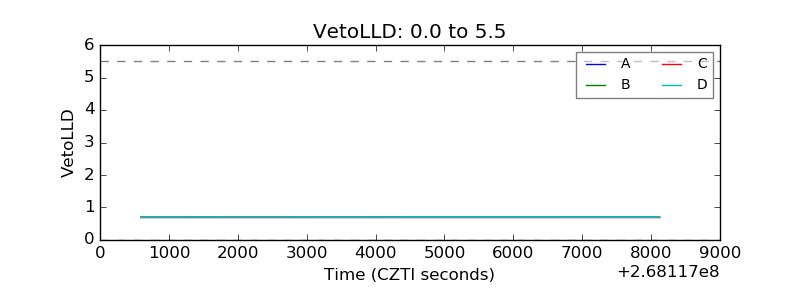 |
| Alpha Counter | 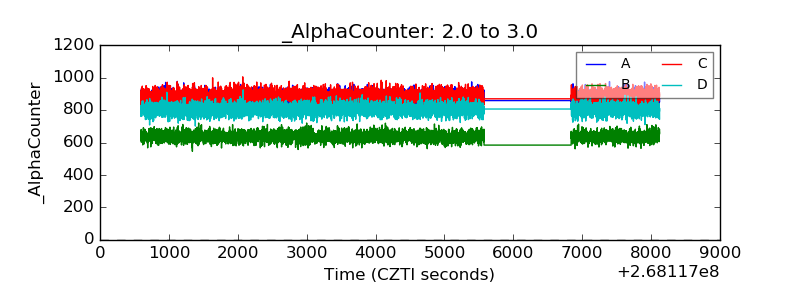 |
| _CPM_Rate | 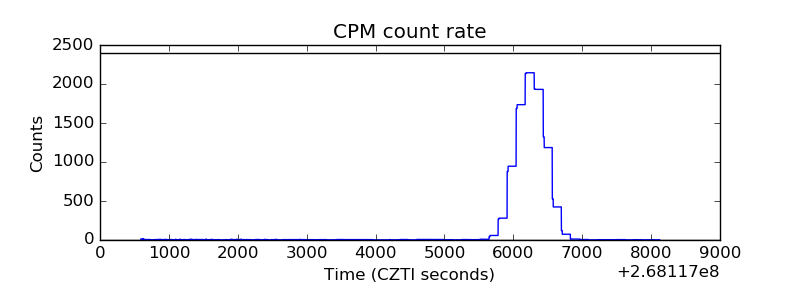 |
| CZT Counter | 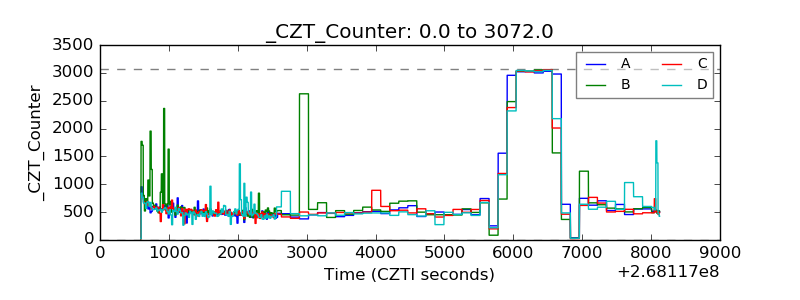 |
| +2.5 Volts monitor |  |
| +5 Volts monitor |  |
| _ROLL_ROT | 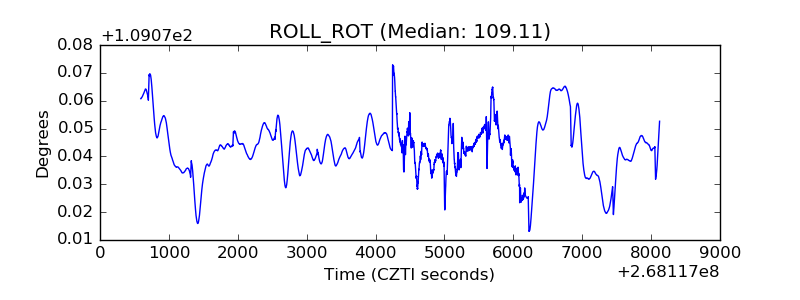 |
| _Roll_DEC | 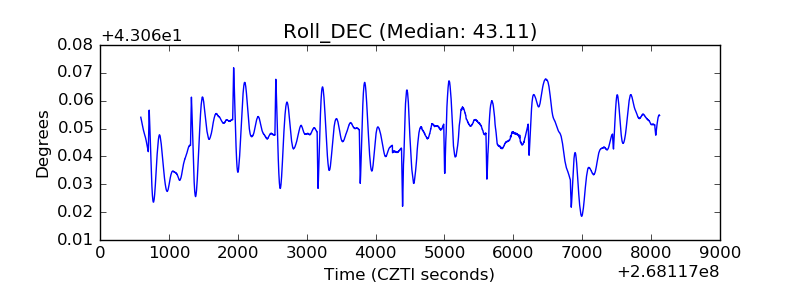 |
| _Roll_RA | 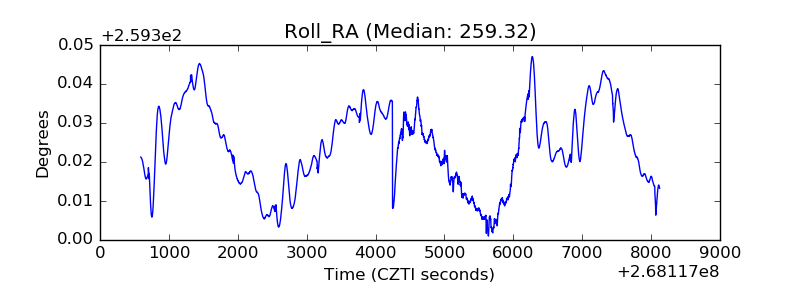 |
| Veto Counter | 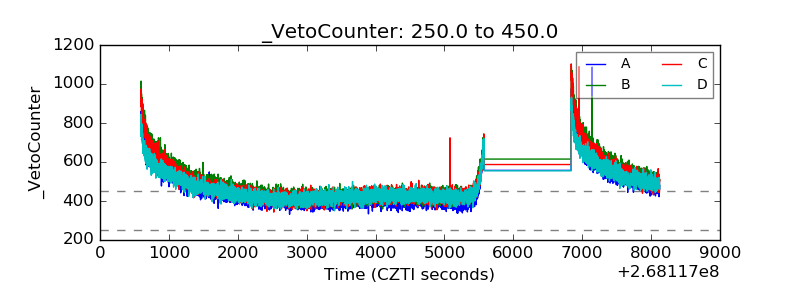 |