| Param | Original file | Final file |
|---|---|---|
| Filename | modeM0/AS1A04_011T09_9000002202_14908cztM0_level2.evt | modeM0/AS1A04_011T09_9000002202_14908cztM0_level2_quad_clean.evt |
| Size (bytes) | 321,508,800 | 51,560,640 |
| Size | 306.6 MB | 49.2 MB |
| Events in quadrant A | 2,177,753 | 330,183 |
| Events in quadrant B | 2,554,302 | 316,217 |
| Events in quadrant C | 2,181,284 | 308,332 |
| Events in quadrant D | 2,536,169 | 309,202 |
| Mode M9 | |||
|---|---|---|---|
| Quadrant | BADHDUFLAG | Total packets | Discarded packets |
| A | 0 | 9 | 0 |
| B | 0 | 9 | 0 |
| C | 0 | 9 | 0 |
| D | 0 | 10 | 0 |
| Mode M0 | |||
|---|---|---|---|
| Quadrant | BADHDUFLAG | Total packets | Discarded packets |
| A | 0 | 8919 | 1 |
| B | 0 | 10129 | 1 |
| C | 0 | 8799 | 1 |
| D | 0 | 10213 | 1 |
| Mode SS | |||
|---|---|---|---|
| Quadrant | BADHDUFLAG | Total packets | Discarded packets |
| A | 0 | 84 | 0 |
| B | 0 | 84 | 0 |
| C | 0 | 84 | 0 |
| D | 0 | 84 | 0 |
| Quadrant | Total seconds | Saturated seconds | Saturation percentage |
|---|---|---|---|
| A | 4219 | 14 | 0.331832% |
| B | 4219 | 81 | 1.919886% |
| C | 4219 | 6 | 0.142214% |
| D | 4219 | 57 | 1.351031% |
Noise dominated data is calculated using 1-second bins in cleaned event files. If a bin has >2000 counts, and if more than 50% of those come from <1% of pixels, then it is considered to be noise-dominated and hence unusable.
| Quadrant | # 1 sec bins | Bins with >0 counts | Bins with >2000 counts | High rate bins dominated by noise | Noise dominated (total time) | Noise dominated (detector-on time) | Marked lightcurve |
|---|---|---|---|---|---|---|---|
| A | 4220 | 4220 | 0 | 0 | 0.00% | 0.00% |  |
| B | 4220 | 4220 | 49 | 49 | 1.16% | 1.16% | 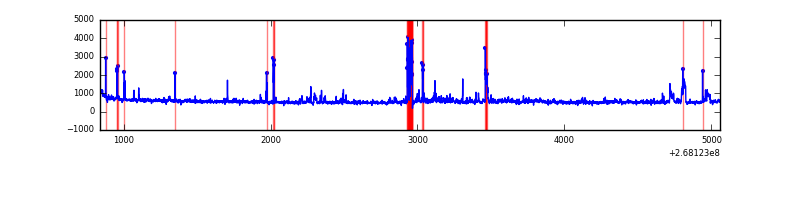 |
| C | 4220 | 4220 | 0 | 0 | 0.00% | 0.00% | 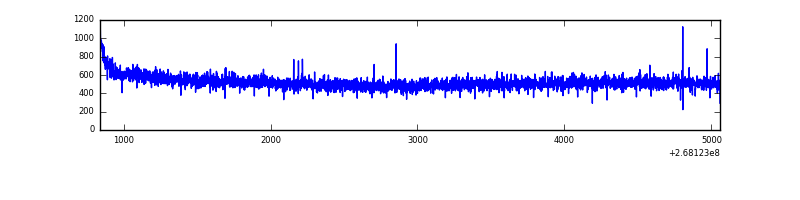 |
| D | 4220 | 4220 | 52 | 52 | 1.23% | 1.23% |  |
Top three noisy pixels from each quadrant. If the there are fewer than three noisy pixels in the level2.evt file, extra rows are filled as -1
| Pixel properties | Quadrant properties | ||||||
|---|---|---|---|---|---|---|---|
| Quadrant | DetID | PixID | Counts | Sigma | Mean | Median | Sigma |
| A | 3 | 1 | 17135 | 146.92 | 561 | 552 | 112.9 |
| A | 0 | 226 | 4832 | 37.92 | 561 | 552 | 112.9 |
| A | 12 | 194 | 4121 | 31.62 | 561 | 552 | 112.9 |
| B | 10 | 16 | 135029 | 1317.05 | 547 | 535 | 102.1 |
| B | 3 | 64 | 124486 | 1213.81 | 547 | 535 | 102.1 |
| B | 0 | 229 | 79551 | 773.78 | 547 | 535 | 102.1 |
| C | 3 | 233 | 123088 | 1017.65 | 527 | 530 | 120.4 |
| C | 13 | 61 | 3772 | 26.92 | 527 | 530 | 120.4 |
| C | 3 | 232 | 1892 | 11.31 | 527 | 530 | 120.4 |
| D | 7 | 223 | 200826 | 1601.64 | 532 | 520 | 125.1 |
| D | 7 | 254 | 155483 | 1239.08 | 532 | 520 | 125.1 |
| D | 13 | 249 | 57381 | 454.66 | 532 | 520 | 125.1 |
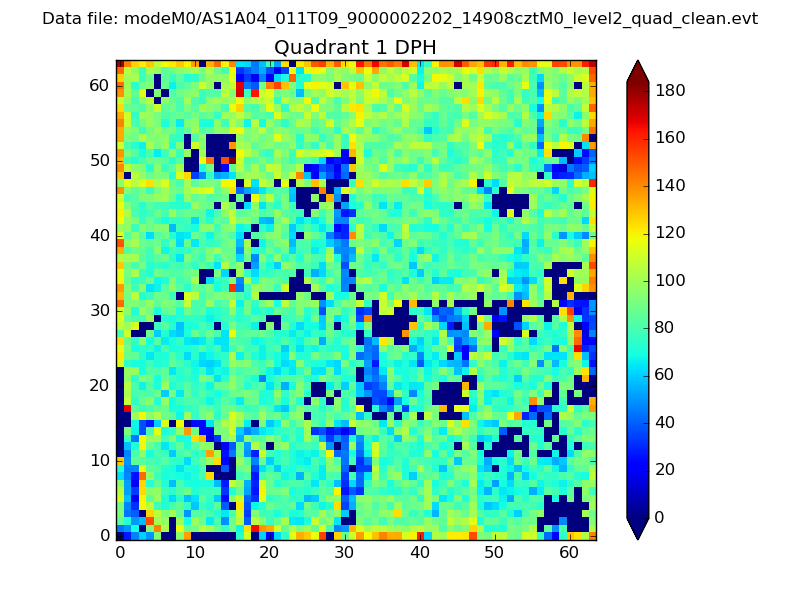
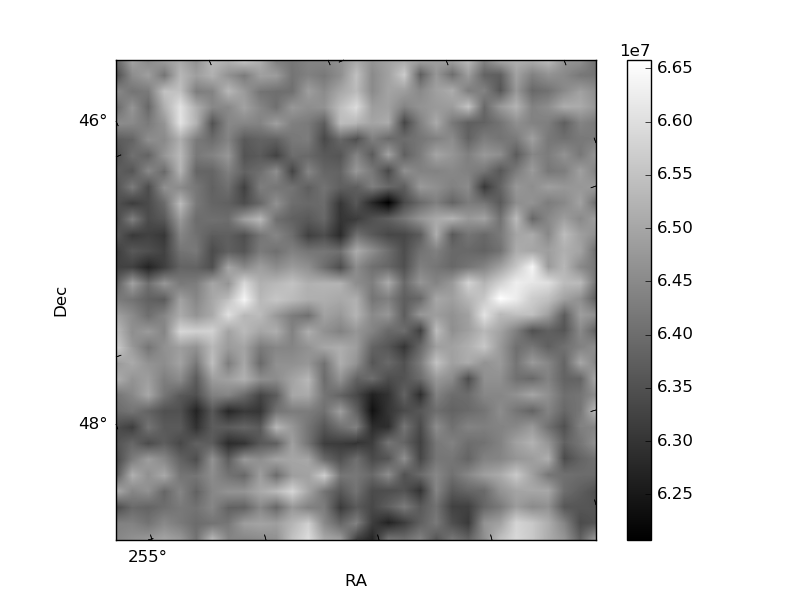
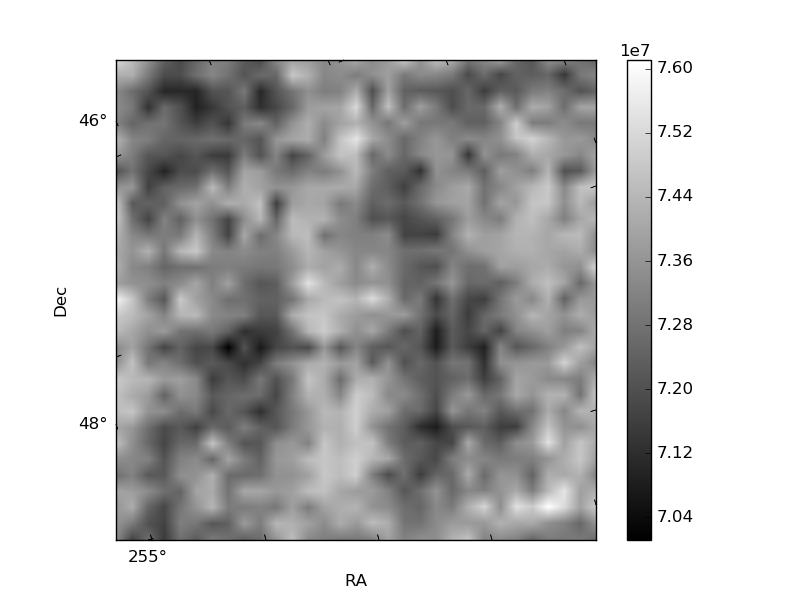
Histogram calculated using DETX and DETY for each event in the final _common_clean file
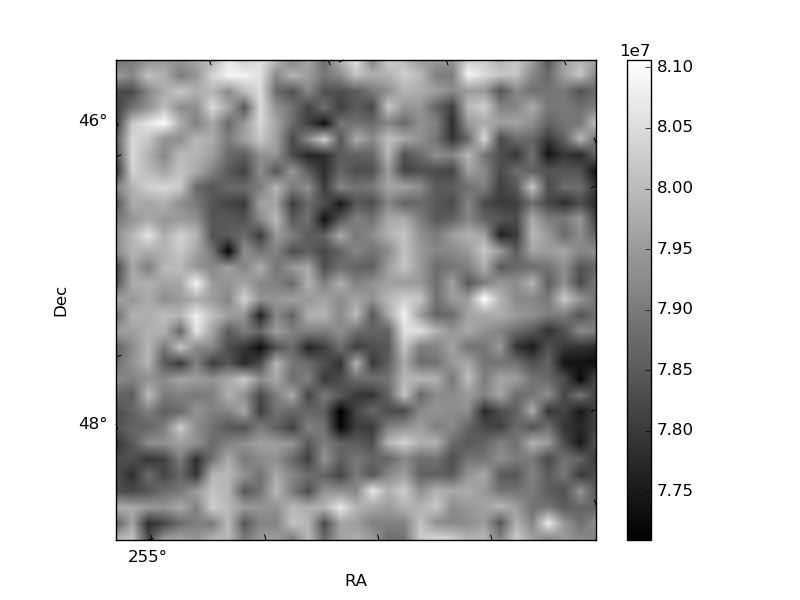
| Quadrant A | 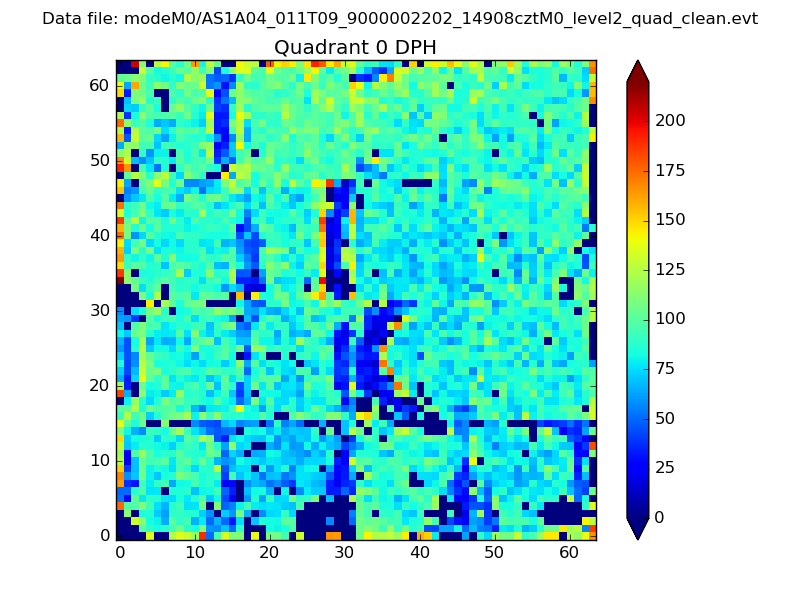 |
 |
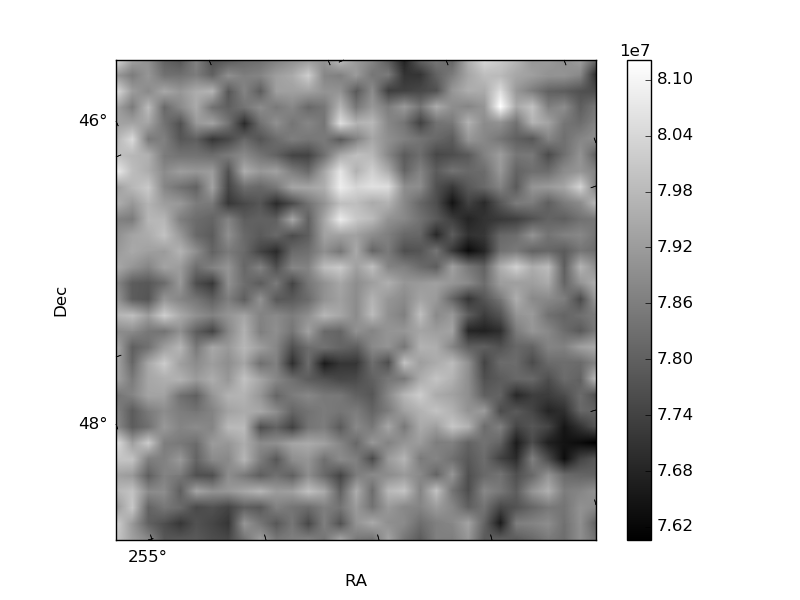
Quadrant B |
|---|---|---|---|
| Quadrant D |  |
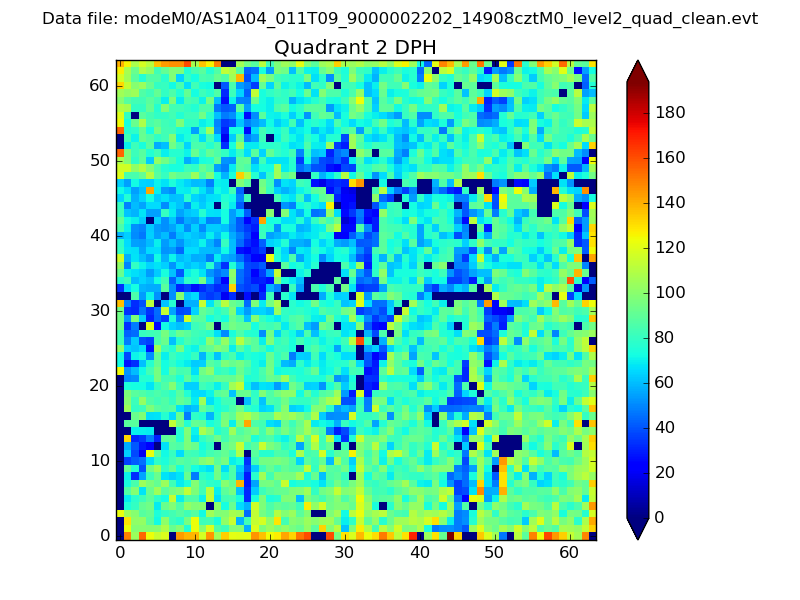 |
Quadrant C |
| Plot type | Count rate plots | Images |
|---|---|---|
| Comparison with Poisson distribution Blue bars denote a histogram of data divided into 1 sec bins. Red curve is a Poisson curve with rate = median count rate of data. |
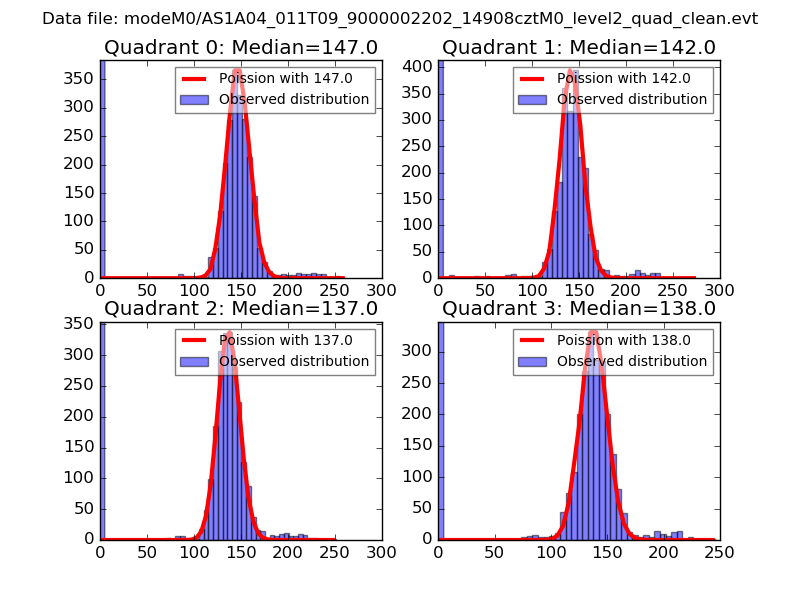 |
 |
| Quadrant-wise count rates Data is divided into 100 sec bins |
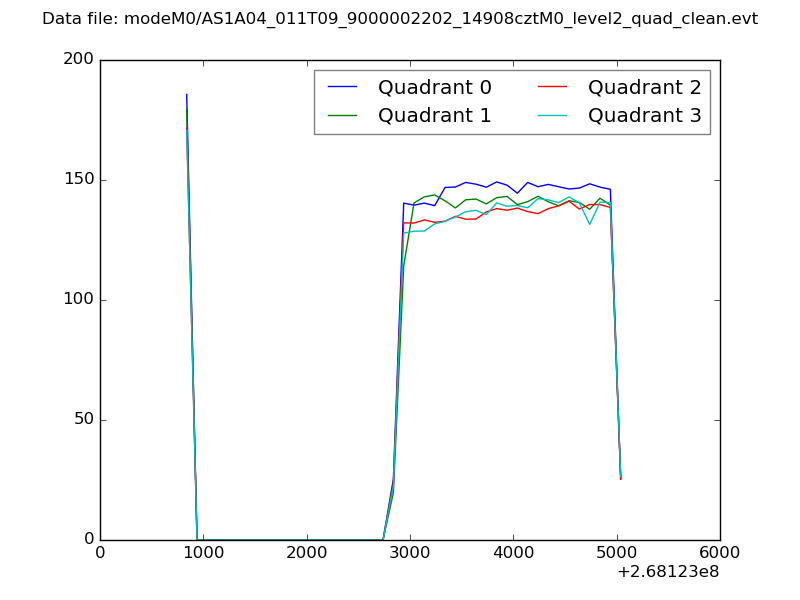 |
|
| Module-wise count rates for Quadrant A Data is divided into 100 sec bins |
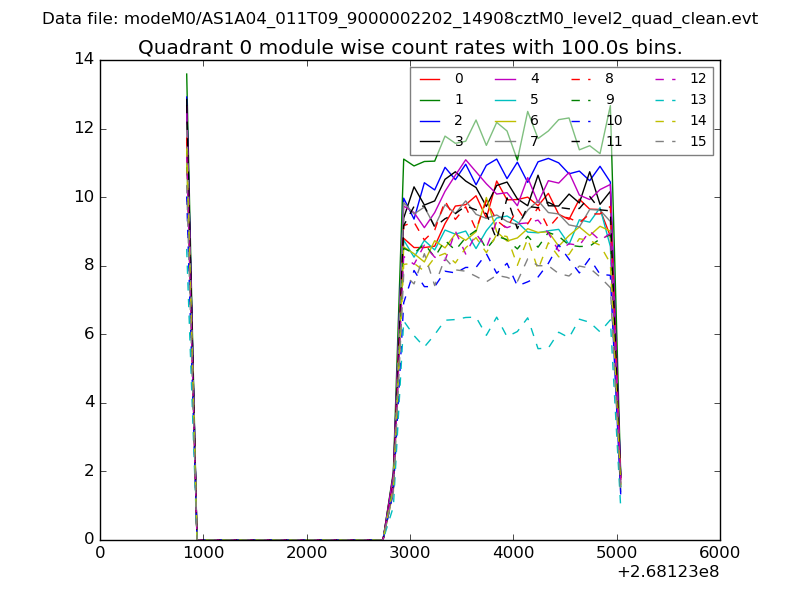 |
 |
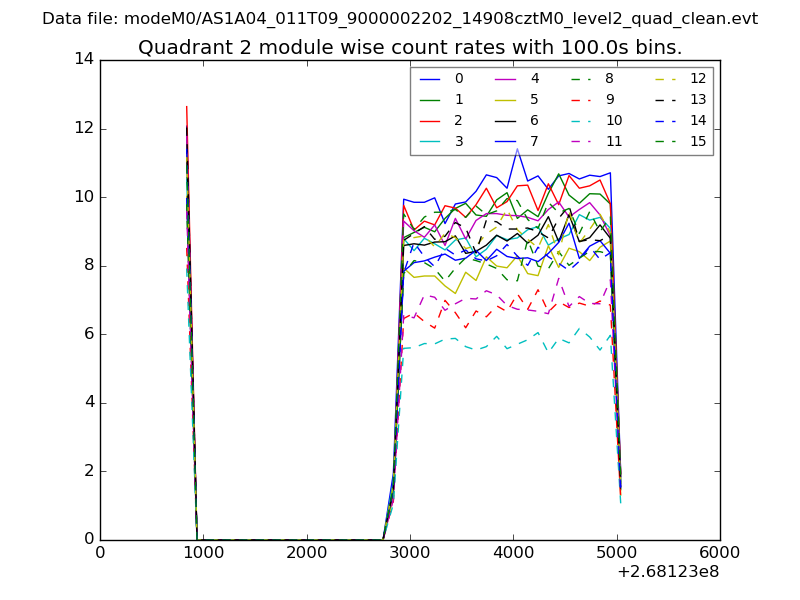
| Module-wise count rates for Quadrant B Data is divided into 100 sec bins |
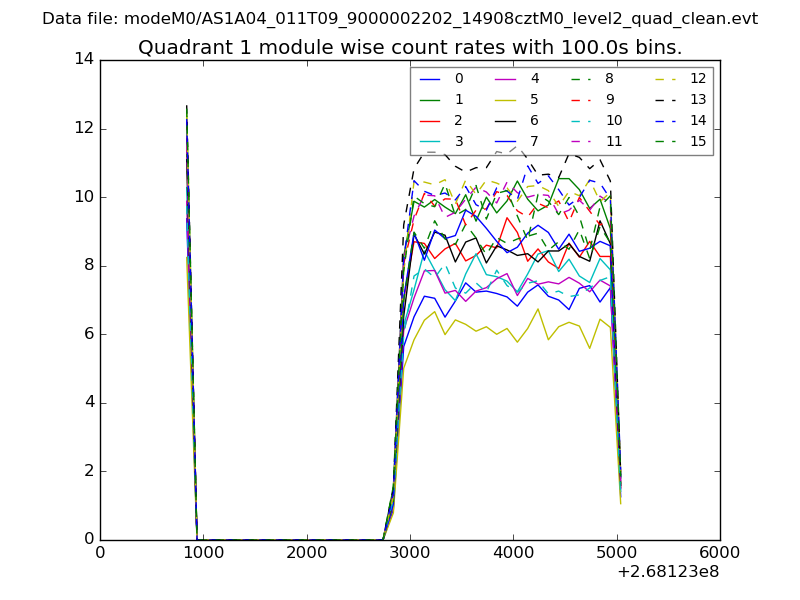 |
 |
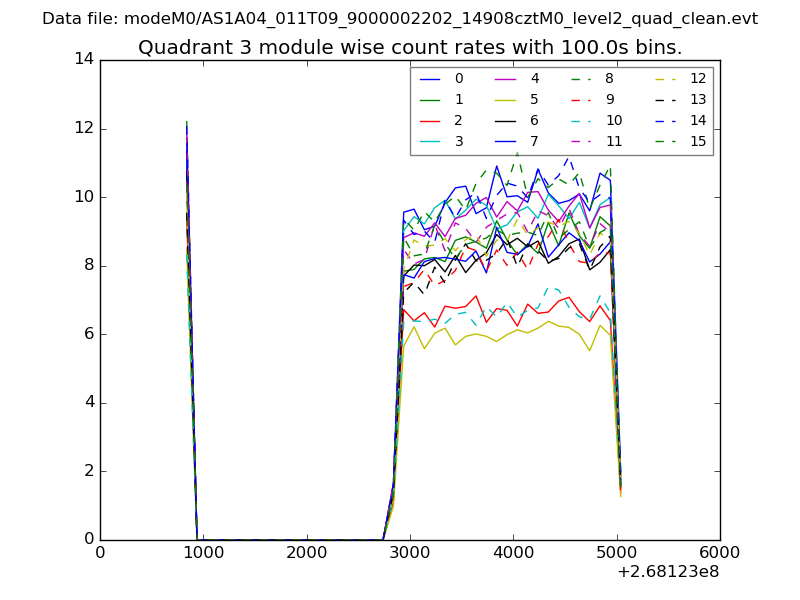
| Module-wise count rates for Quadrant C Data is divided into 100 sec bins |
 |
 |
| Module-wise count rates for Quadrant D Data is divided into 100 sec bins |
 |
 |
| Parameter | Plot |
|---|---|
| CZT HV Monitor | 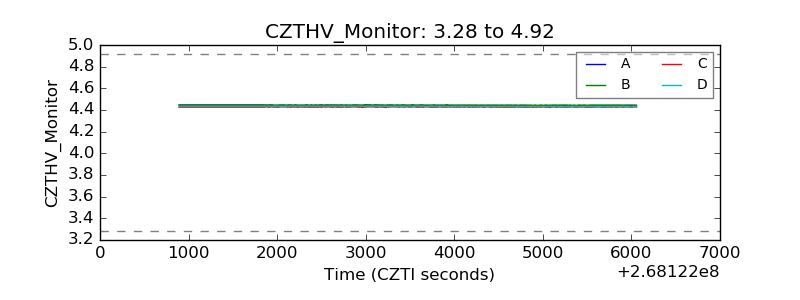 |
| D_VDD | 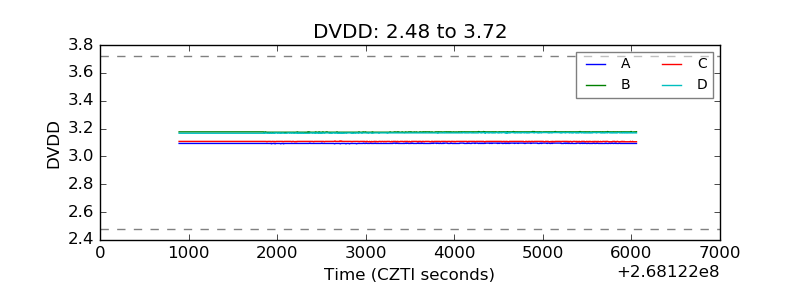 |
| Temperature 1 |  |
| Veto HV Monitor | 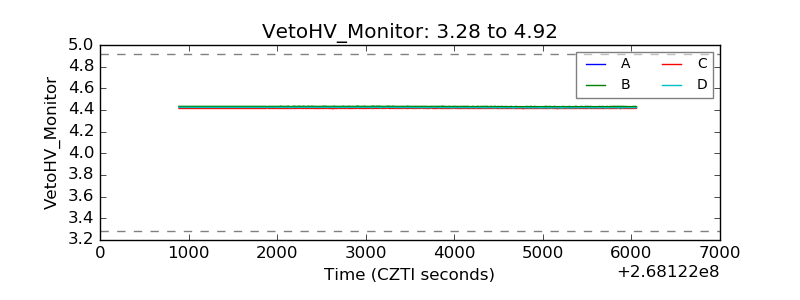 |
| Veto LLD | 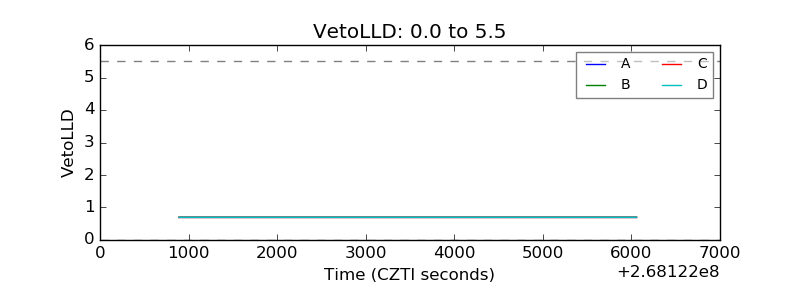 |
| Alpha Counter | 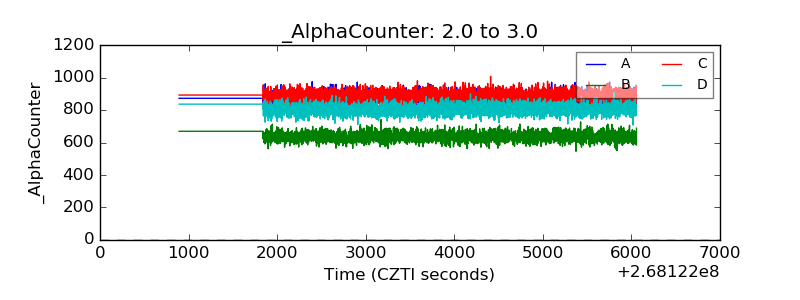 |
| _CPM_Rate | 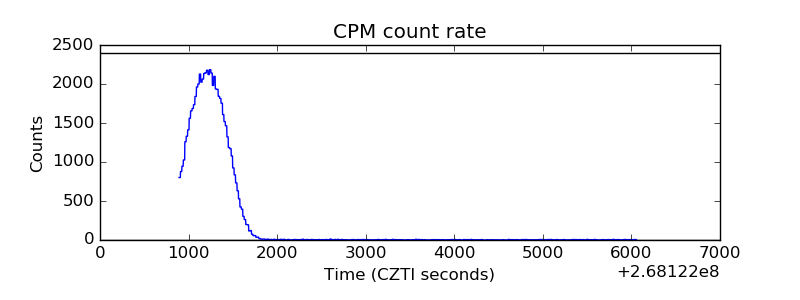 |
| CZT Counter | 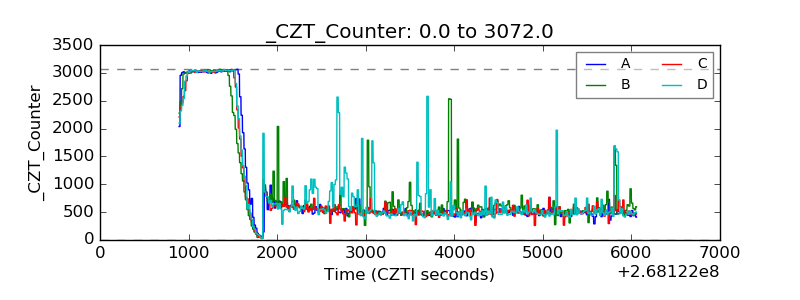 |
| +2.5 Volts monitor |  |
| +5 Volts monitor |  |
| _ROLL_ROT | 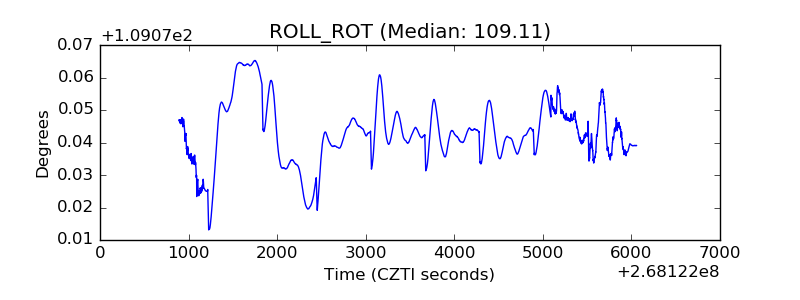 |
| _Roll_DEC | 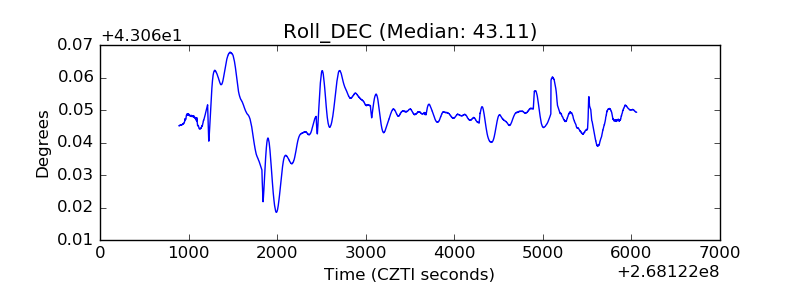 |
| _Roll_RA | 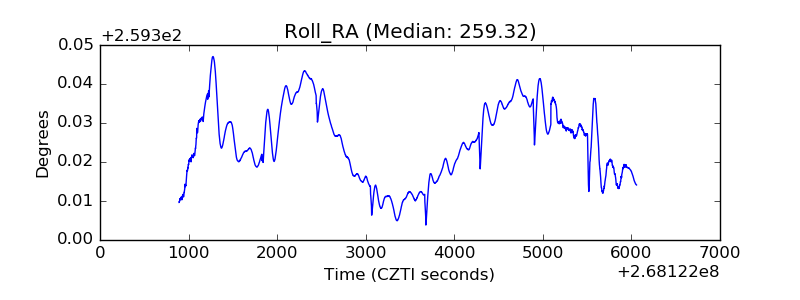 |
| Veto Counter | 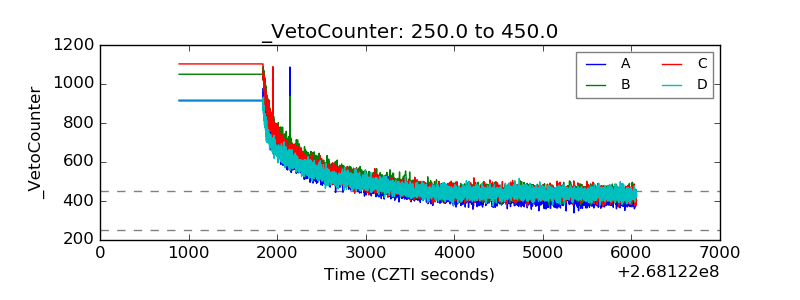 |