| Param | Original file | Final file |
|---|---|---|
| Filename | modeM0/AS1A04_099T01_9000002204_14909cztM0_level2.evt | modeM0/AS1A04_099T01_9000002204_14909cztM0_level2_quad_clean.evt |
| Size (bytes) | 492,471,360 | 65,511,360 |
| Size | 469.7 MB | 62.5 MB |
| Events in quadrant A | 3,322,505 | 399,724 |
| Events in quadrant B | 4,449,384 | 393,442 |
| Events in quadrant C | 3,309,210 | 385,042 |
| Events in quadrant D | 3,416,470 | 376,100 |
| Mode SS | |||
|---|---|---|---|
| Quadrant | BADHDUFLAG | Total packets | Discarded packets |
| A | 0 | 126 | 0 |
| B | 0 | 126 | 0 |
| C | 0 | 126 | 0 |
| D | 0 | 126 | 0 |
| Mode M0 | |||
|---|---|---|---|
| Quadrant | BADHDUFLAG | Total packets | Discarded packets |
| A | 0 | 13376 | 3 |
| B | 0 | 16952 | 2 |
| C | 0 | 13270 | 2 |
| D | 0 | 13844 | 2 |
| Mode M9 | |||
|---|---|---|---|
| Quadrant | BADHDUFLAG | Total packets | Discarded packets |
| A | 0 | 20 | 0 |
| B | 0 | 20 | 0 |
| C | 0 | 20 | 0 |
| D | 0 | 21 | 0 |
| Quadrant | Total seconds | Saturated seconds | Saturation percentage |
|---|---|---|---|
| A | 6142 | 101 | 1.644415% |
| B | 6142 | 394 | 6.414849% |
| C | 6142 | 72 | 1.172257% |
| D | 6142 | 93 | 1.514165% |
Noise dominated data is calculated using 1-second bins in cleaned event files. If a bin has >2000 counts, and if more than 50% of those come from <1% of pixels, then it is considered to be noise-dominated and hence unusable.
| Quadrant | # 1 sec bins | Bins with >0 counts | Bins with >2000 counts | High rate bins dominated by noise | Noise dominated (total time) | Noise dominated (detector-on time) | Marked lightcurve |
|---|---|---|---|---|---|---|---|
| A | 7443 | 6144 | 0 | 0 | 0.00% | 0.00% | 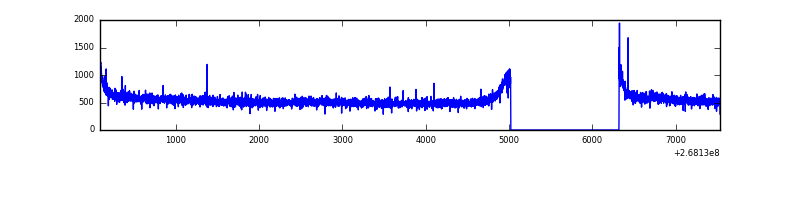 |
| B | 7443 | 6144 | 161 | 161 | 2.16% | 2.62% | 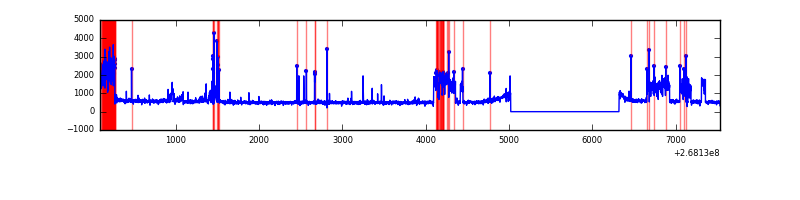 |
| C | 7443 | 6144 | 0 | 0 | 0.00% | 0.00% | 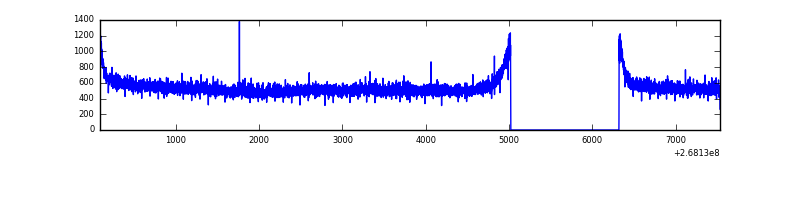 |
| D | 7443 | 6144 | 29 | 29 | 0.39% | 0.47% | 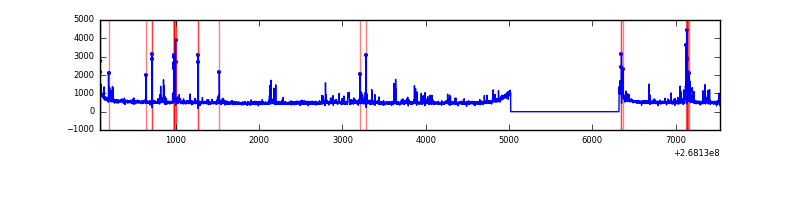 |
Top three noisy pixels from each quadrant. If the there are fewer than three noisy pixels in the level2.evt file, extra rows are filled as -1
| Pixel properties | Quadrant properties | ||||||
|---|---|---|---|---|---|---|---|
| Quadrant | DetID | PixID | Counts | Sigma | Mean | Median | Sigma |
| A | 11 | 29 | 14646 | 80.76 | 854 | 839 | 171.0 |
| A | 3 | 1 | 13888 | 76.33 | 854 | 839 | 171.0 |
| A | 0 | 226 | 7734 | 40.33 | 854 | 839 | 171.0 |
| B | 10 | 16 | 775299 | 4991.47 | 828 | 810 | 155.2 |
| B | 3 | 64 | 407390 | 2620.35 | 828 | 810 | 155.2 |
| B | 0 | 229 | 25403 | 158.5 | 828 | 810 | 155.2 |
| C | 3 | 233 | 140328 | 749.74 | 811 | 817 | 186.1 |
| C | 13 | 61 | 5717 | 26.33 | 811 | 817 | 186.1 |
| C | 0 | 207 | 3397 | 13.86 | 811 | 817 | 186.1 |
| D | 7 | 223 | 160840 | 830.94 | 812 | 797 | 192.6 |
| D | 7 | 254 | 102430 | 527.67 | 812 | 797 | 192.6 |
| D | 10 | 70 | 34976 | 177.46 | 812 | 797 | 192.6 |
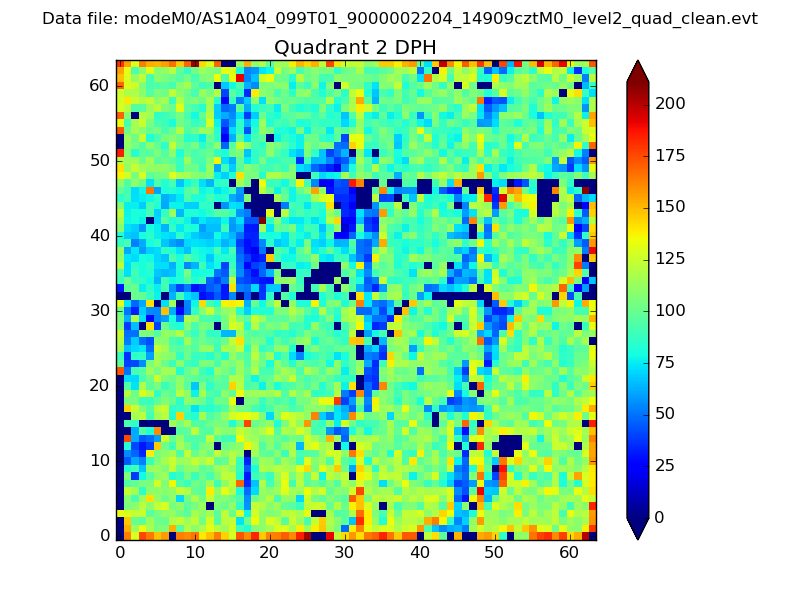
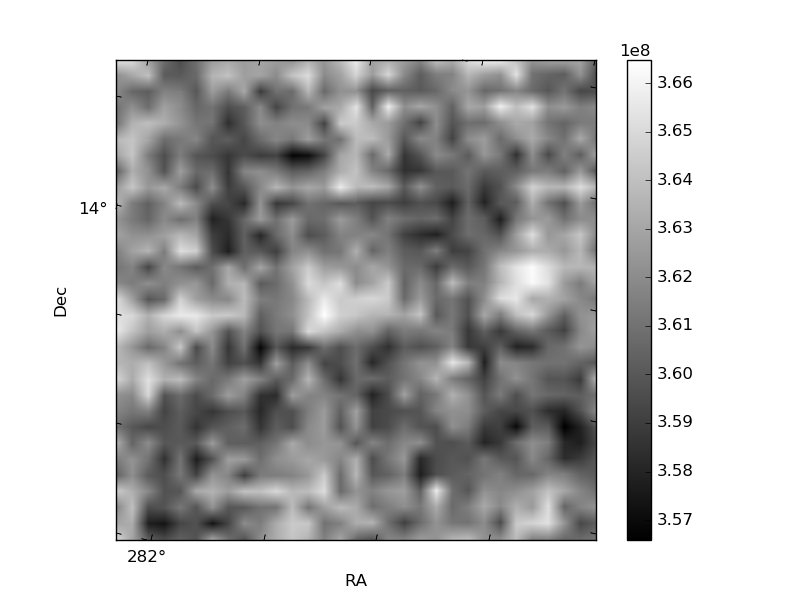
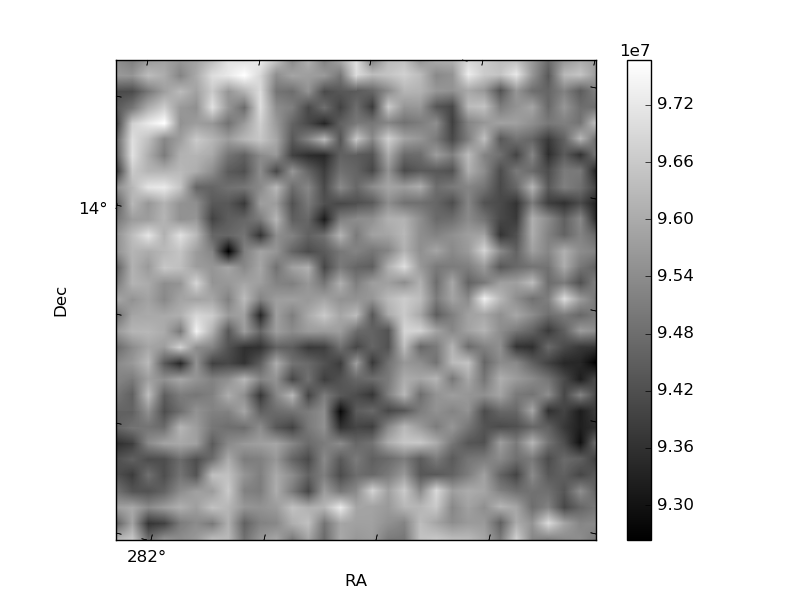
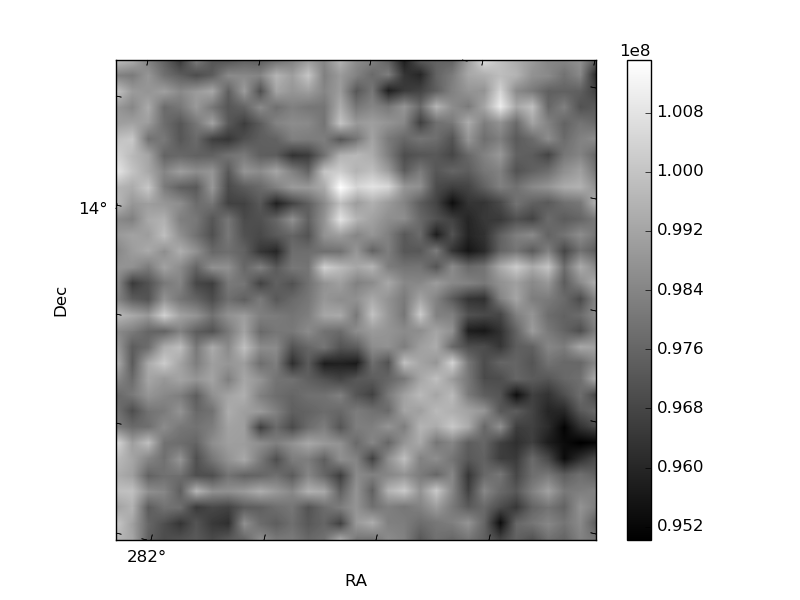
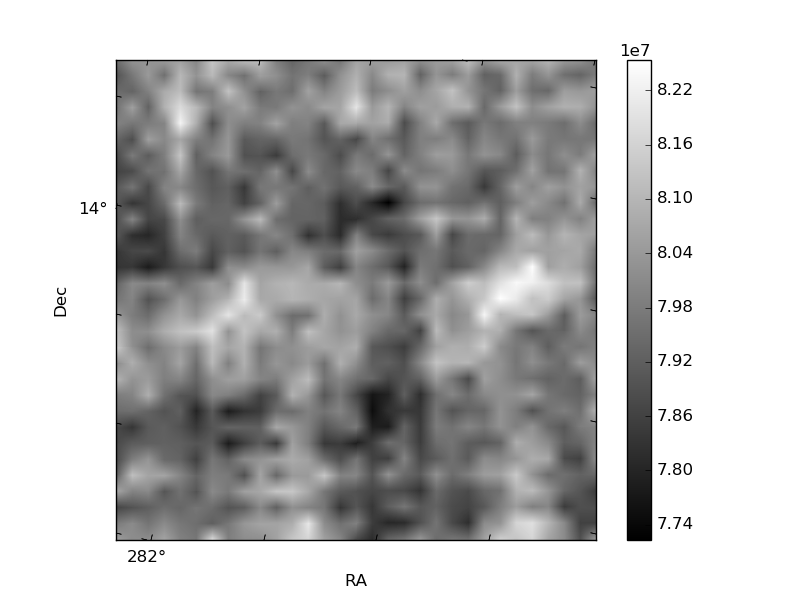
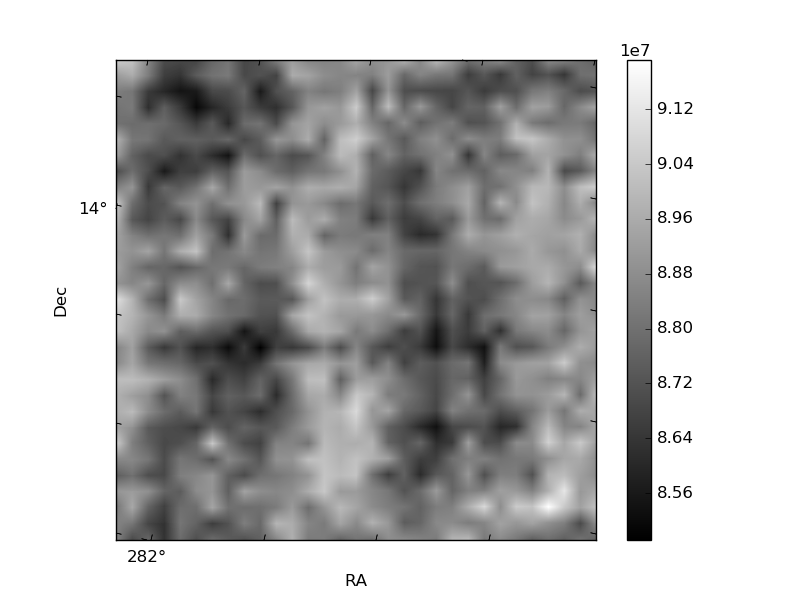
Histogram calculated using DETX and DETY for each event in the final _common_clean file
| Quadrant A | 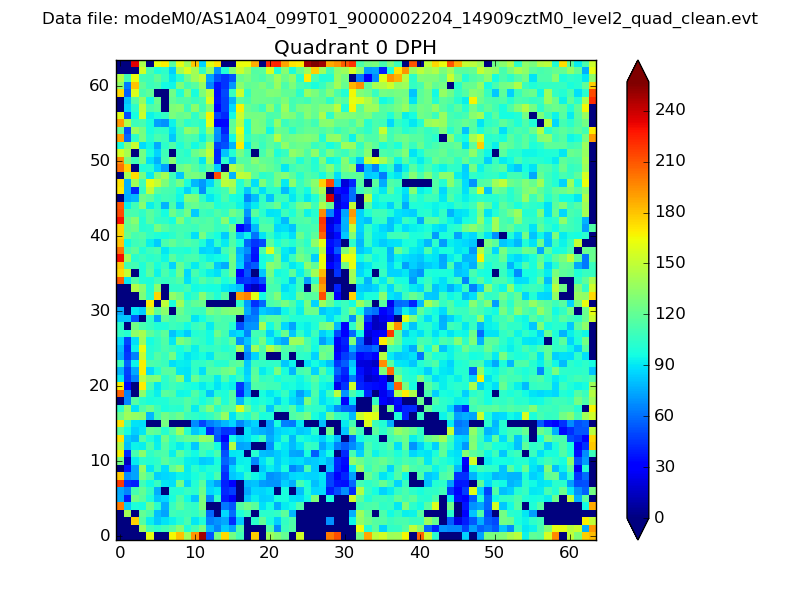 |
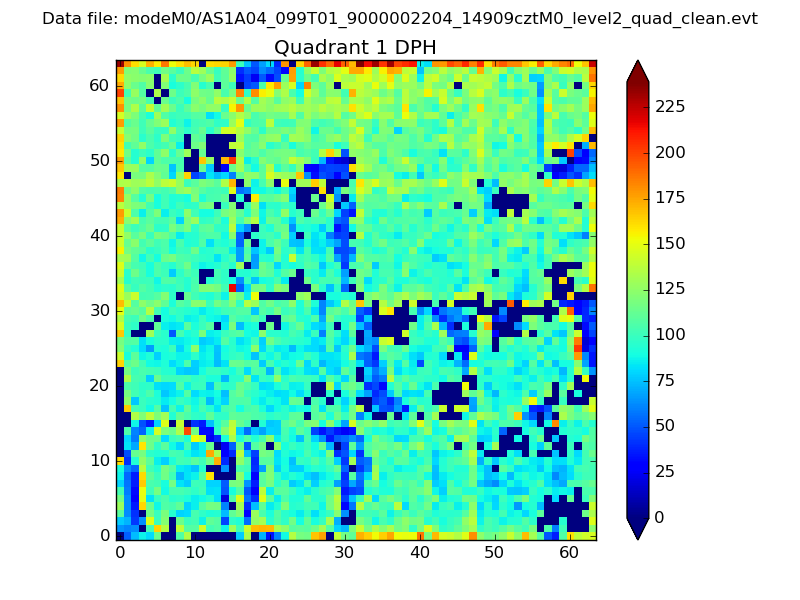 |
Quadrant B |
|---|---|---|---|
| Quadrant D | 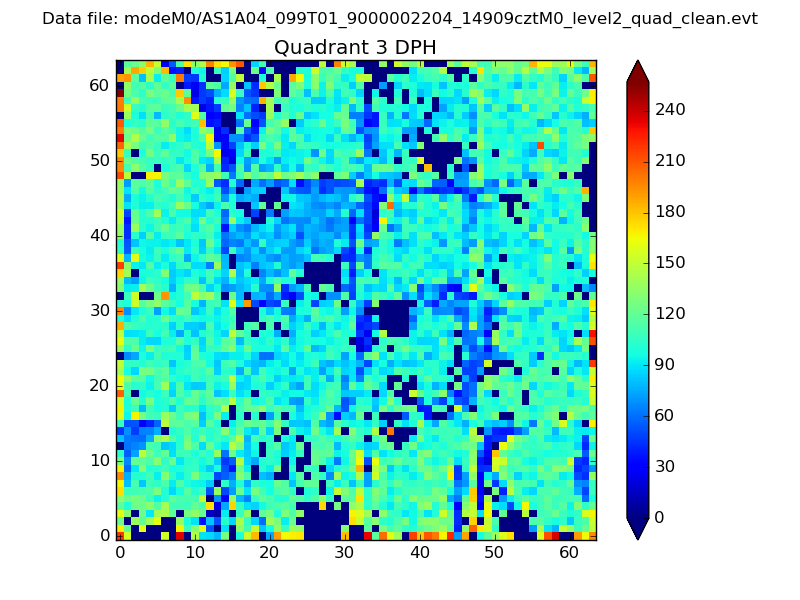 |
 |
Quadrant C |
| Plot type | Count rate plots | Images |
|---|---|---|
| Comparison with Poisson distribution Blue bars denote a histogram of data divided into 1 sec bins. Red curve is a Poisson curve with rate = median count rate of data. |
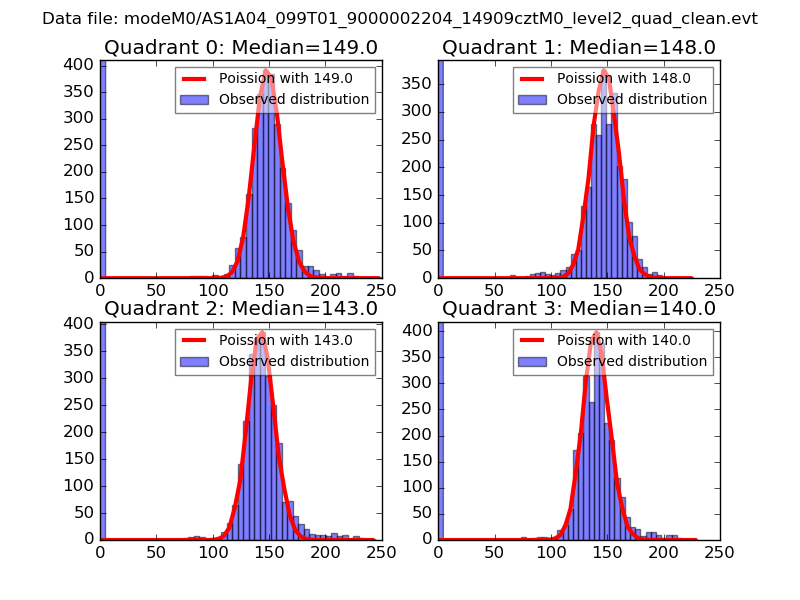 |
 |
| Quadrant-wise count rates Data is divided into 100 sec bins |
 |
|
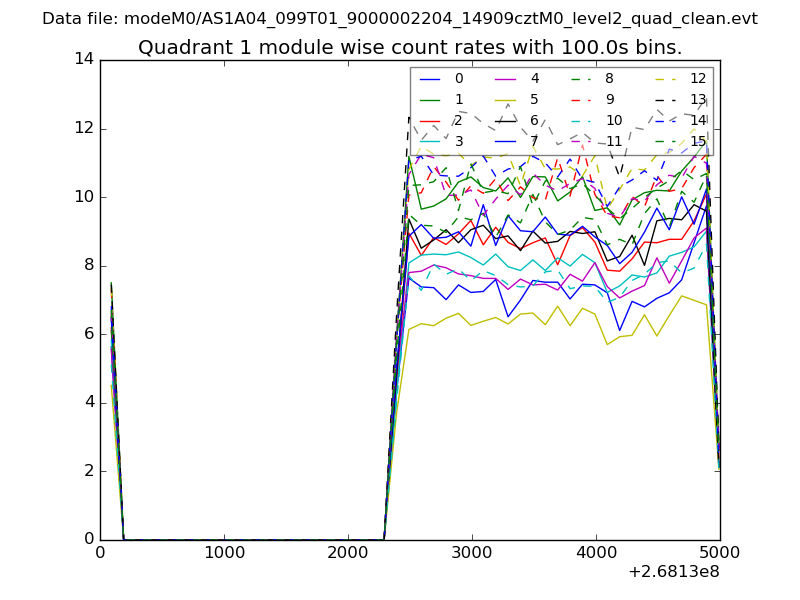
| Module-wise count rates for Quadrant A Data is divided into 100 sec bins |
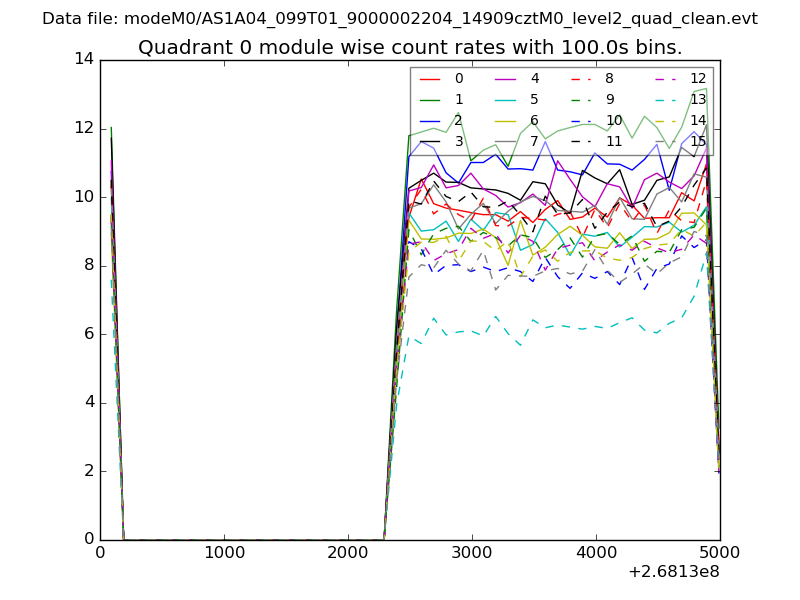 |
 |
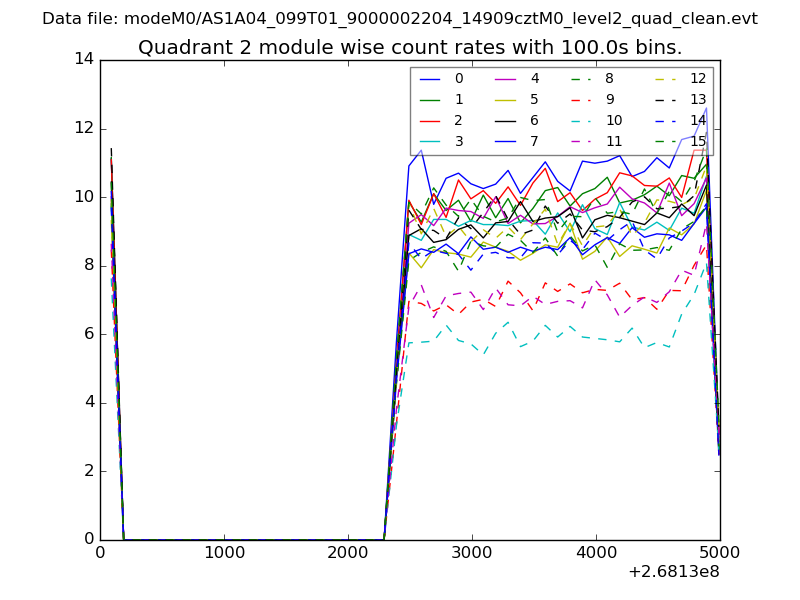
| Module-wise count rates for Quadrant B Data is divided into 100 sec bins |
 |
 |
| Module-wise count rates for Quadrant C Data is divided into 100 sec bins |
 |
 |
| Module-wise count rates for Quadrant D Data is divided into 100 sec bins |
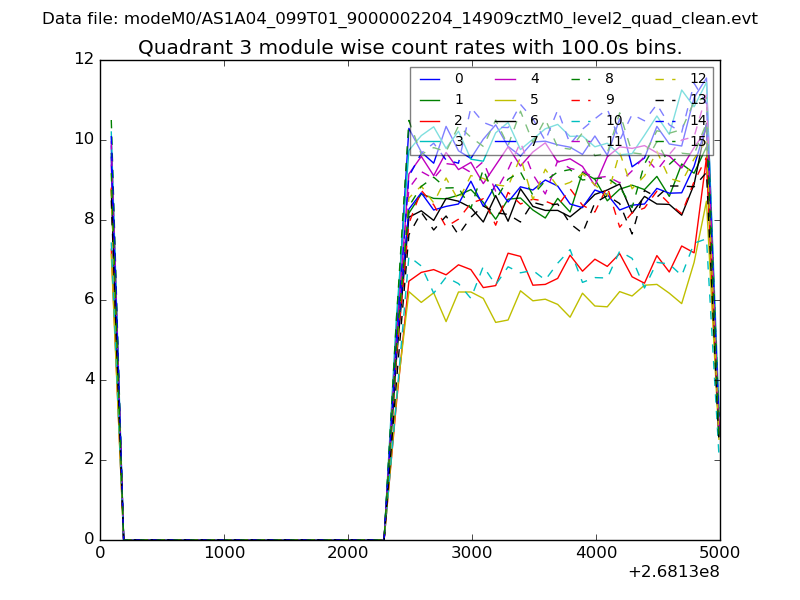 |
 |
| Parameter | Plot |
|---|---|
| CZT HV Monitor | 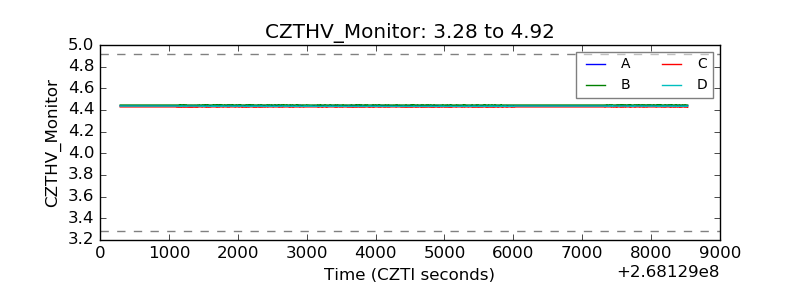 |
| D_VDD | 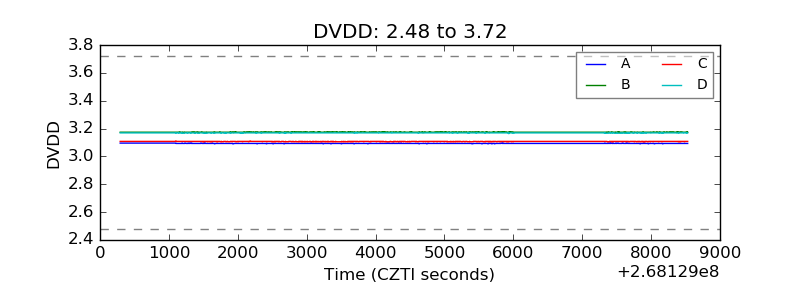 |
| Temperature 1 | 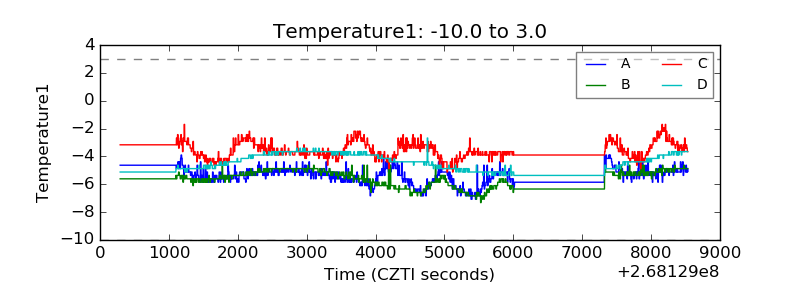 |
| Veto HV Monitor | 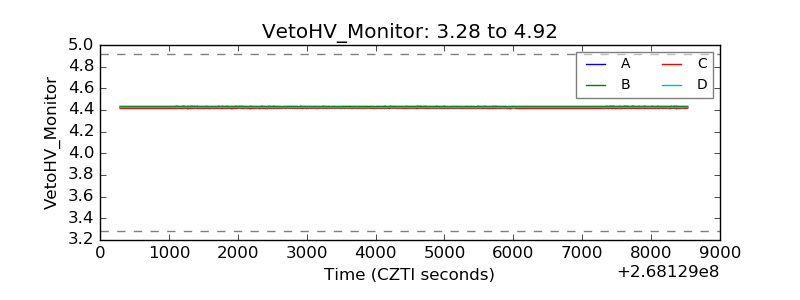 |
| Veto LLD | 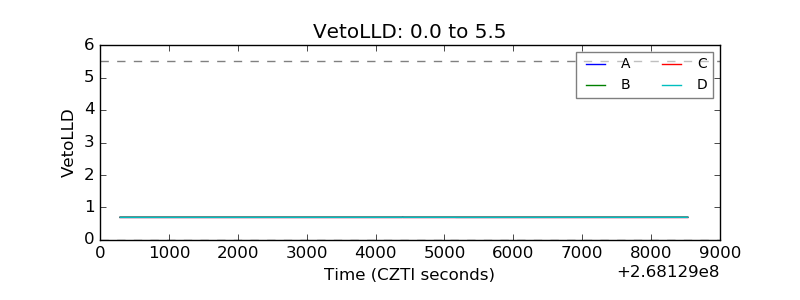 |
| Alpha Counter | 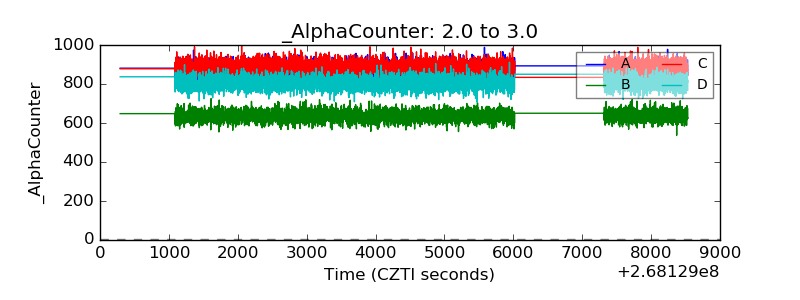 |
| _CPM_Rate |  |
| CZT Counter | 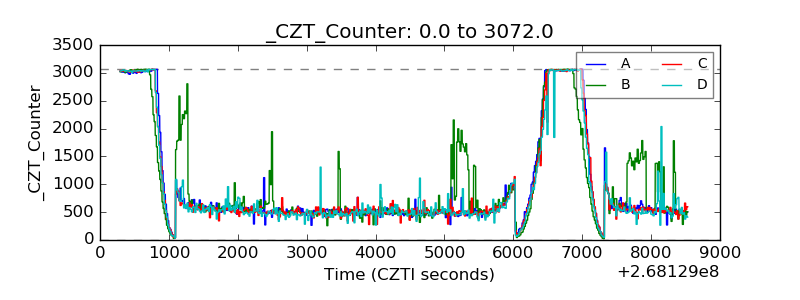 |
| +2.5 Volts monitor |  |
| +5 Volts monitor |  |
| _ROLL_ROT | 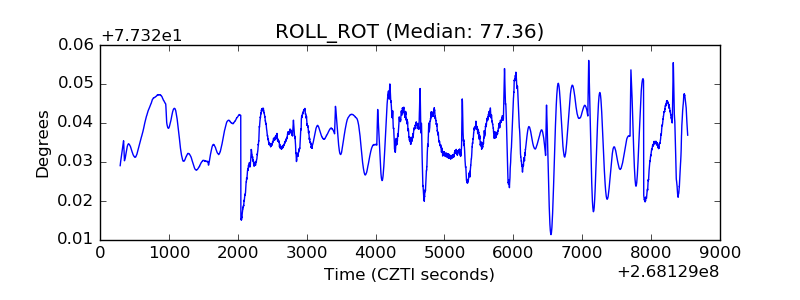 |
| _Roll_DEC | 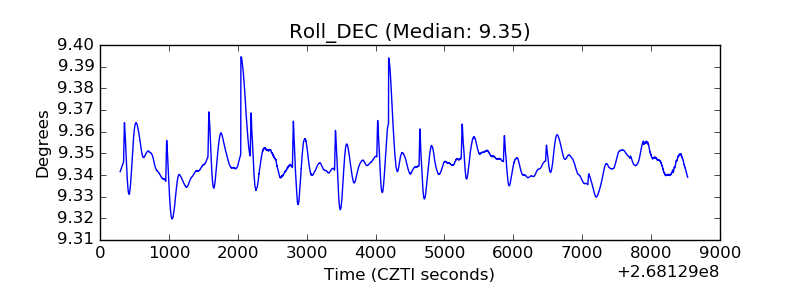 |
| _Roll_RA | 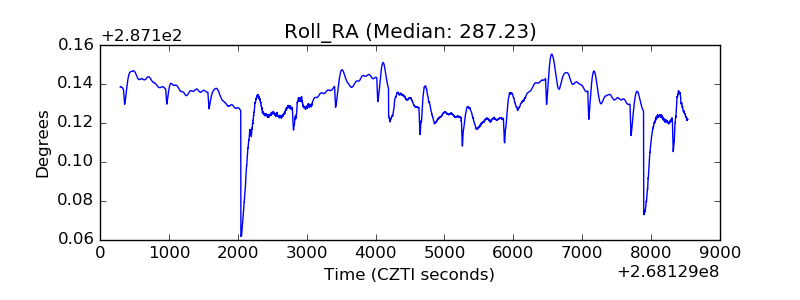 |
| Veto Counter | 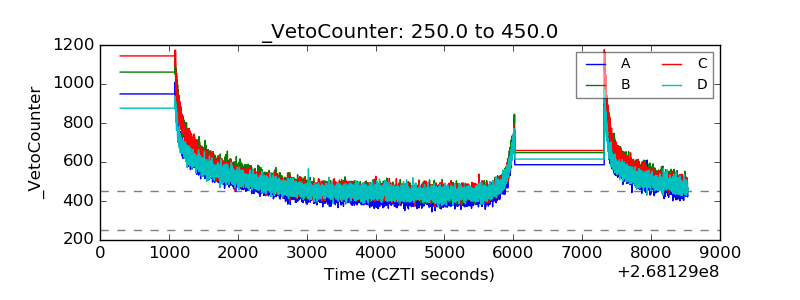 |