| Param | Original file | Final file |
|---|---|---|
| Filename | modeM0/AS1A04_099T01_9000002204_14910cztM0_level2.evt | modeM0/AS1A04_099T01_9000002204_14910cztM0_level2_quad_clean.evt |
| Size (bytes) | 508,060,800 | 75,888,000 |
| Size | 484.5 MB | 72.4 MB |
| Events in quadrant A | 3,498,723 | 470,056 |
| Events in quadrant B | 4,316,735 | 468,431 |
| Events in quadrant C | 3,541,474 | 453,409 |
| Events in quadrant D | 3,581,512 | 445,372 |
| Mode SS | |||
|---|---|---|---|
| Quadrant | BADHDUFLAG | Total packets | Discarded packets |
| A | 0 | 136 | 0 |
| B | 0 | 136 | 0 |
| C | 0 | 136 | 0 |
| D | 0 | 136 | 0 |
| Mode M0 | |||
|---|---|---|---|
| Quadrant | BADHDUFLAG | Total packets | Discarded packets |
| A | 0 | 14287 | 3 |
| B | 0 | 16750 | 2 |
| C | 0 | 14271 | 2 |
| D | 0 | 14789 | 2 |
| Mode M9 | |||
|---|---|---|---|
| Quadrant | BADHDUFLAG | Total packets | Discarded packets |
| A | 0 | 24 | 0 |
| B | 0 | 24 | 0 |
| C | 0 | 24 | 0 |
| D | 0 | 24 | 0 |
| Quadrant | Total seconds | Saturated seconds | Saturation percentage |
|---|---|---|---|
| A | 6602 | 247 | 3.741291% |
| B | 6602 | 418 | 6.331415% |
| C | 6602 | 189 | 2.862769% |
| D | 6602 | 198 | 2.999091% |
Noise dominated data is calculated using 1-second bins in cleaned event files. If a bin has >2000 counts, and if more than 50% of those come from <1% of pixels, then it is considered to be noise-dominated and hence unusable.
| Quadrant | # 1 sec bins | Bins with >0 counts | Bins with >2000 counts | High rate bins dominated by noise | Noise dominated (total time) | Noise dominated (detector-on time) | Marked lightcurve |
|---|---|---|---|---|---|---|---|
| A | 9008 | 6604 | 0 | 0 | 0.00% | 0.00% | 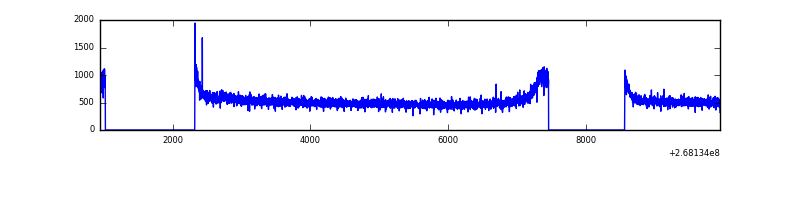 |
| B | 9008 | 6604 | 69 | 69 | 0.77% | 1.04% | 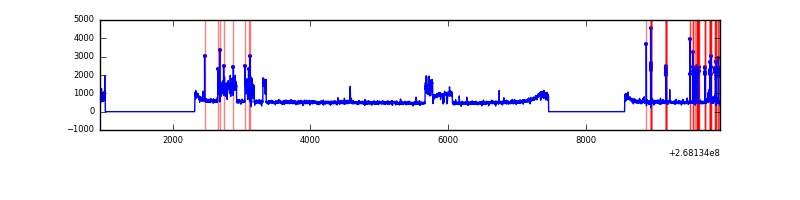 |
| C | 9008 | 6605 | 0 | 0 | 0.00% | 0.00% | 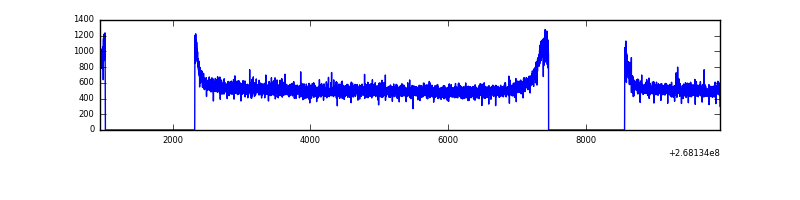 |
| D | 9008 | 6604 | 20 | 20 | 0.22% | 0.30% | 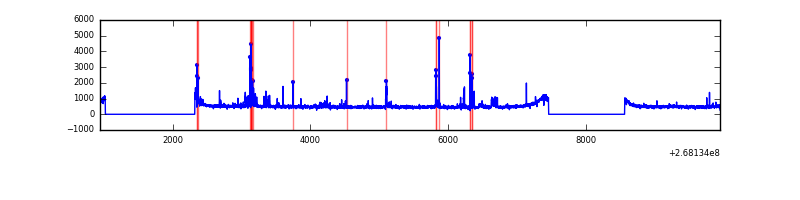 |
Top three noisy pixels from each quadrant. If the there are fewer than three noisy pixels in the level2.evt file, extra rows are filled as -1
| Pixel properties | Quadrant properties | ||||||
|---|---|---|---|---|---|---|---|
| Quadrant | DetID | PixID | Counts | Sigma | Mean | Median | Sigma |
| A | 11 | 29 | 14806 | 76.34 | 904 | 887 | 182.3 |
| A | 3 | 1 | 9334 | 46.33 | 904 | 887 | 182.3 |
| A | 0 | 226 | 7971 | 38.85 | 904 | 887 | 182.3 |
| B | 10 | 16 | 803846 | 4739.51 | 886 | 866 | 169.4 |
| B | 0 | 229 | 33133 | 190.45 | 886 | 866 | 169.4 |
| B | 12 | 111 | 20715 | 117.16 | 886 | 866 | 169.4 |
| C | 3 | 233 | 145470 | 724.42 | 869 | 878 | 199.6 |
| C | 13 | 61 | 6117 | 26.25 | 869 | 878 | 199.6 |
| C | 0 | 207 | 4724 | 19.27 | 869 | 878 | 199.6 |
| D | 7 | 223 | 110261 | 527.86 | 870 | 848 | 207.3 |
| D | 7 | 254 | 71735 | 341.99 | 870 | 848 | 207.3 |
| D | 13 | 249 | 67172 | 319.98 | 870 | 848 | 207.3 |
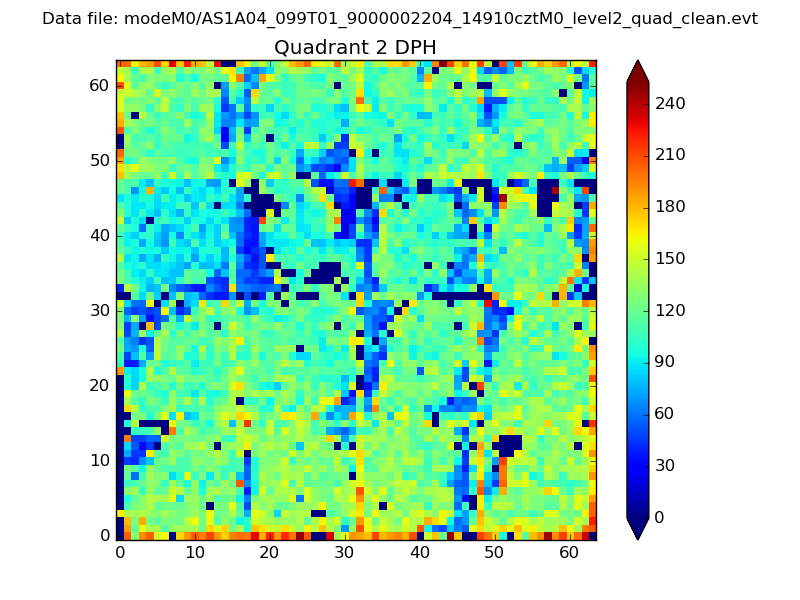
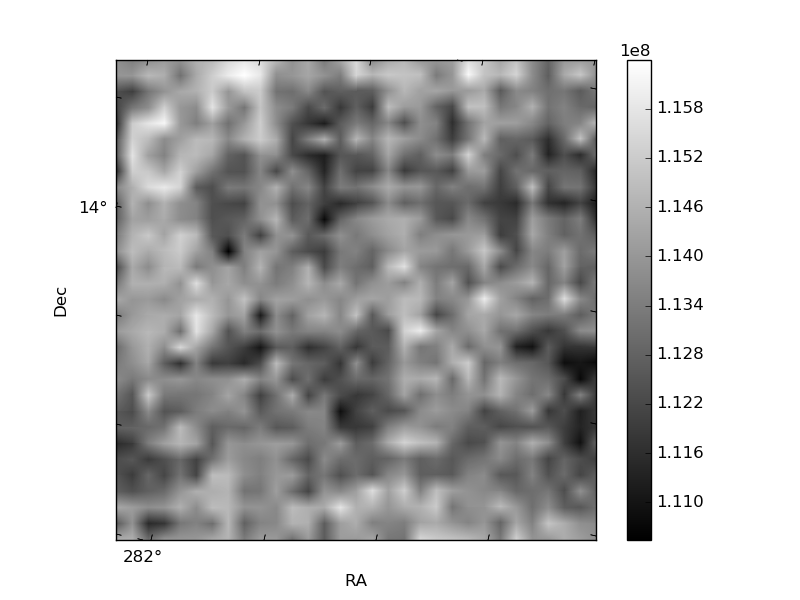
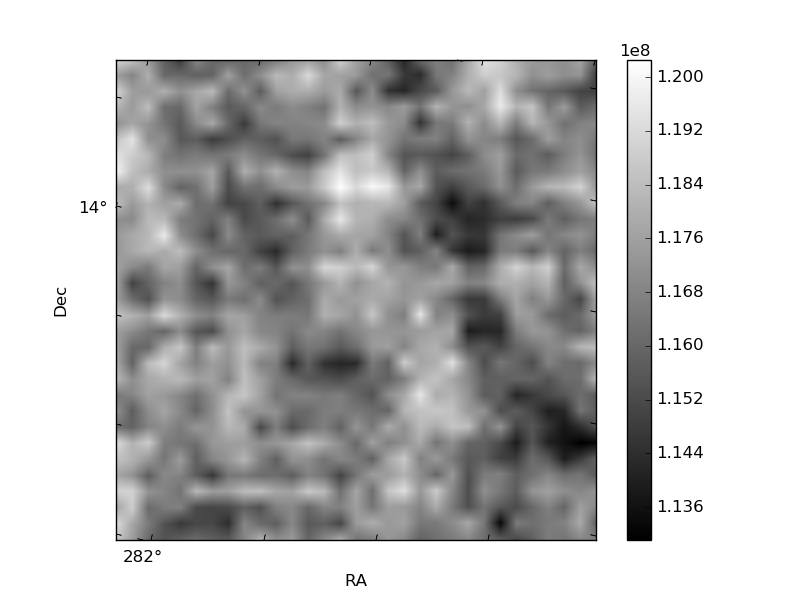
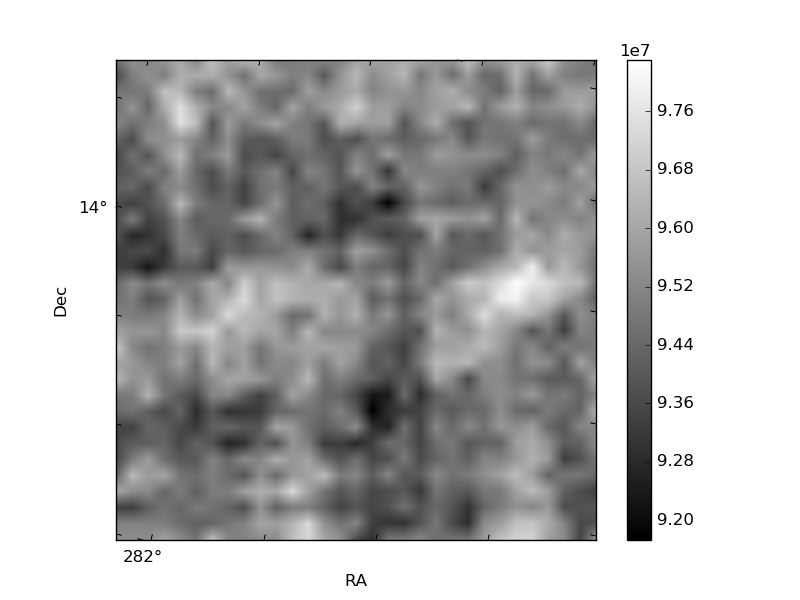
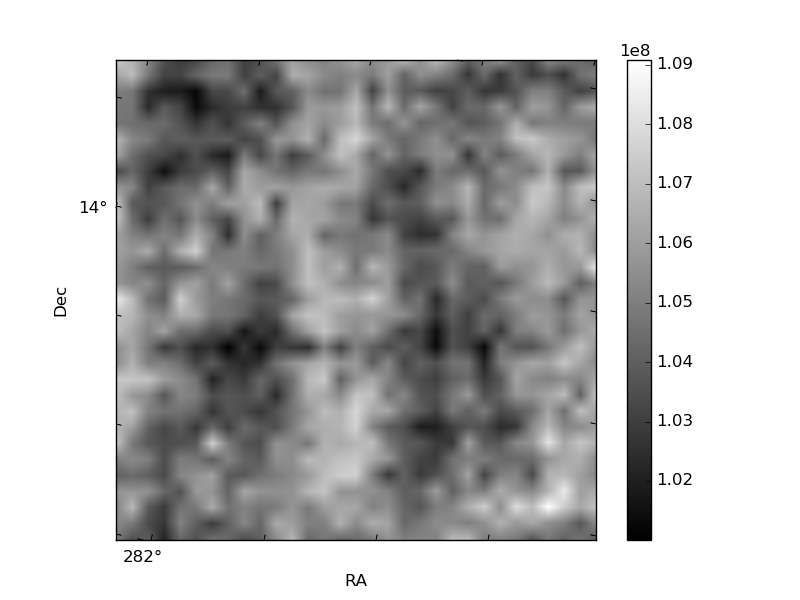
Histogram calculated using DETX and DETY for each event in the final _common_clean file
| Quadrant A | 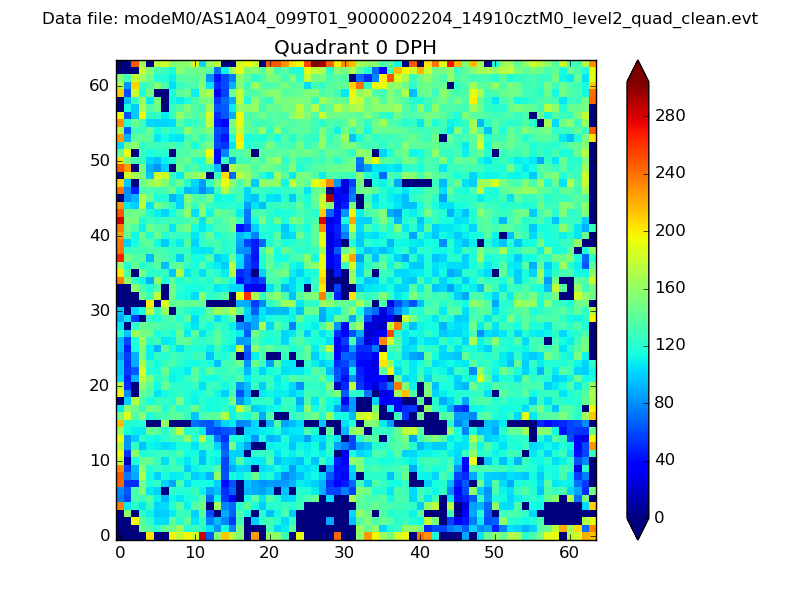 |
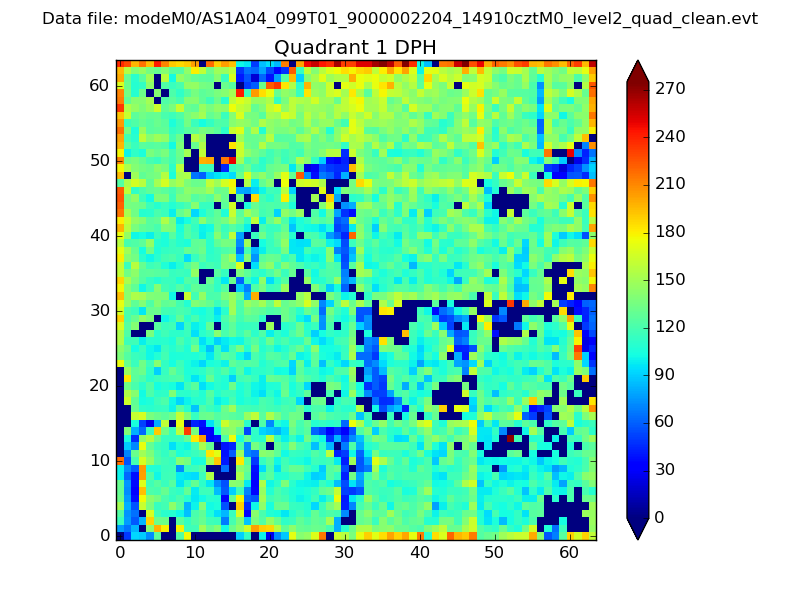 |
Quadrant B |
|---|---|---|---|
| Quadrant D | 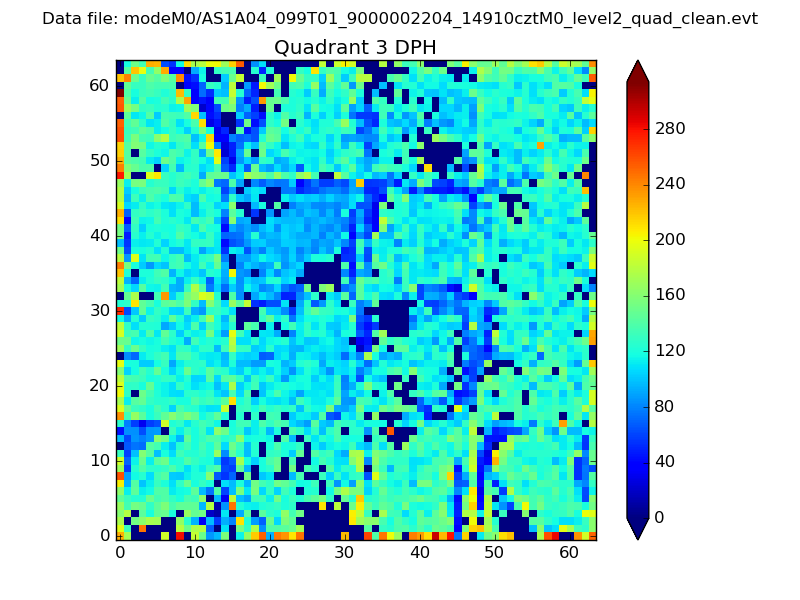 |
 |
Quadrant C |
| Plot type | Count rate plots | Images |
|---|---|---|
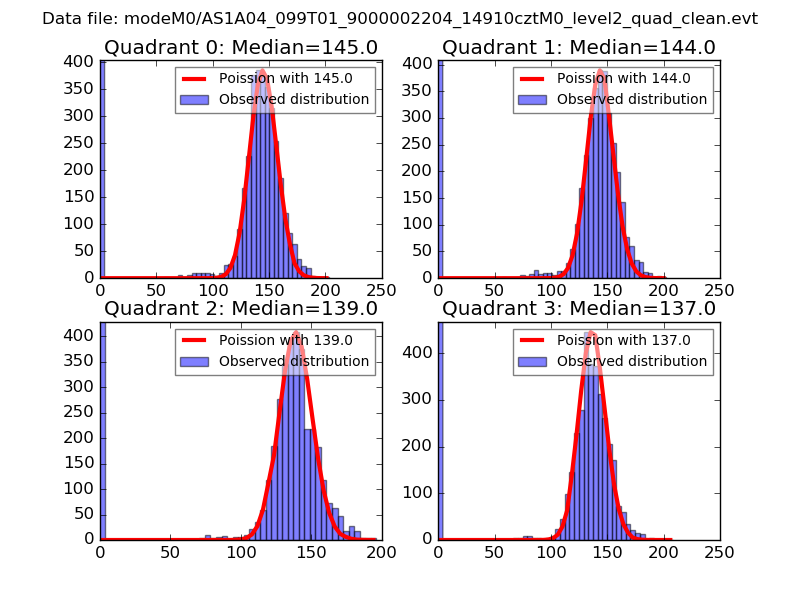
| Comparison with Poisson distribution Blue bars denote a histogram of data divided into 1 sec bins. Red curve is a Poisson curve with rate = median count rate of data. |
 |
 |
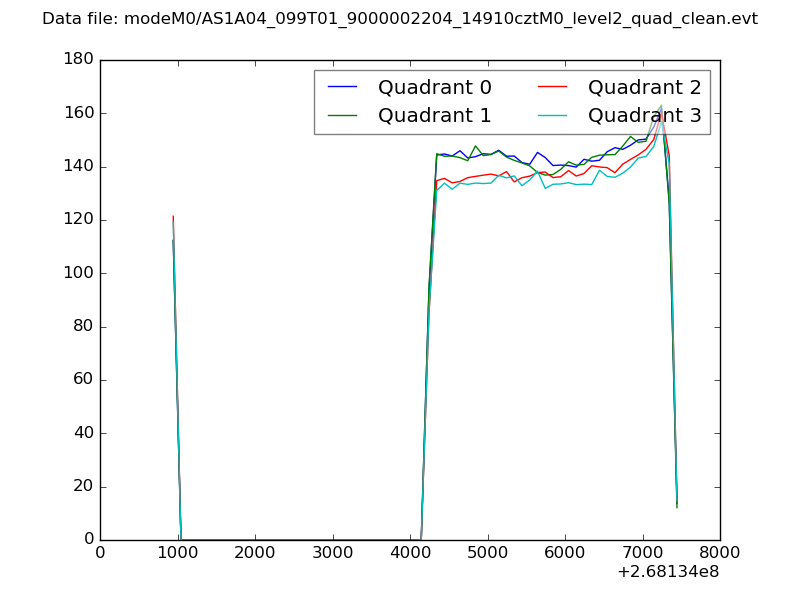
| Quadrant-wise count rates Data is divided into 100 sec bins |
 |
|
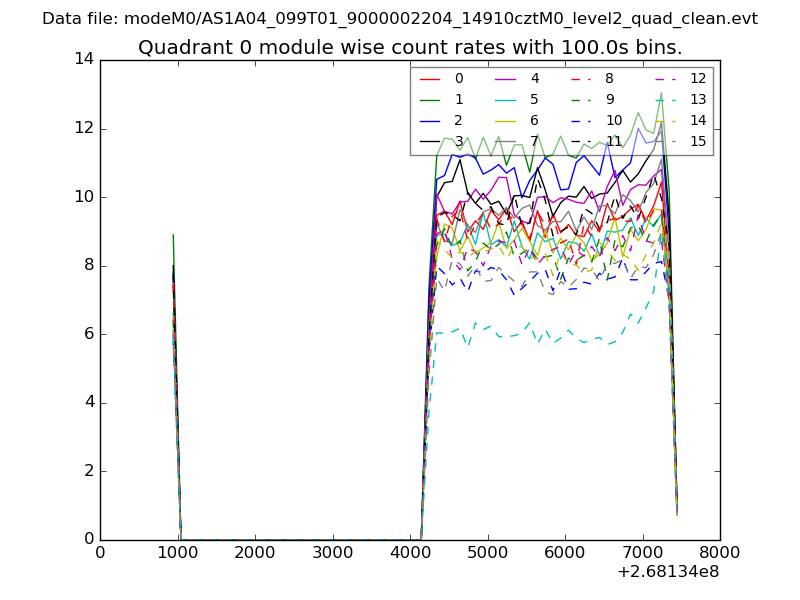
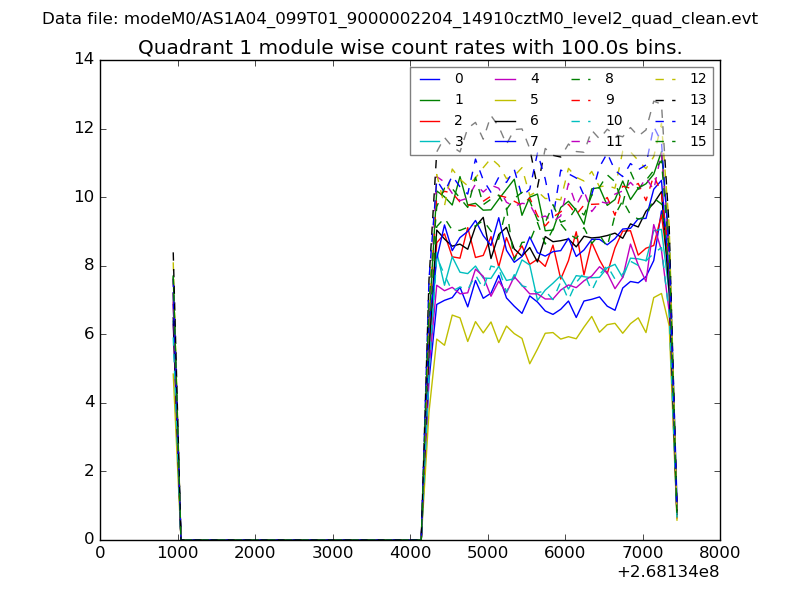
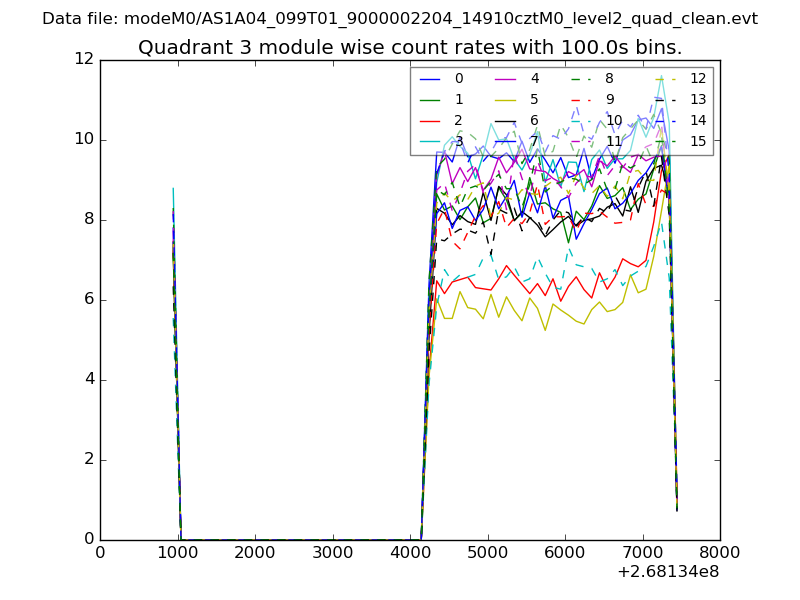
| Module-wise count rates for Quadrant A Data is divided into 100 sec bins |
 |
 |
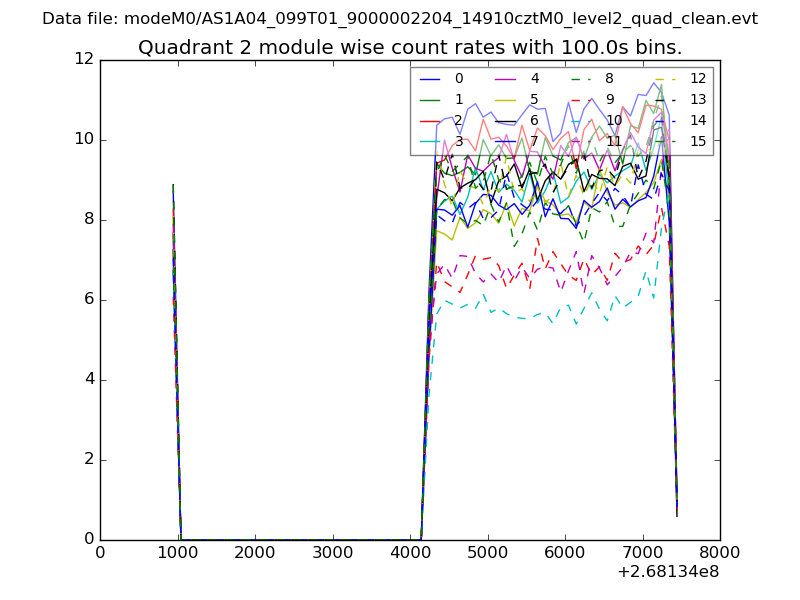
| Module-wise count rates for Quadrant B Data is divided into 100 sec bins |
 |
 |
| Module-wise count rates for Quadrant C Data is divided into 100 sec bins |
 |
 |
| Module-wise count rates for Quadrant D Data is divided into 100 sec bins |
 |
 |
| Parameter | Plot |
|---|---|
| CZT HV Monitor | 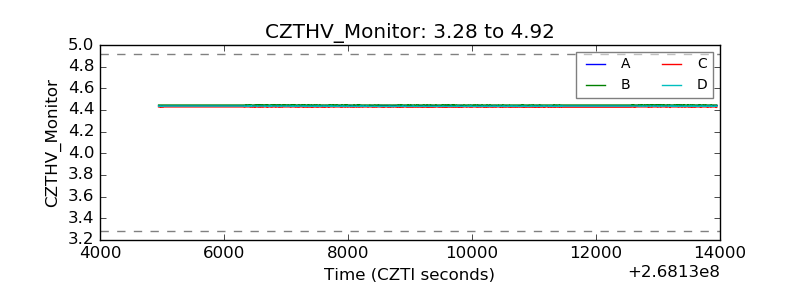 |
| D_VDD | 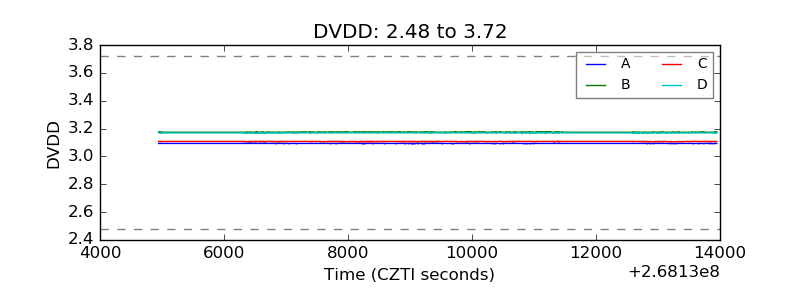 |
| Temperature 1 | 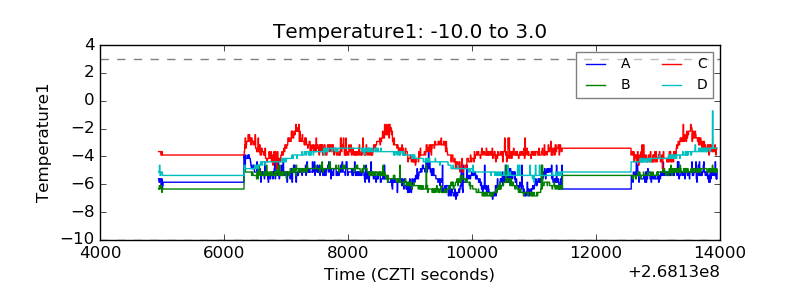 |
| Veto HV Monitor | 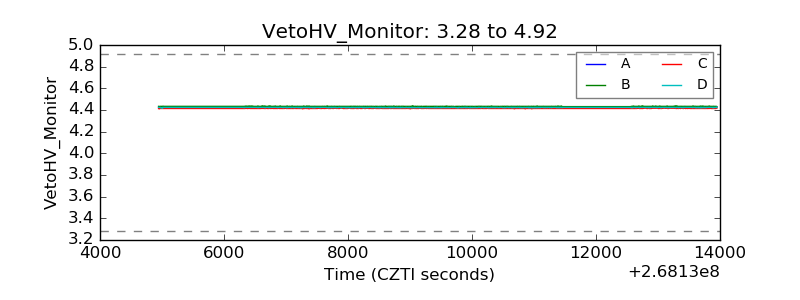 |
| Veto LLD | 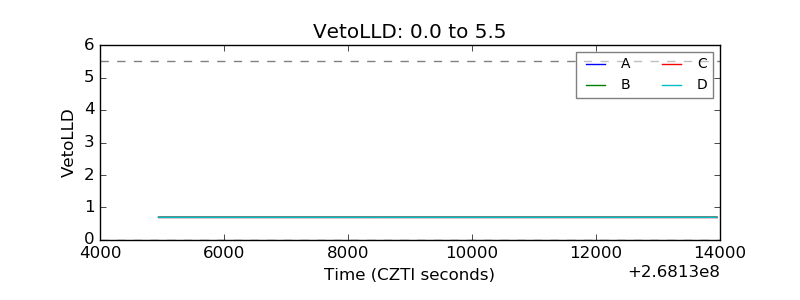 |
| Alpha Counter | 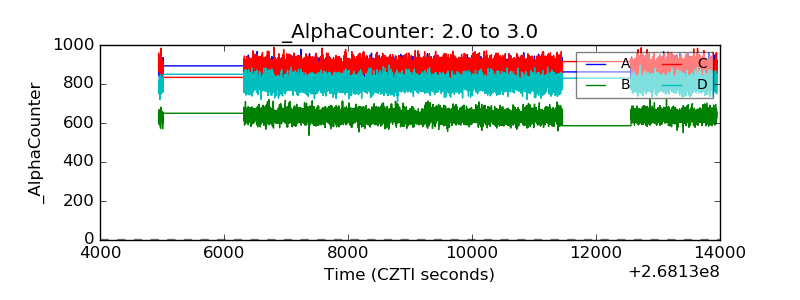 |
| _CPM_Rate | 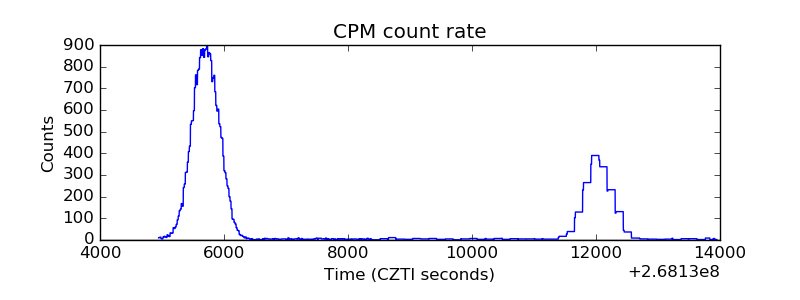 |
| CZT Counter | 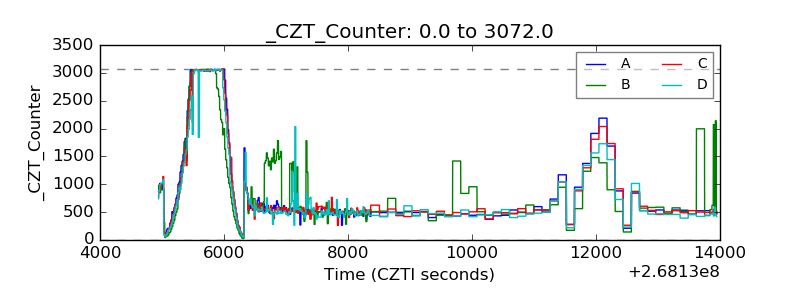 |
| +2.5 Volts monitor | 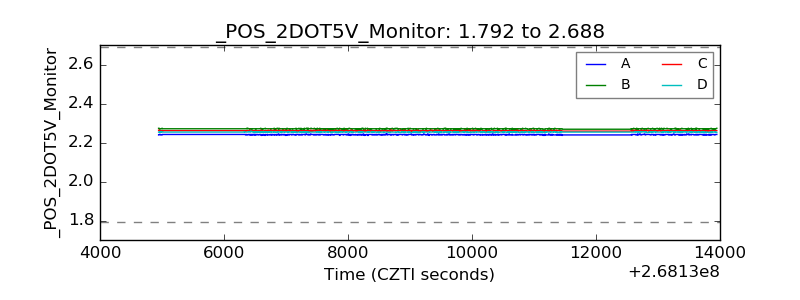 |
| +5 Volts monitor | 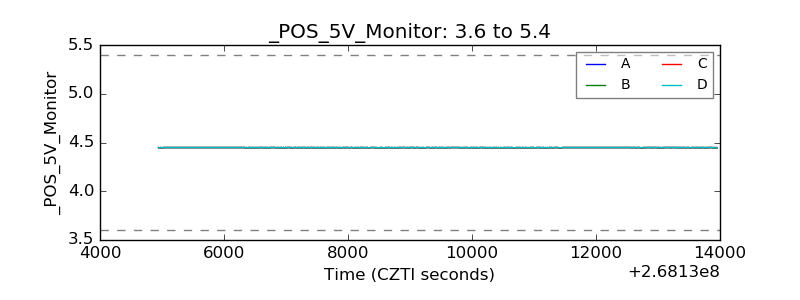 |
| _ROLL_ROT | 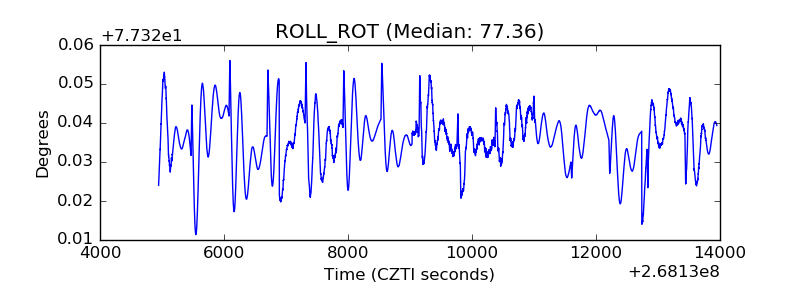 |
| _Roll_DEC | 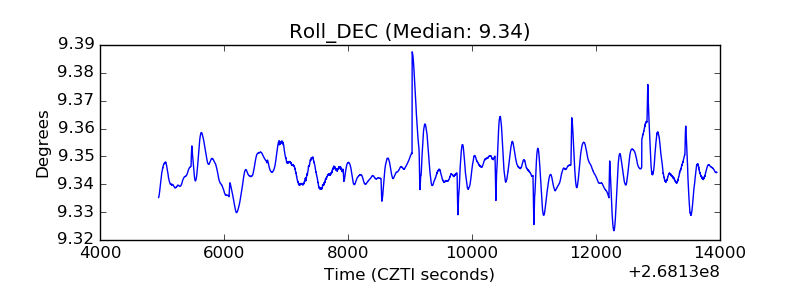 |
| _Roll_RA | 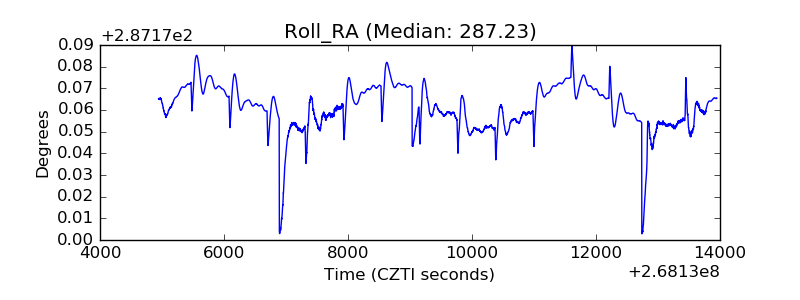 |
| Veto Counter | 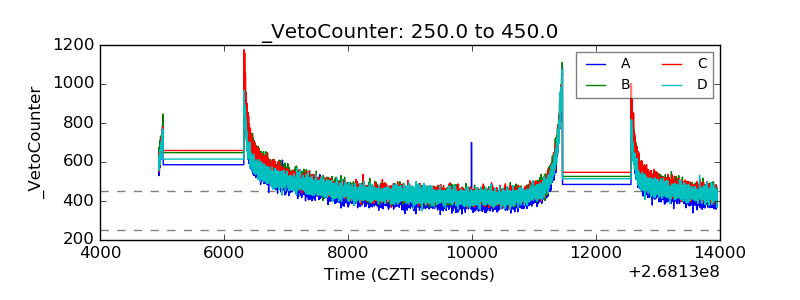 |