| Param | Original file | Final file |
|---|---|---|
| Filename | modeM0/AS1A04_099T01_9000002204_14911cztM0_level2.evt | modeM0/AS1A04_099T01_9000002204_14911cztM0_level2_quad_clean.evt |
| Size (bytes) | 526,501,440 | 89,948,160 |
| Size | 502.1 MB | 85.8 MB |
| Events in quadrant A | 3,638,387 | 571,212 |
| Events in quadrant B | 3,977,914 | 572,108 |
| Events in quadrant C | 3,704,115 | 552,313 |
| Events in quadrant D | 4,140,646 | 531,607 |
| Mode SS | |||
|---|---|---|---|
| Quadrant | BADHDUFLAG | Total packets | Discarded packets |
| A | 0 | 146 | 0 |
| B | 0 | 146 | 0 |
| C | 0 | 146 | 0 |
| D | 0 | 146 | 0 |
| Mode M0 | |||
|---|---|---|---|
| Quadrant | BADHDUFLAG | Total packets | Discarded packets |
| A | 0 | 15166 | 3 |
| B | 0 | 16109 | 2 |
| C | 0 | 15268 | 2 |
| D | 0 | 16975 | 2 |
| Mode M9 | |||
|---|---|---|---|
| Quadrant | BADHDUFLAG | Total packets | Discarded packets |
| A | 0 | 20 | 0 |
| B | 0 | 20 | 0 |
| C | 0 | 20 | 0 |
| D | 0 | 20 | 0 |
| Quadrant | Total seconds | Saturated seconds | Saturation percentage |
|---|---|---|---|
| A | 7131 | 240 | 3.365587% |
| B | 7131 | 416 | 5.833684% |
| C | 7131 | 187 | 2.622353% |
| D | 7131 | 369 | 5.174590% |
Noise dominated data is calculated using 1-second bins in cleaned event files. If a bin has >2000 counts, and if more than 50% of those come from <1% of pixels, then it is considered to be noise-dominated and hence unusable.
| Quadrant | # 1 sec bins | Bins with >0 counts | Bins with >2000 counts | High rate bins dominated by noise | Noise dominated (total time) | Noise dominated (detector-on time) | Marked lightcurve |
|---|---|---|---|---|---|---|---|
| A | 9097 | 7133 | 0 | 0 | 0.00% | 0.00% |  |
| B | 9097 | 7133 | 109 | 109 | 1.20% | 1.53% | 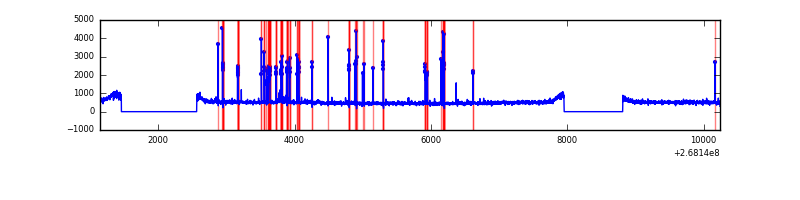 |
| C | 9097 | 7134 | 0 | 0 | 0.00% | 0.00% | 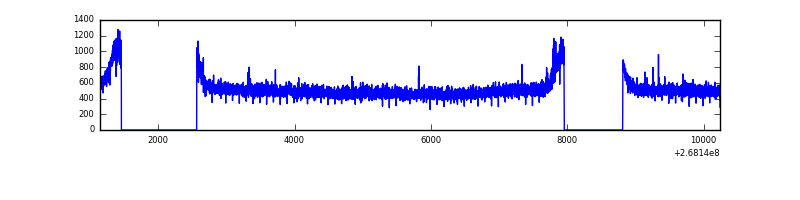 |
| D | 9097 | 7133 | 155 | 155 | 1.70% | 2.17% |  |
Top three noisy pixels from each quadrant. If the there are fewer than three noisy pixels in the level2.evt file, extra rows are filled as -1
| Pixel properties | Quadrant properties | ||||||
|---|---|---|---|---|---|---|---|
| Quadrant | DetID | PixID | Counts | Sigma | Mean | Median | Sigma |
| A | 3 | 1 | 10114 | 48.77 | 940 | 920 | 188.5 |
| A | 4 | 2 | 9988 | 48.1 | 940 | 920 | 188.5 |
| A | 0 | 226 | 8164 | 38.43 | 940 | 920 | 188.5 |
| B | 10 | 16 | 322246 | 1793.16 | 925 | 904 | 179.2 |
| B | 0 | 229 | 36839 | 200.53 | 925 | 904 | 179.2 |
| B | 12 | 111 | 22110 | 118.33 | 925 | 904 | 179.2 |
| C | 3 | 233 | 147844 | 698.35 | 906 | 912 | 210.4 |
| C | 0 | 207 | 21613 | 98.39 | 906 | 912 | 210.4 |
| C | 13 | 61 | 6423 | 26.19 | 906 | 912 | 210.4 |
| D | 7 | 223 | 539506 | 2499.24 | 901 | 879 | 215.5 |
| D | 10 | 70 | 88362 | 405.92 | 901 | 879 | 215.5 |
| D | 13 | 249 | 50846 | 231.85 | 901 | 879 | 215.5 |
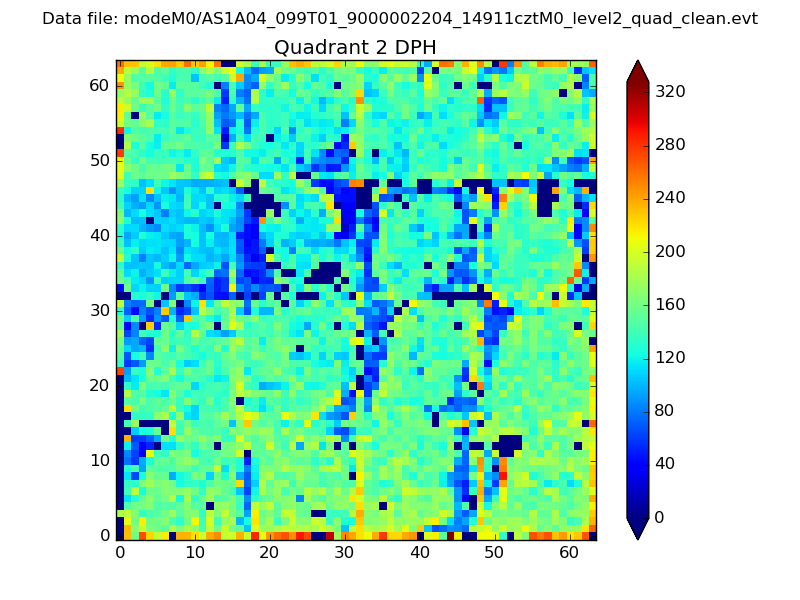
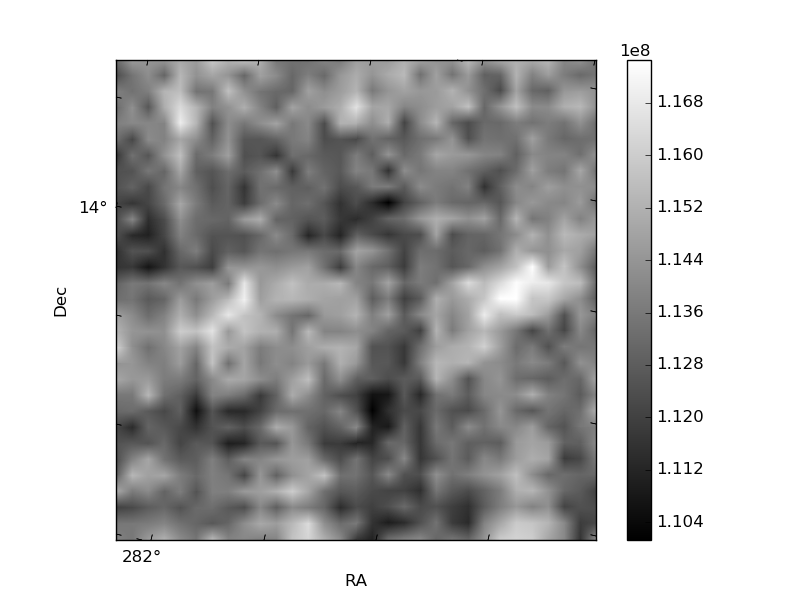
Histogram calculated using DETX and DETY for each event in the final _common_clean file
| Quadrant A | 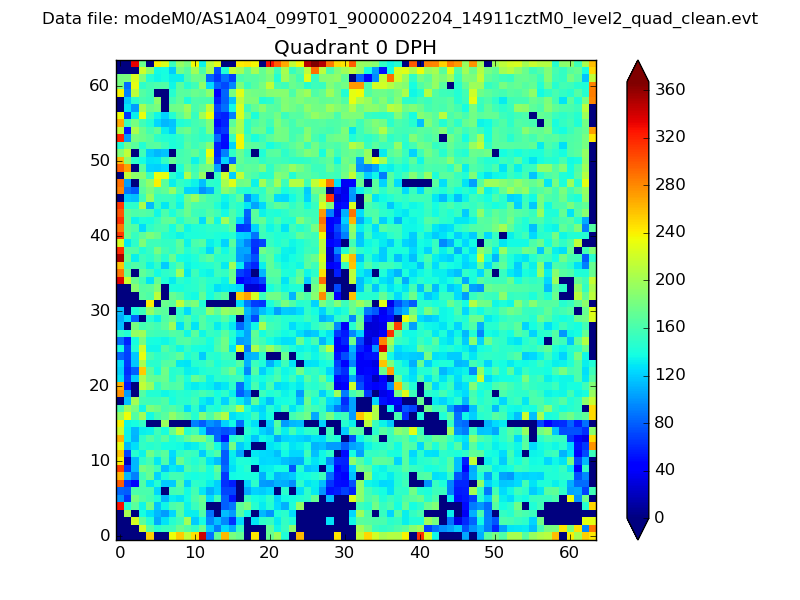 |
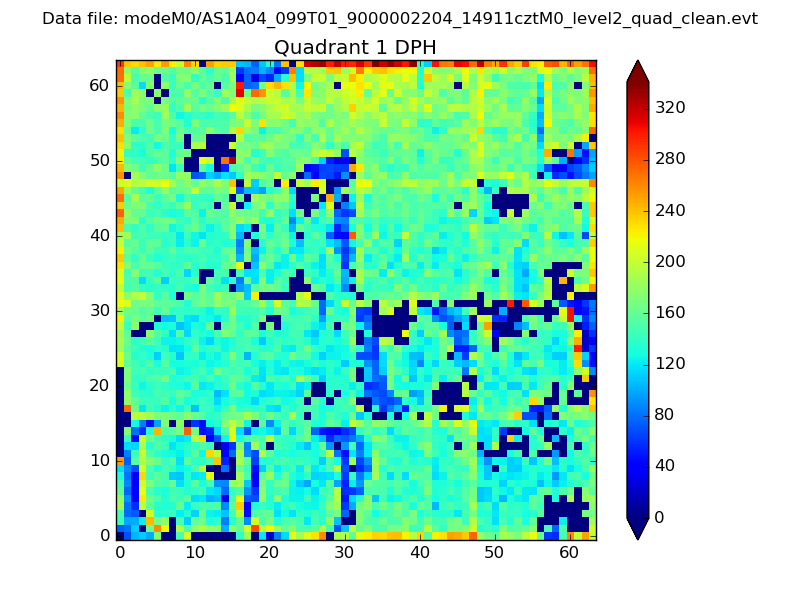 |
Quadrant B |
|---|---|---|---|
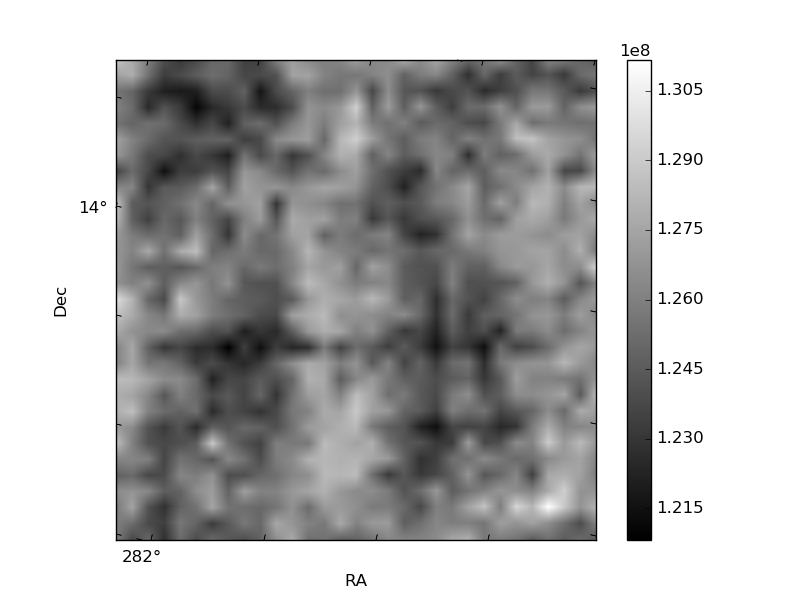
| Quadrant D | 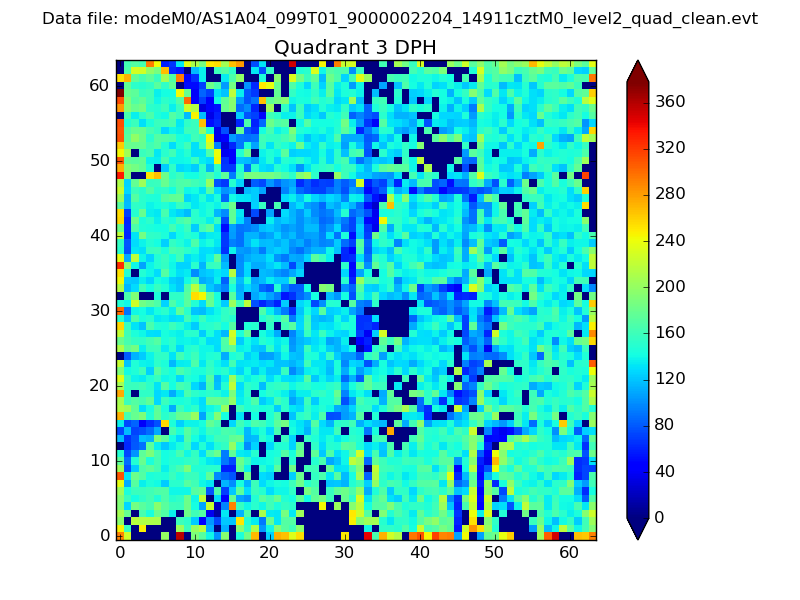 |
 |
Quadrant C |
| Plot type | Count rate plots | Images |
|---|---|---|
| Comparison with Poisson distribution Blue bars denote a histogram of data divided into 1 sec bins. Red curve is a Poisson curve with rate = median count rate of data. |
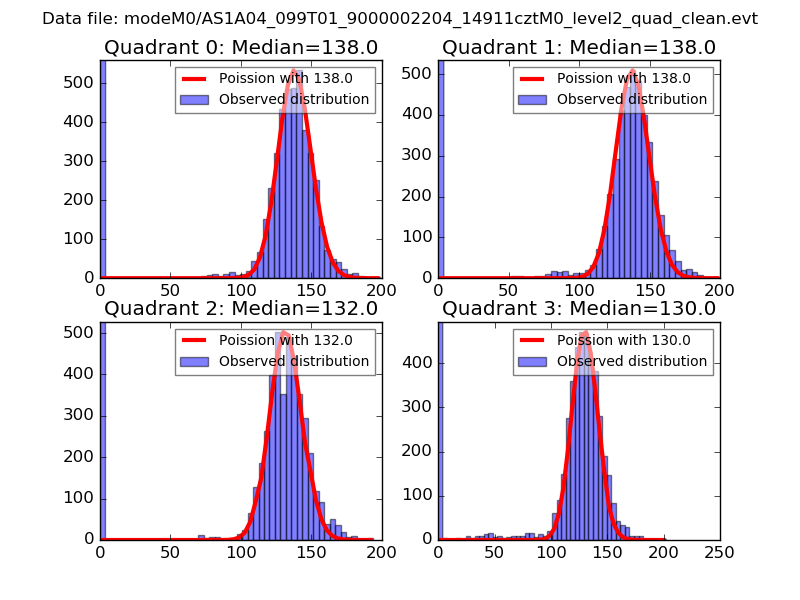 |
 |
| Quadrant-wise count rates Data is divided into 100 sec bins |
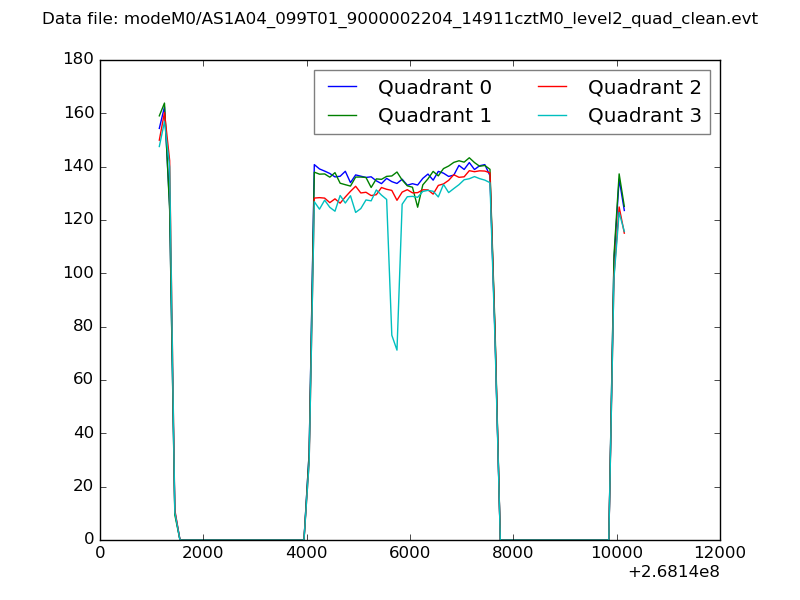 |
|
| Module-wise count rates for Quadrant A Data is divided into 100 sec bins |
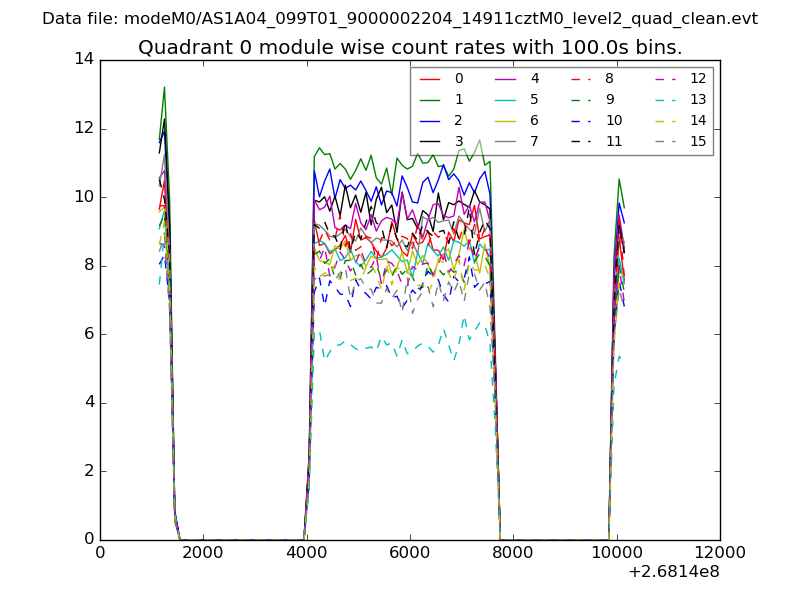 |
 |
| Module-wise count rates for Quadrant B Data is divided into 100 sec bins |
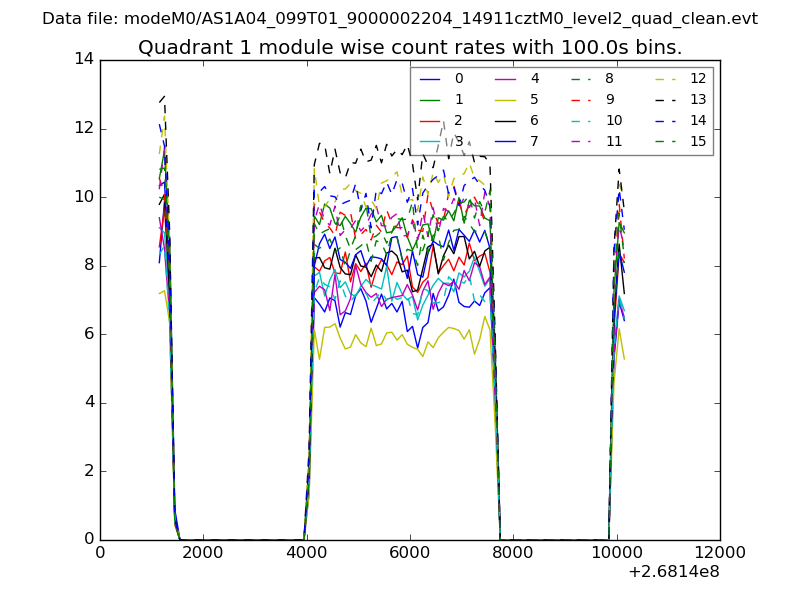 |
 |
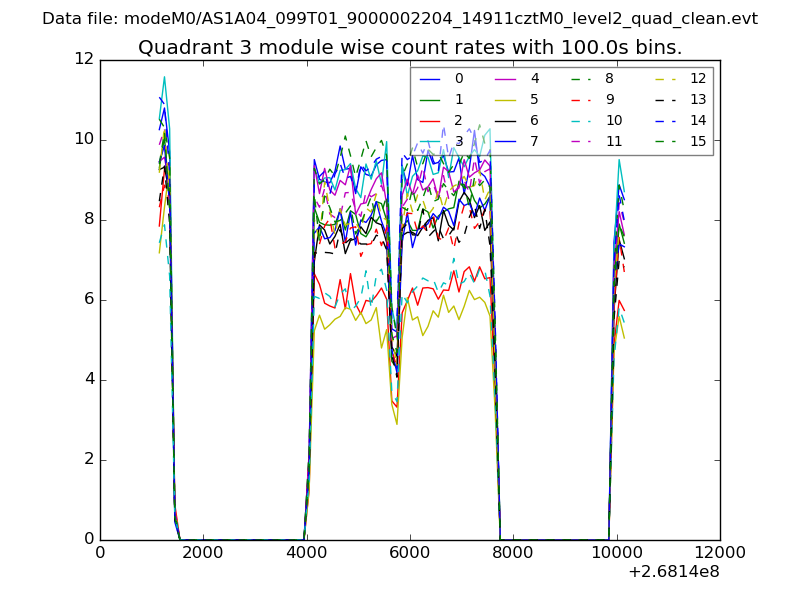
| Module-wise count rates for Quadrant C Data is divided into 100 sec bins |
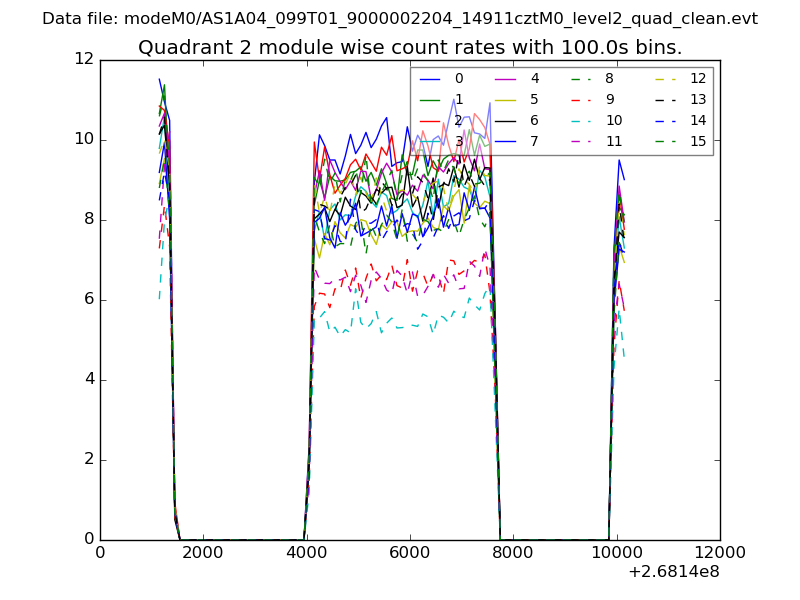 |
 |
| Module-wise count rates for Quadrant D Data is divided into 100 sec bins |
 |
 |
| Parameter | Plot |
|---|---|
| CZT HV Monitor | 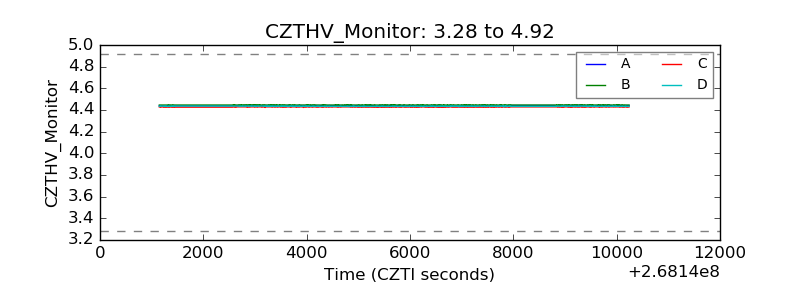 |
| D_VDD |  |
| Temperature 1 | 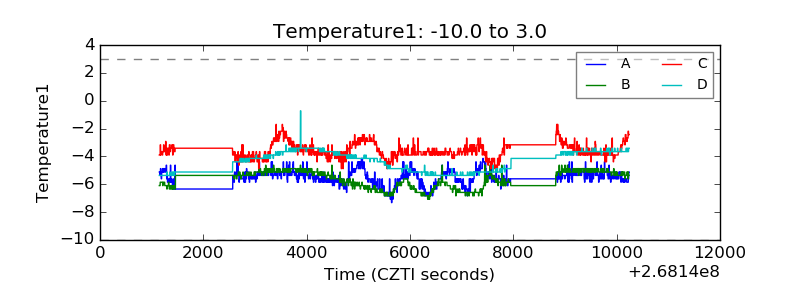 |
| Veto HV Monitor | 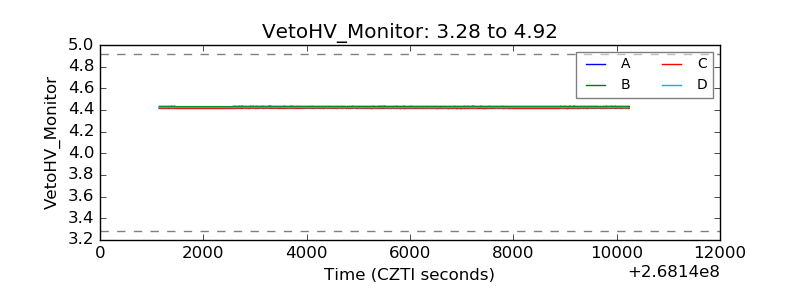 |
| Veto LLD | 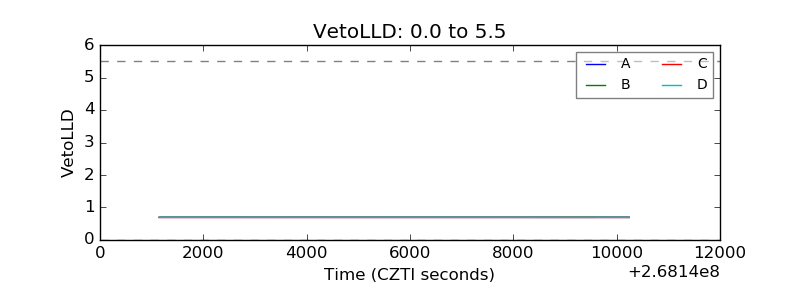 |
| Alpha Counter | 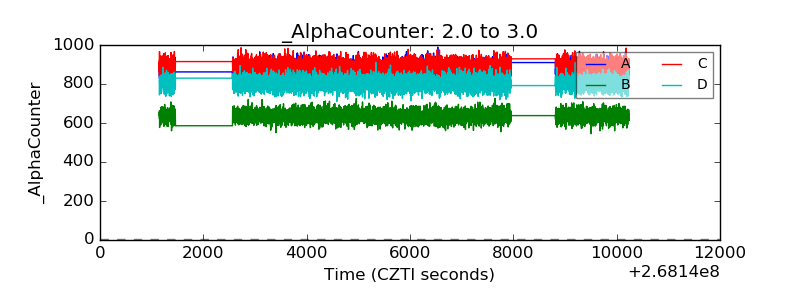 |
| _CPM_Rate | 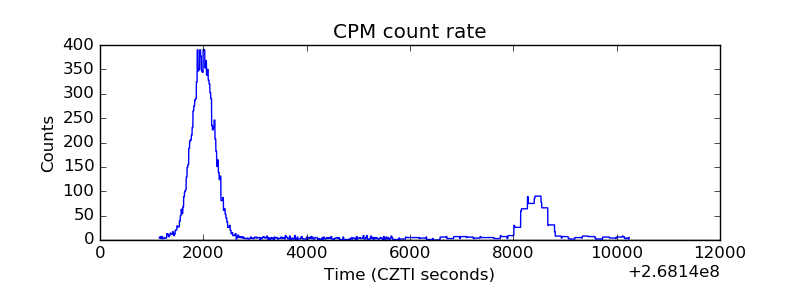 |
| CZT Counter | 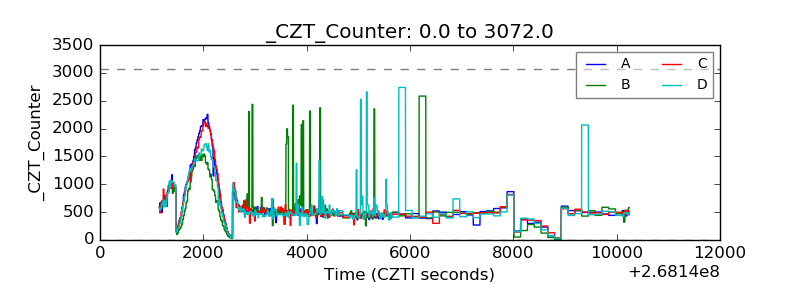 |
| +2.5 Volts monitor |  |
| +5 Volts monitor | 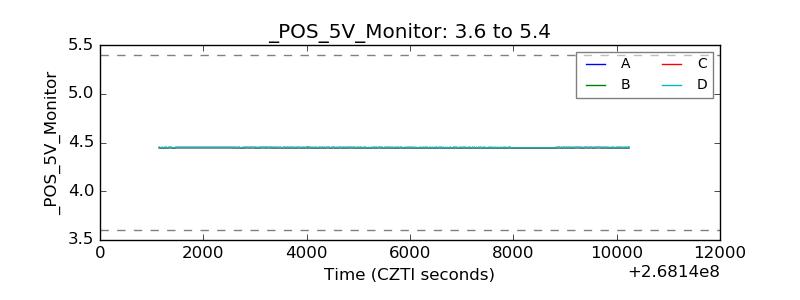 |
| _ROLL_ROT | 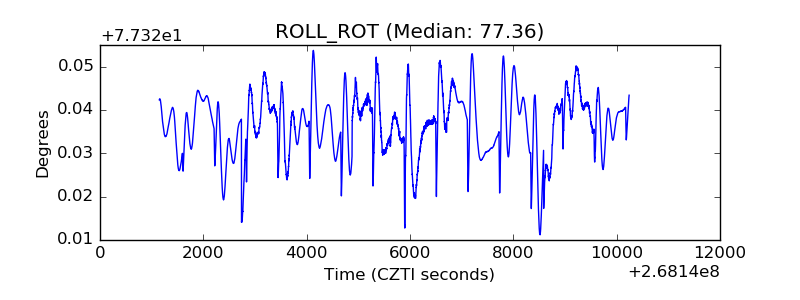 |
| _Roll_DEC | 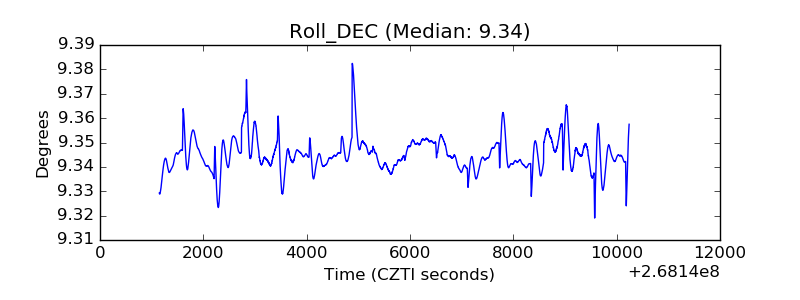 |
| _Roll_RA | 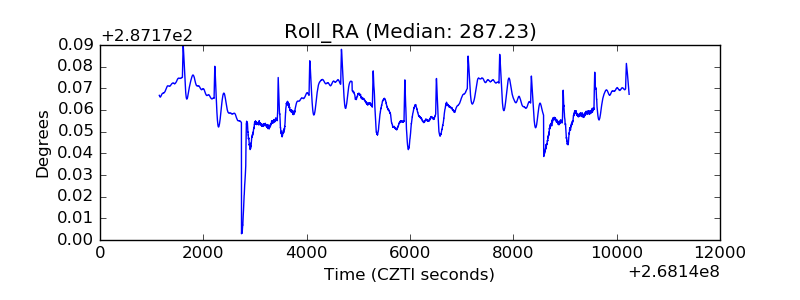 |
| Veto Counter | 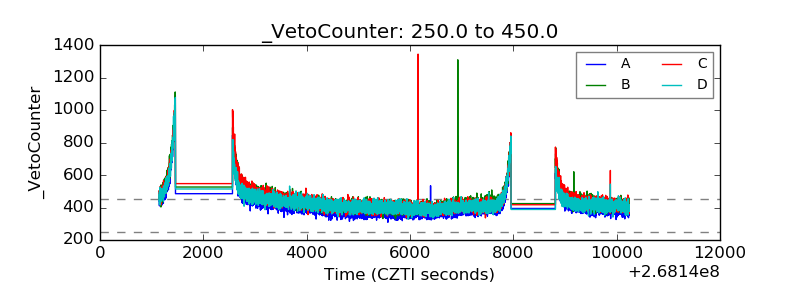 |