| Param | Original file | Final file |
|---|---|---|
| Filename | modeM0/AS1A04_099T01_9000002204_14912cztM0_level2.evt | modeM0/AS1A04_099T01_9000002204_14912cztM0_level2_quad_clean.evt |
| Size (bytes) | 545,293,440 | 97,254,720 |
| Size | 520.0 MB | 92.7 MB |
| Events in quadrant A | 3,916,654 | 612,320 |
| Events in quadrant B | 4,110,164 | 612,729 |
| Events in quadrant C | 3,939,485 | 590,028 |
| Events in quadrant D | 4,013,521 | 583,001 |
| Mode SS | |||
|---|---|---|---|
| Quadrant | BADHDUFLAG | Total packets | Discarded packets |
| A | 0 | 160 | 0 |
| B | 0 | 160 | 0 |
| C | 0 | 160 | 0 |
| D | 0 | 160 | 0 |
| Mode M0 | |||
|---|---|---|---|
| Quadrant | BADHDUFLAG | Total packets | Discarded packets |
| A | 0 | 16553 | 3 |
| B | 0 | 17031 | 2 |
| C | 0 | 16521 | 2 |
| D | 0 | 17255 | 2 |
| Mode M9 | |||
|---|---|---|---|
| Quadrant | BADHDUFLAG | Total packets | Discarded packets |
| A | 0 | 14 | 0 |
| B | 0 | 14 | 0 |
| C | 0 | 14 | 0 |
| D | 0 | 14 | 0 |
| Quadrant | Total seconds | Saturated seconds | Saturation percentage |
|---|---|---|---|
| A | 7875 | 178 | 2.260317% |
| B | 7875 | 319 | 4.050794% |
| C | 7875 | 155 | 1.968254% |
| D | 7875 | 175 | 2.222222% |
Noise dominated data is calculated using 1-second bins in cleaned event files. If a bin has >2000 counts, and if more than 50% of those come from <1% of pixels, then it is considered to be noise-dominated and hence unusable.
| Quadrant | # 1 sec bins | Bins with >0 counts | Bins with >2000 counts | High rate bins dominated by noise | Noise dominated (total time) | Noise dominated (detector-on time) | Marked lightcurve |
|---|---|---|---|---|---|---|---|
| A | 9166 | 7878 | 0 | 0 | 0.00% | 0.00% | 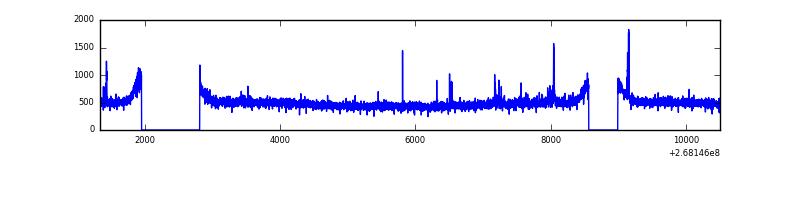 |
| B | 9166 | 7878 | 62 | 62 | 0.68% | 0.79% | 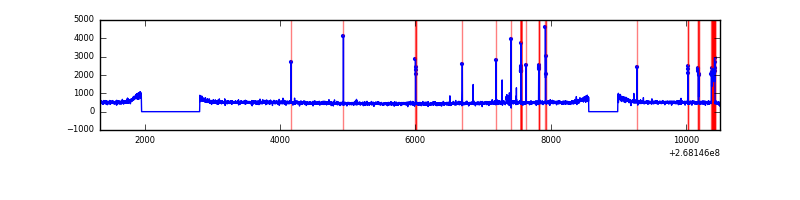 |
| C | 9166 | 7878 | 1 | 1 | 0.01% | 0.01% | 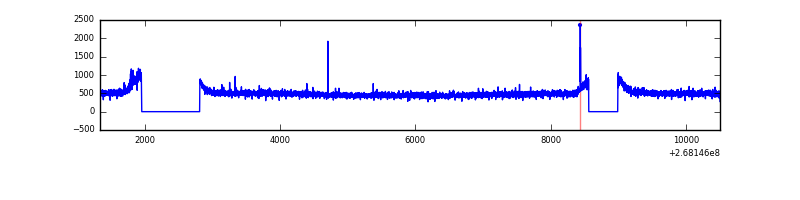 |
| D | 9166 | 7878 | 19 | 19 | 0.21% | 0.24% | 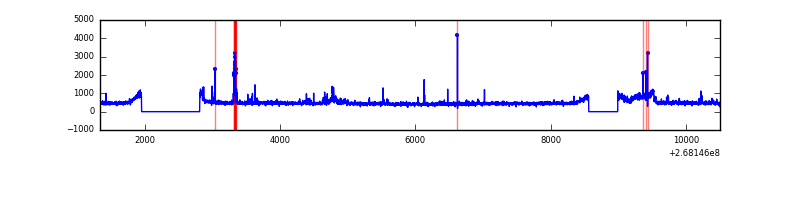 |
Top three noisy pixels from each quadrant. If the there are fewer than three noisy pixels in the level2.evt file, extra rows are filled as -1
| Pixel properties | Quadrant properties | ||||||
|---|---|---|---|---|---|---|---|
| Quadrant | DetID | PixID | Counts | Sigma | Mean | Median | Sigma |
| A | 15 | 31 | 26023 | 123.82 | 1000 | 980 | 202.3 |
| A | 12 | 189 | 24424 | 115.91 | 1000 | 980 | 202.3 |
| A | 4 | 2 | 17958 | 83.94 | 1000 | 980 | 202.3 |
| B | 10 | 16 | 220866 | 1140.65 | 989 | 964 | 192.8 |
| B | 12 | 111 | 23839 | 118.65 | 989 | 964 | 192.8 |
| B | 11 | 111 | 20393 | 100.78 | 989 | 964 | 192.8 |
| C | 3 | 233 | 143684 | 639.58 | 966 | 971 | 223.1 |
| C | 0 | 207 | 22022 | 94.34 | 966 | 971 | 223.1 |
| C | 13 | 61 | 6740 | 25.85 | 966 | 971 | 223.1 |
| D | 10 | 70 | 168199 | 726.81 | 966 | 942 | 230.1 |
| D | 7 | 254 | 124785 | 538.15 | 966 | 942 | 230.1 |
| D | 13 | 104 | 45419 | 193.27 | 966 | 942 | 230.1 |
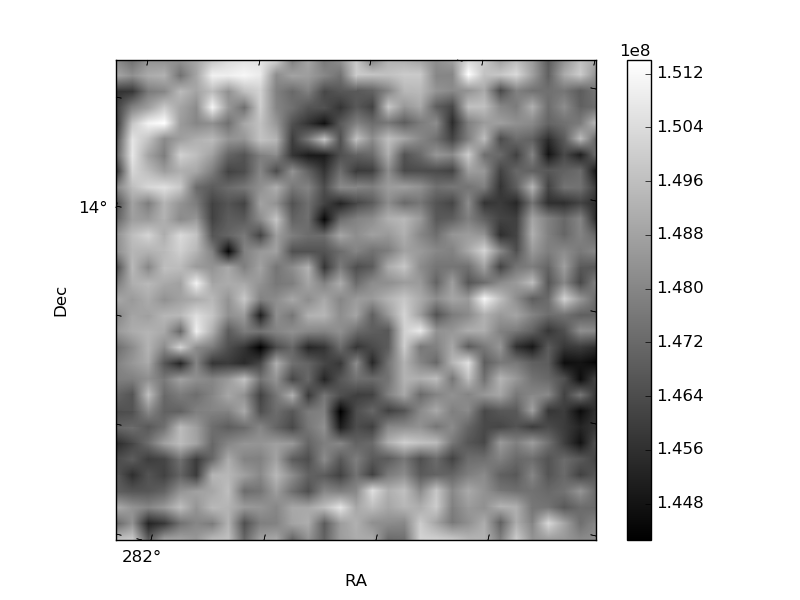
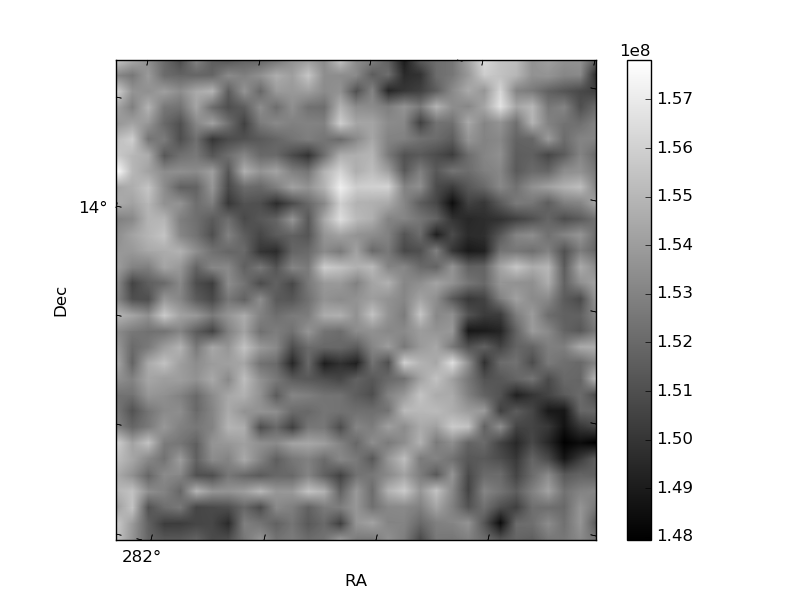
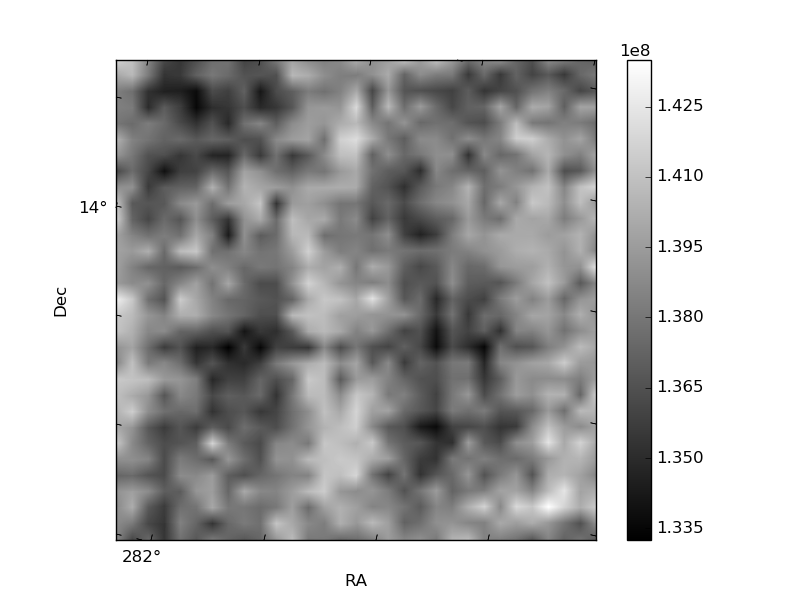
Histogram calculated using DETX and DETY for each event in the final _common_clean file
| Quadrant A | 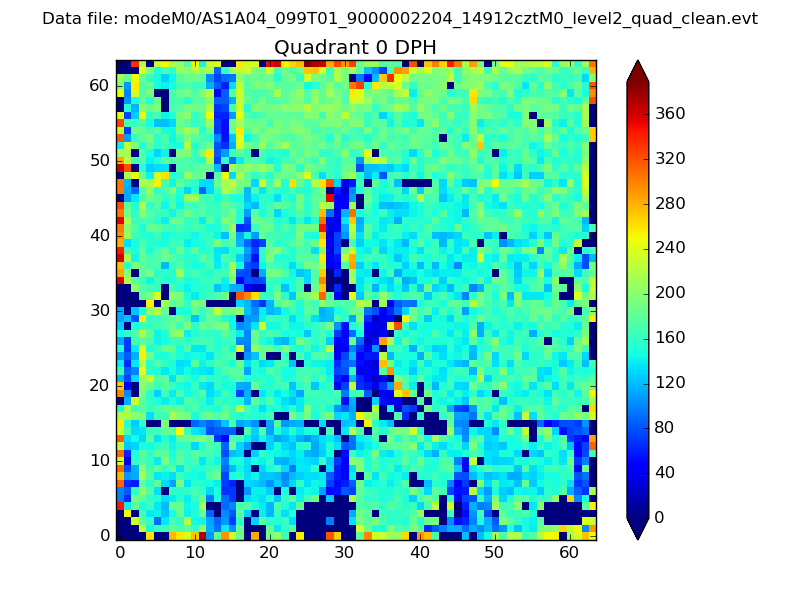 |
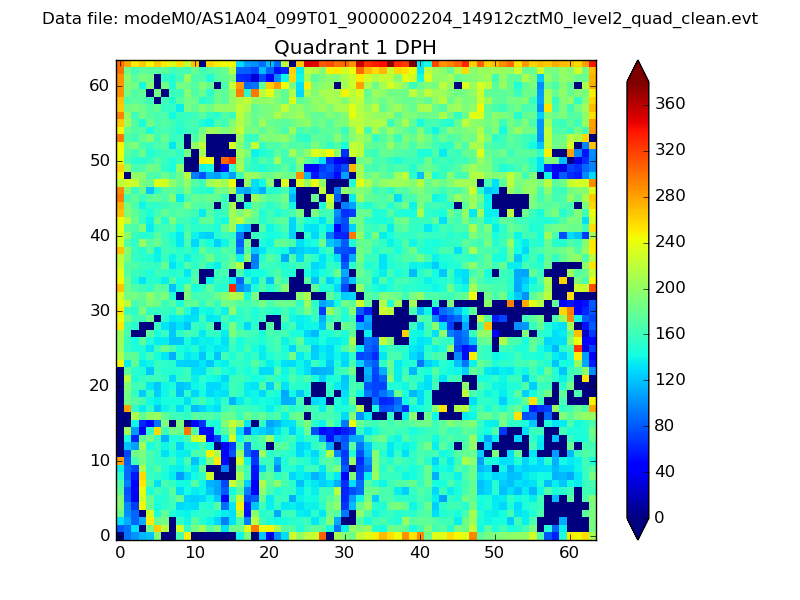 |
Quadrant B |
|---|---|---|---|
| Quadrant D | 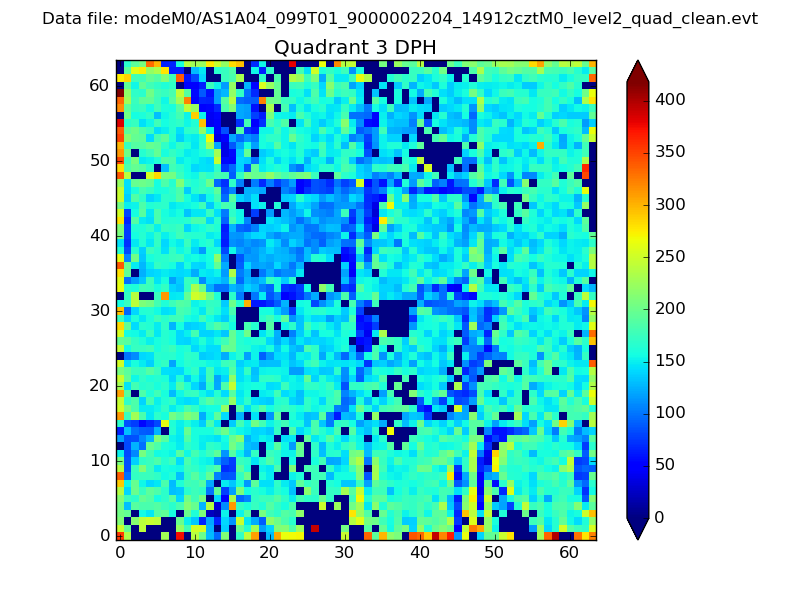 |
 |
Quadrant C |
| Plot type | Count rate plots | Images |
|---|---|---|
| Comparison with Poisson distribution Blue bars denote a histogram of data divided into 1 sec bins. Red curve is a Poisson curve with rate = median count rate of data. |
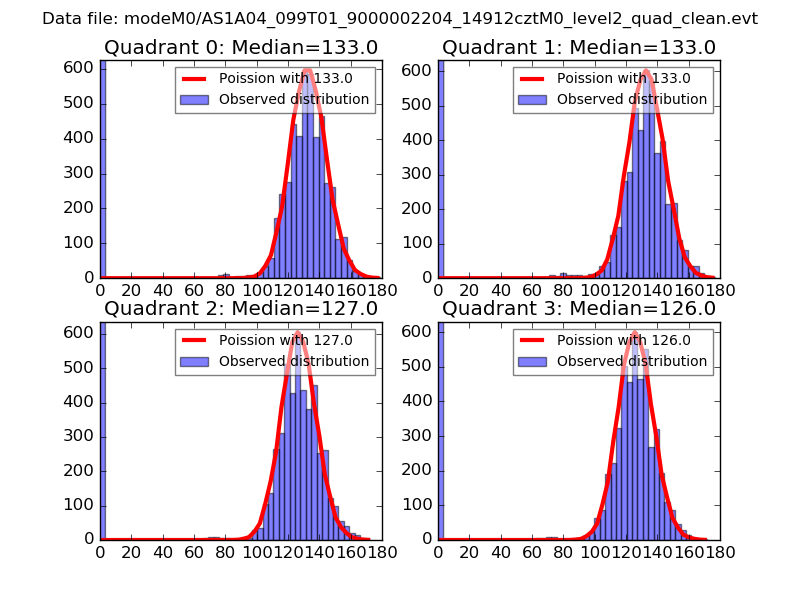 |
 |
| Quadrant-wise count rates Data is divided into 100 sec bins |
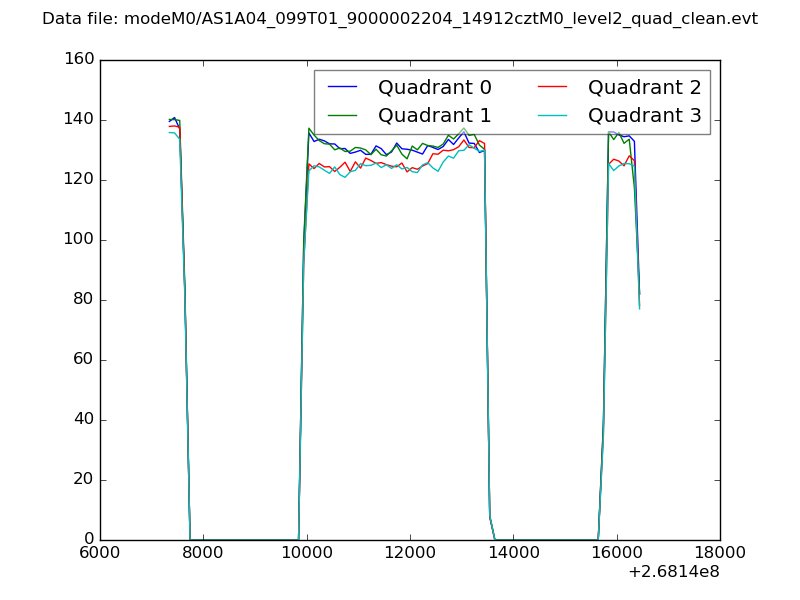 |
|
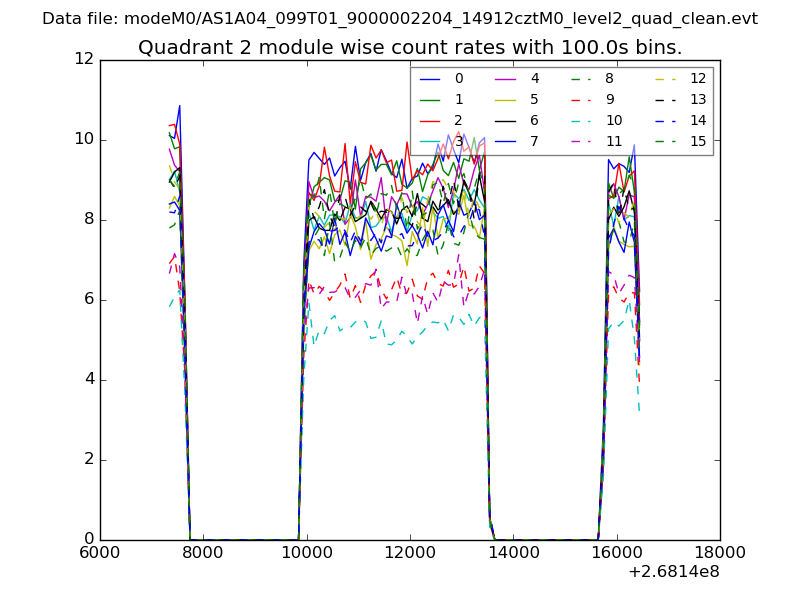
| Module-wise count rates for Quadrant A Data is divided into 100 sec bins |
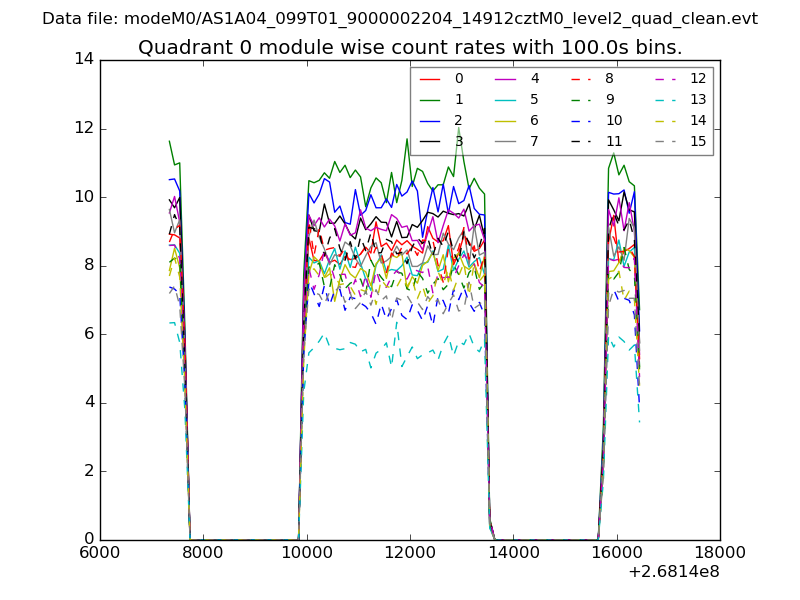 |
 |
| Module-wise count rates for Quadrant B Data is divided into 100 sec bins |
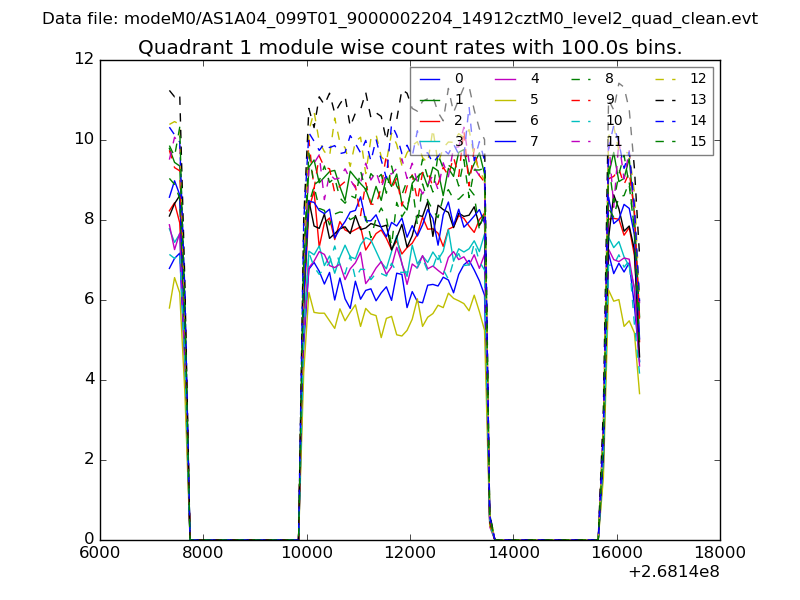 |
 |
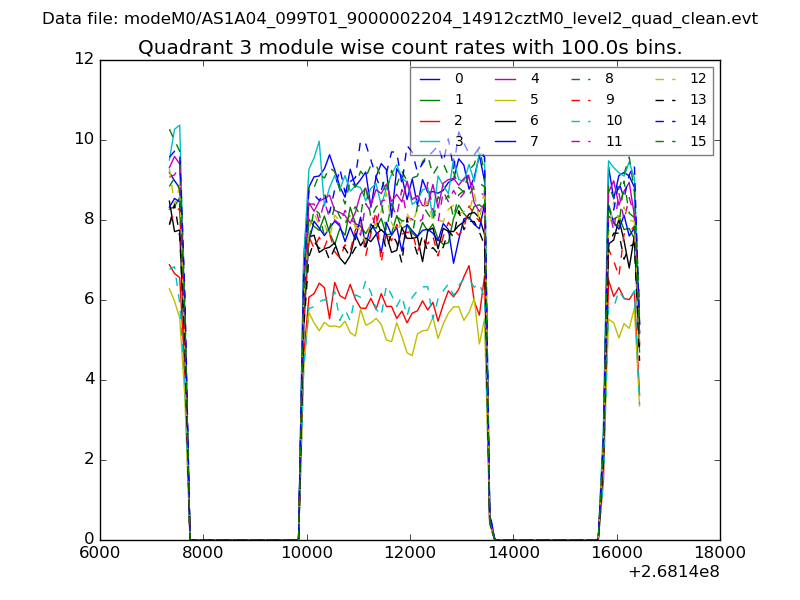
| Module-wise count rates for Quadrant C Data is divided into 100 sec bins |
 |
 |
| Module-wise count rates for Quadrant D Data is divided into 100 sec bins |
 |
 |
| Parameter | Plot |
|---|---|
| CZT HV Monitor | 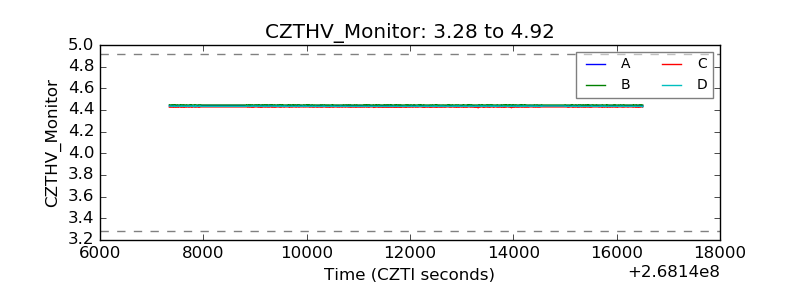 |
| D_VDD |  |
| Temperature 1 | 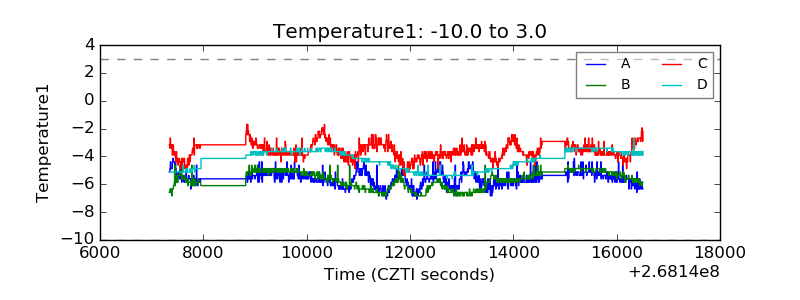 |
| Veto HV Monitor | 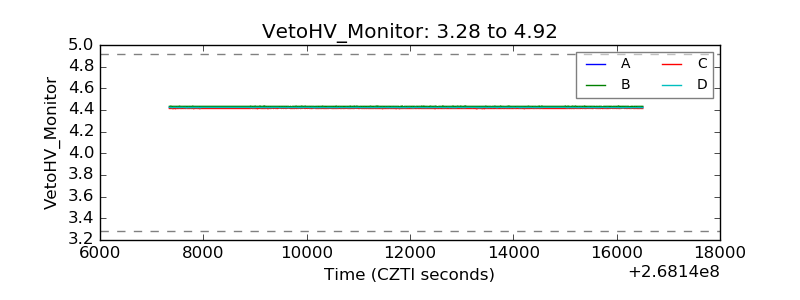 |
| Veto LLD | 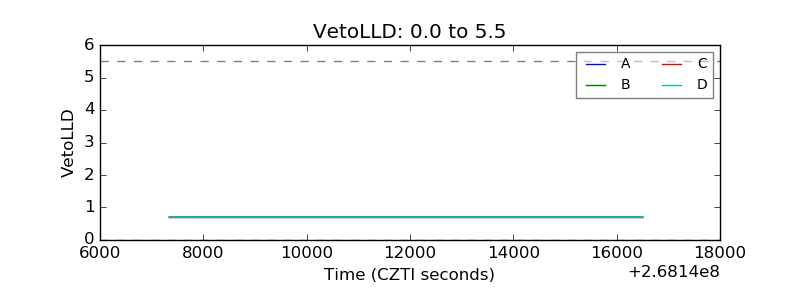 |
| Alpha Counter | 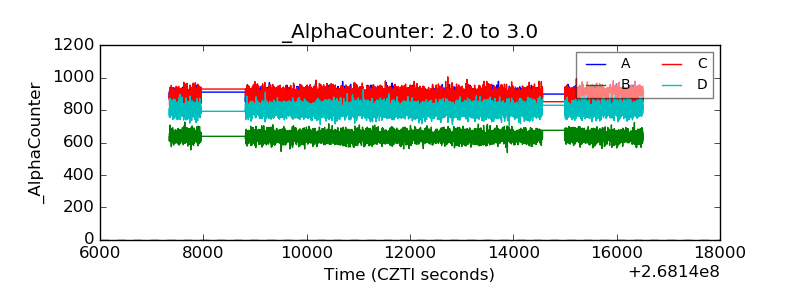 |
| _CPM_Rate | 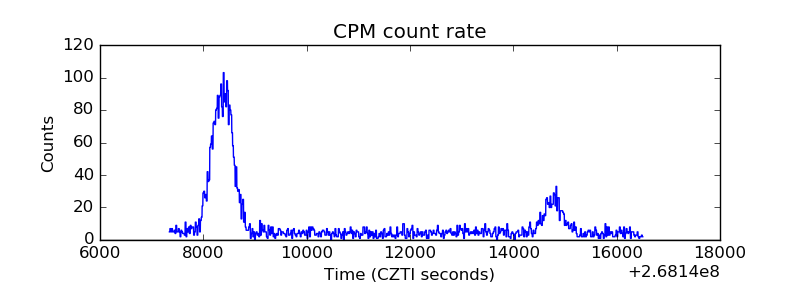 |
| CZT Counter |  |
| +2.5 Volts monitor |  |
| +5 Volts monitor |  |
| _ROLL_ROT | 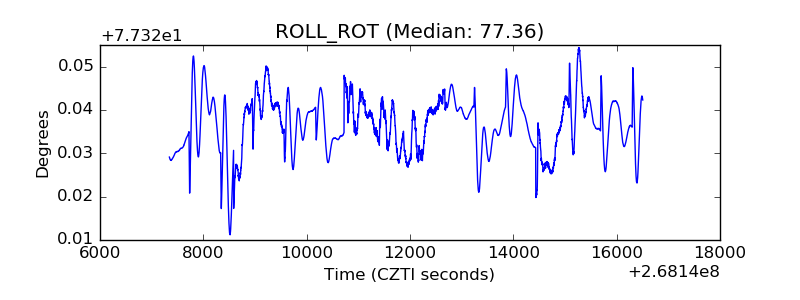 |
| _Roll_DEC | 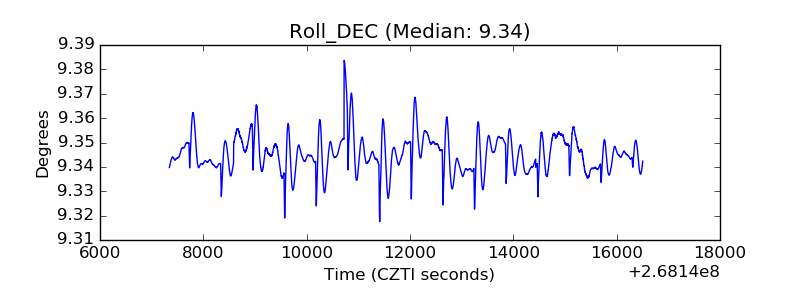 |
| _Roll_RA | 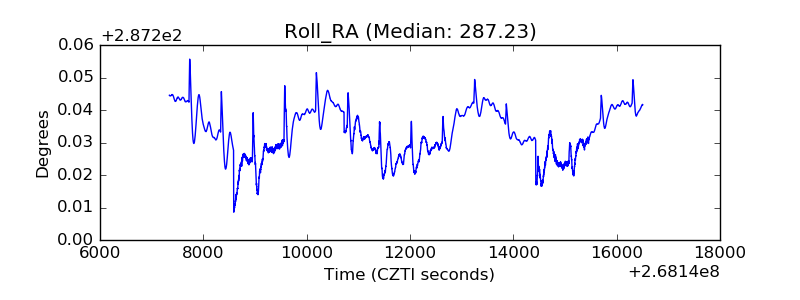 |
| Veto Counter | 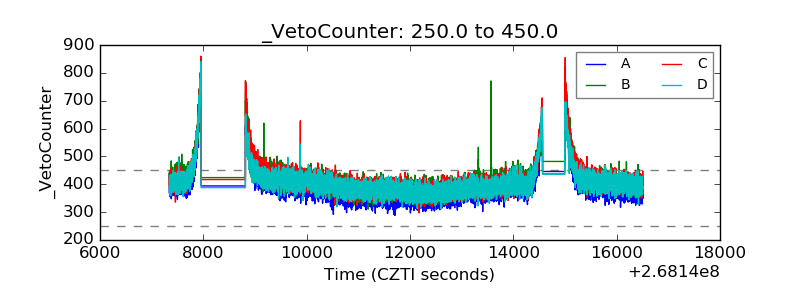 |