| Param | Original file | Final file |
|---|---|---|
| Filename | modeM0/AS1A04_099T01_9000002204_14913cztM0_level2.evt | modeM0/AS1A04_099T01_9000002204_14913cztM0_level2_quad_clean.evt |
| Size (bytes) | 514,304,640 | 96,540,480 |
| Size | 490.5 MB | 92.1 MB |
| Events in quadrant A | 3,633,470 | 616,954 |
| Events in quadrant B | 3,893,484 | 613,012 |
| Events in quadrant C | 3,729,478 | 592,582 |
| Events in quadrant D | 3,812,748 | 582,159 |
| Mode SS | |||
|---|---|---|---|
| Quadrant | BADHDUFLAG | Total packets | Discarded packets |
| A | 0 | 152 | 0 |
| B | 0 | 152 | 0 |
| C | 0 | 152 | 0 |
| D | 0 | 152 | 0 |
| Mode M0 | |||
|---|---|---|---|
| Quadrant | BADHDUFLAG | Total packets | Discarded packets |
| A | 0 | 15458 | 3 |
| B | 0 | 16248 | 2 |
| C | 0 | 15581 | 2 |
| D | 0 | 16496 | 2 |
| Mode M9 | |||
|---|---|---|---|
| Quadrant | BADHDUFLAG | Total packets | Discarded packets |
| A | 0 | 1 | 0 |
| B | 0 | 1 | 0 |
| C | 0 | 1 | 0 |
| D | 0 | 1 | 0 |
| Quadrant | Total seconds | Saturated seconds | Saturation percentage |
|---|---|---|---|
| A | 7452 | 148 | 1.986044% |
| B | 7452 | 332 | 4.455180% |
| C | 7452 | 139 | 1.865271% |
| D | 7452 | 216 | 2.898551% |
Noise dominated data is calculated using 1-second bins in cleaned event files. If a bin has >2000 counts, and if more than 50% of those come from <1% of pixels, then it is considered to be noise-dominated and hence unusable.
| Quadrant | # 1 sec bins | Bins with >0 counts | Bins with >2000 counts | High rate bins dominated by noise | Noise dominated (total time) | Noise dominated (detector-on time) | Marked lightcurve |
|---|---|---|---|---|---|---|---|
| A | 7608 | 7455 | 0 | 0 | 0.00% | 0.00% | 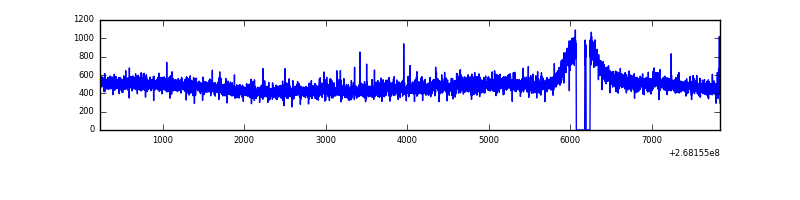 |
| B | 7608 | 7455 | 87 | 87 | 1.14% | 1.17% | 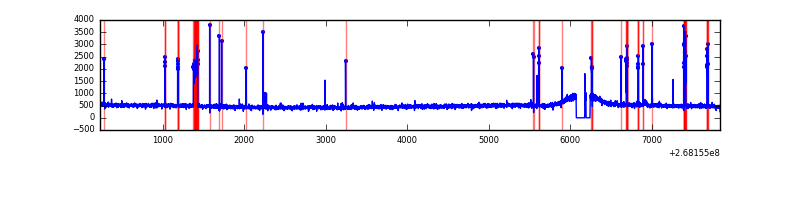 |
| C | 7608 | 7455 | 0 | 0 | 0.00% | 0.00% | 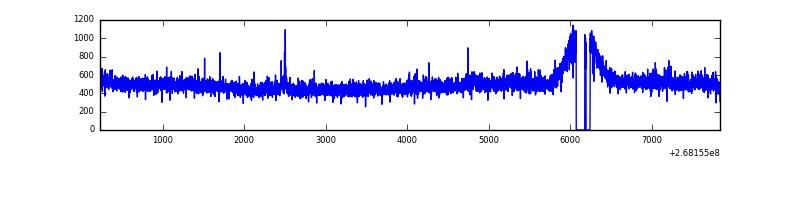 |
| D | 7608 | 7455 | 58 | 58 | 0.76% | 0.78% | 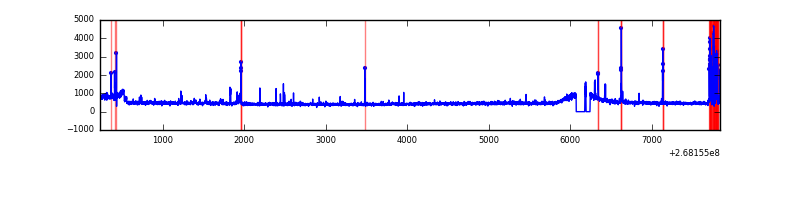 |
Top three noisy pixels from each quadrant. If the there are fewer than three noisy pixels in the level2.evt file, extra rows are filled as -1
| Pixel properties | Quadrant properties | ||||||
|---|---|---|---|---|---|---|---|
| Quadrant | DetID | PixID | Counts | Sigma | Mean | Median | Sigma |
| A | 12 | 189 | 53183 | 278.49 | 929 | 908 | 187.7 |
| A | 0 | 226 | 8062 | 38.11 | 929 | 908 | 187.7 |
| A | 12 | 194 | 6690 | 30.8 | 929 | 908 | 187.7 |
| B | 10 | 16 | 286056 | 1602.01 | 917 | 898 | 178.0 |
| B | 12 | 111 | 22084 | 119.02 | 917 | 898 | 178.0 |
| B | 11 | 111 | 19297 | 103.37 | 917 | 898 | 178.0 |
| C | 3 | 233 | 161896 | 769.12 | 901 | 906 | 209.3 |
| C | 7 | 247 | 48507 | 227.41 | 901 | 906 | 209.3 |
| C | 13 | 61 | 6325 | 25.89 | 901 | 906 | 209.3 |
| D | 10 | 70 | 236376 | 1095.7 | 898 | 877 | 214.9 |
| D | 7 | 254 | 114046 | 526.54 | 898 | 877 | 214.9 |
| D | 7 | 223 | 28738 | 129.63 | 898 | 877 | 214.9 |
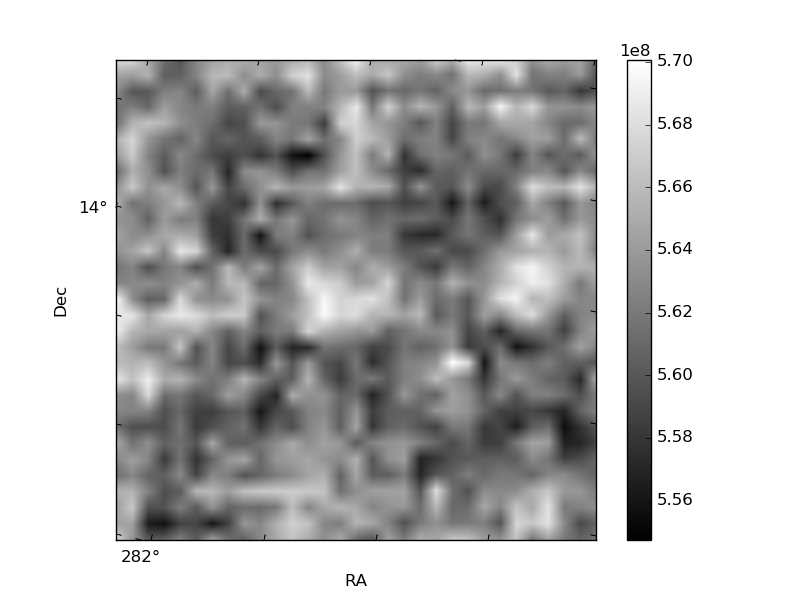
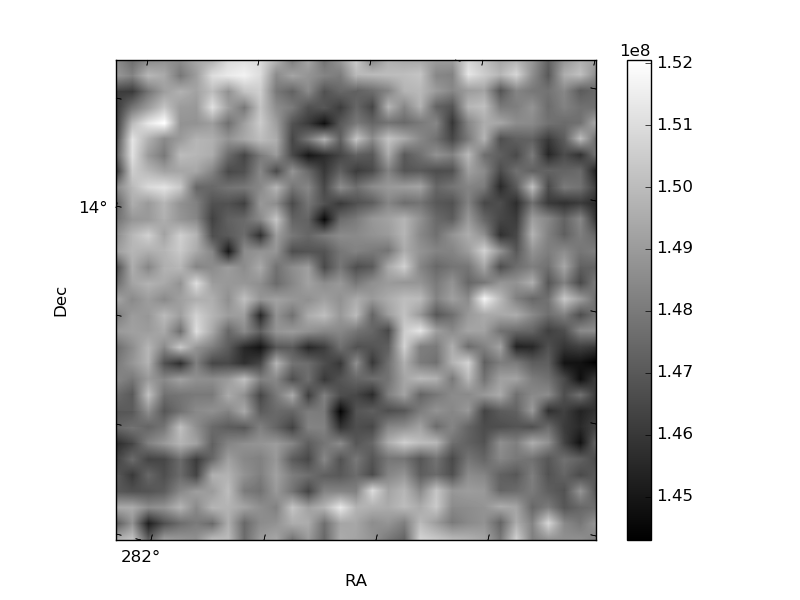
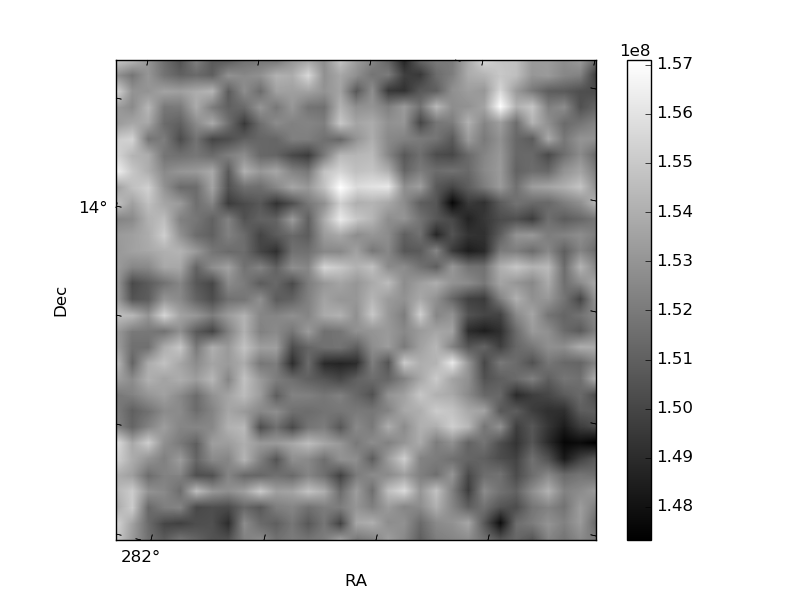
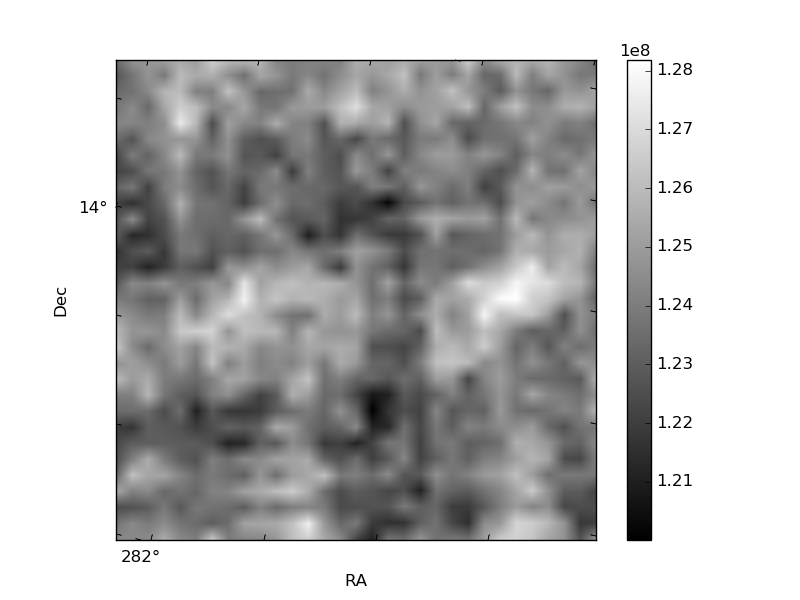
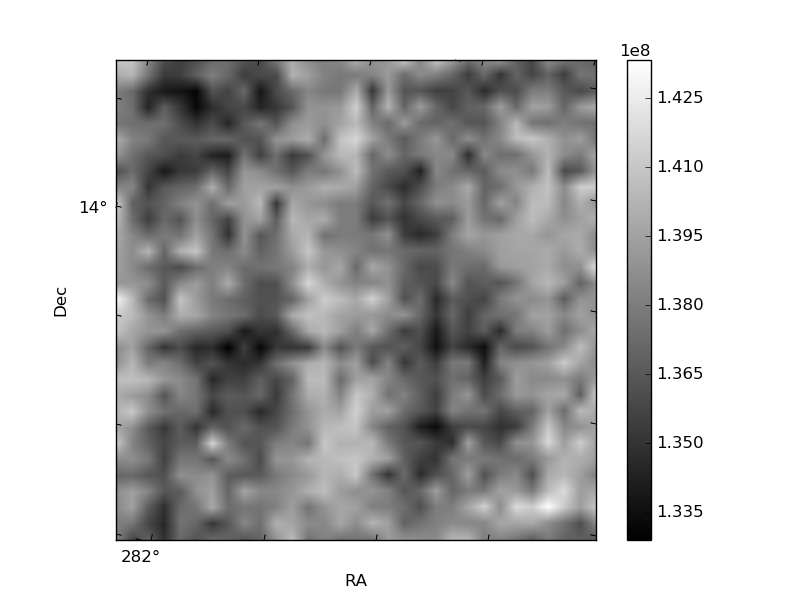
Histogram calculated using DETX and DETY for each event in the final _common_clean file
| Quadrant A | 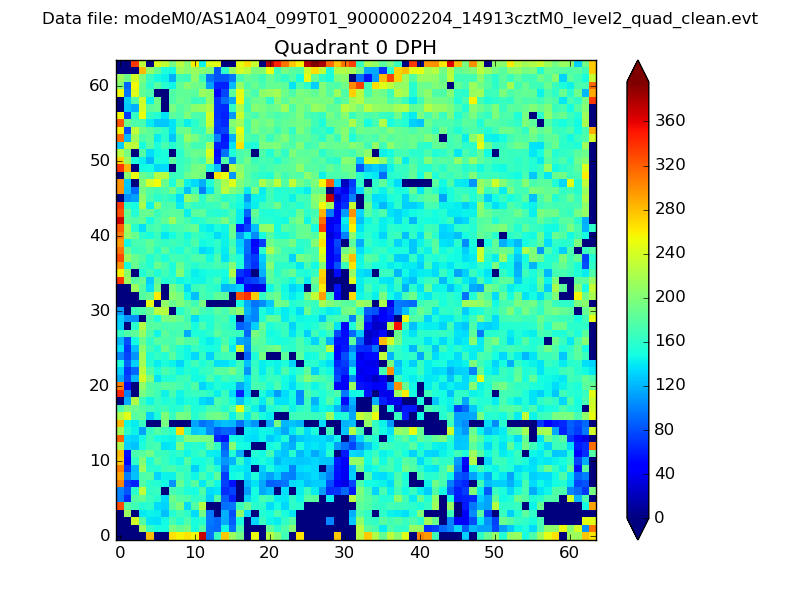 |
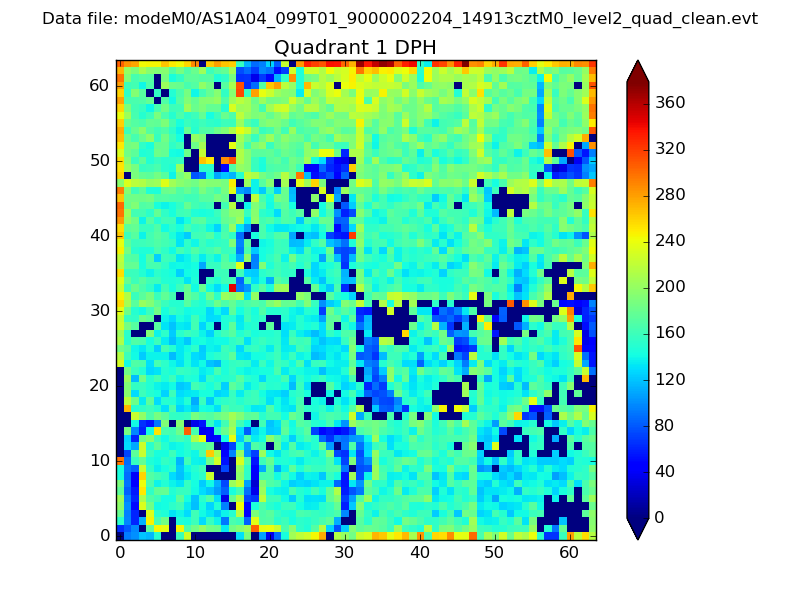 |
Quadrant B |
|---|---|---|---|
| Quadrant D | 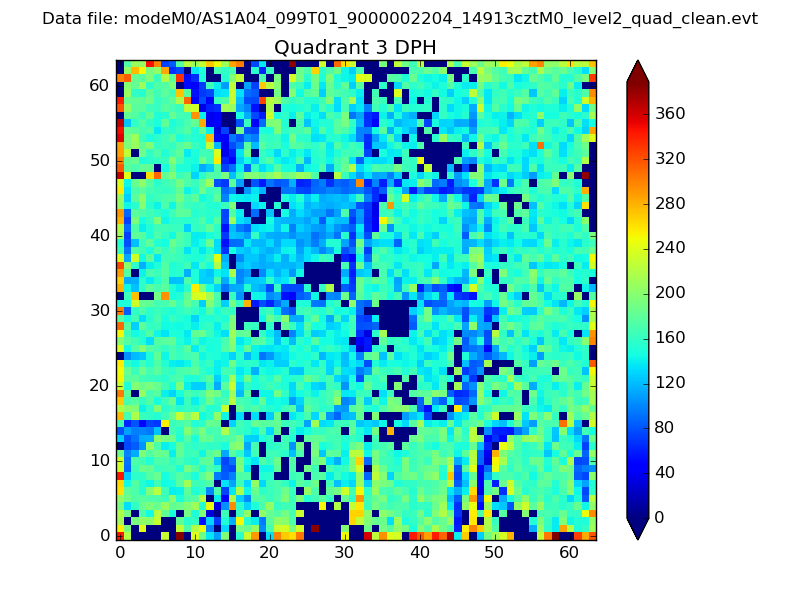 |
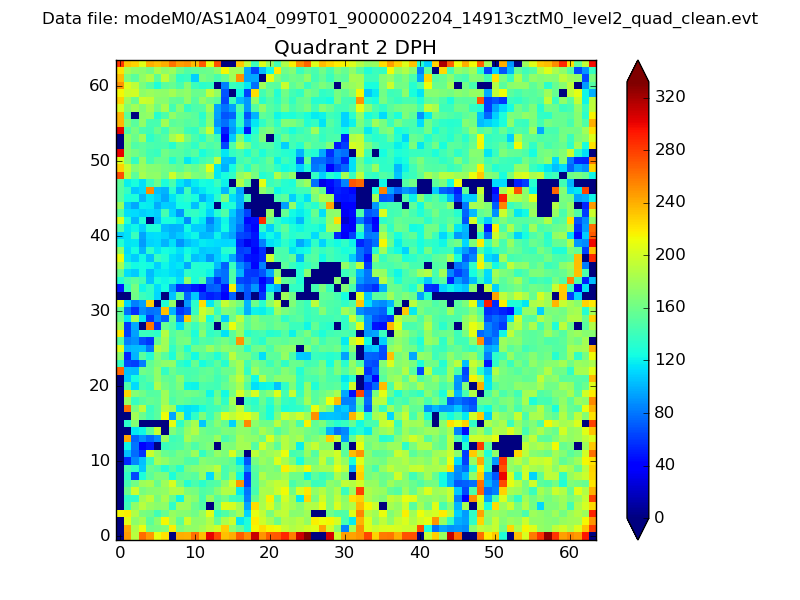 |
Quadrant C |
| Plot type | Count rate plots | Images |
|---|---|---|
| Comparison with Poisson distribution Blue bars denote a histogram of data divided into 1 sec bins. Red curve is a Poisson curve with rate = median count rate of data. |
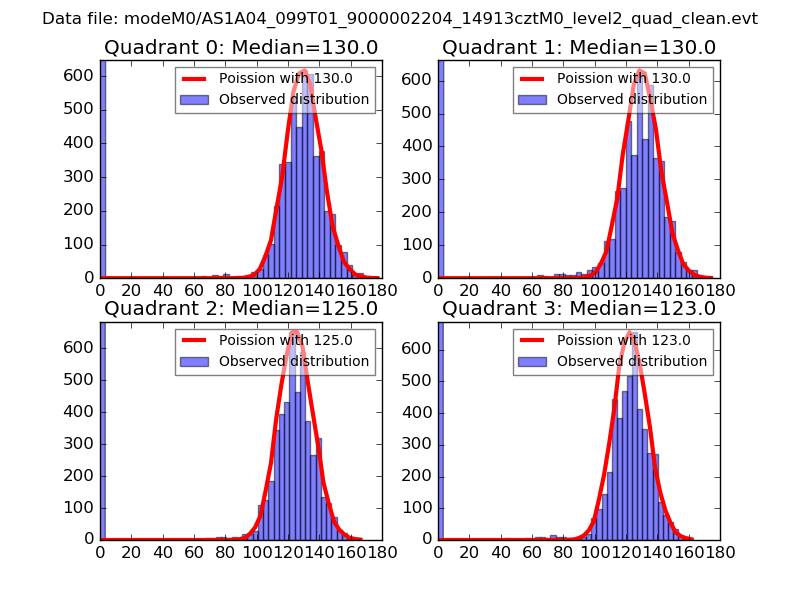 |
 |
| Quadrant-wise count rates Data is divided into 100 sec bins |
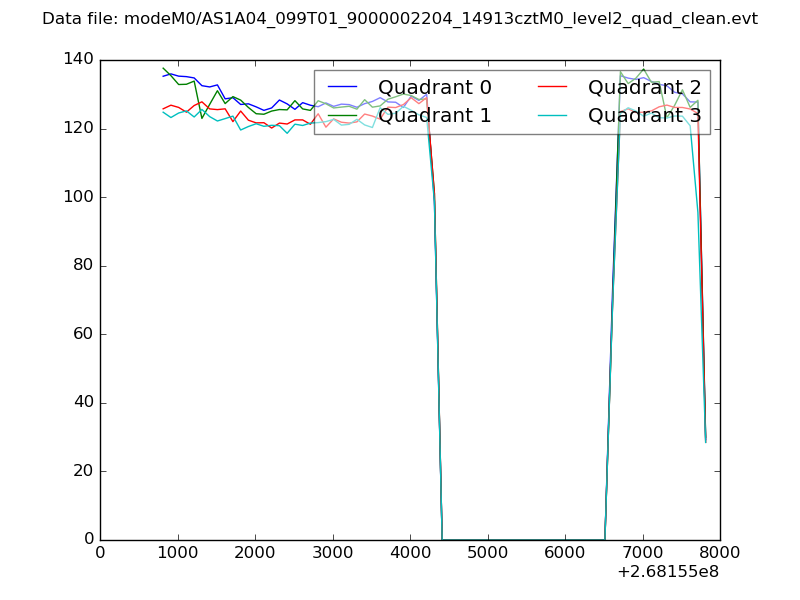 |
|
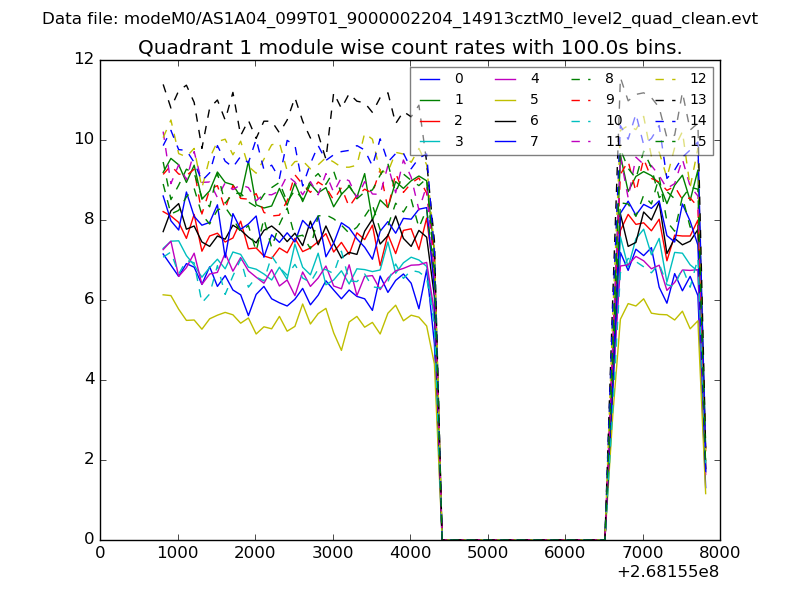
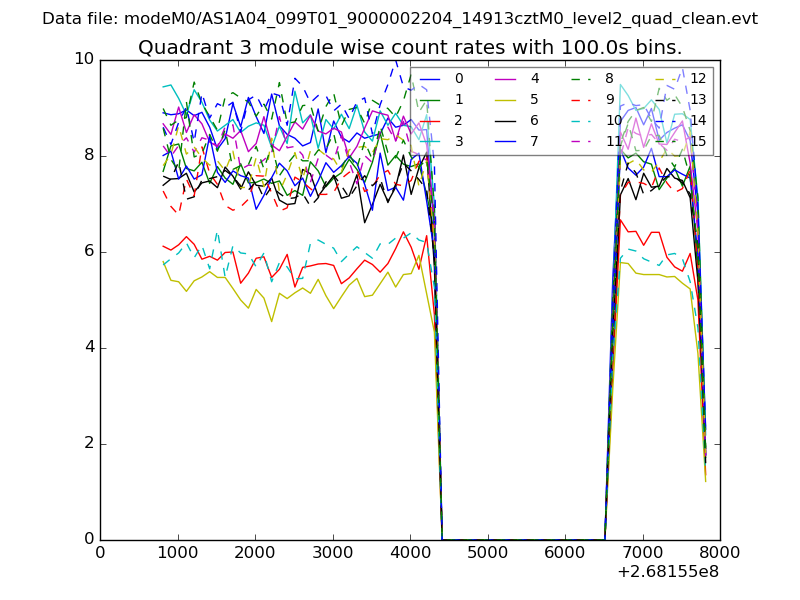
| Module-wise count rates for Quadrant A Data is divided into 100 sec bins |
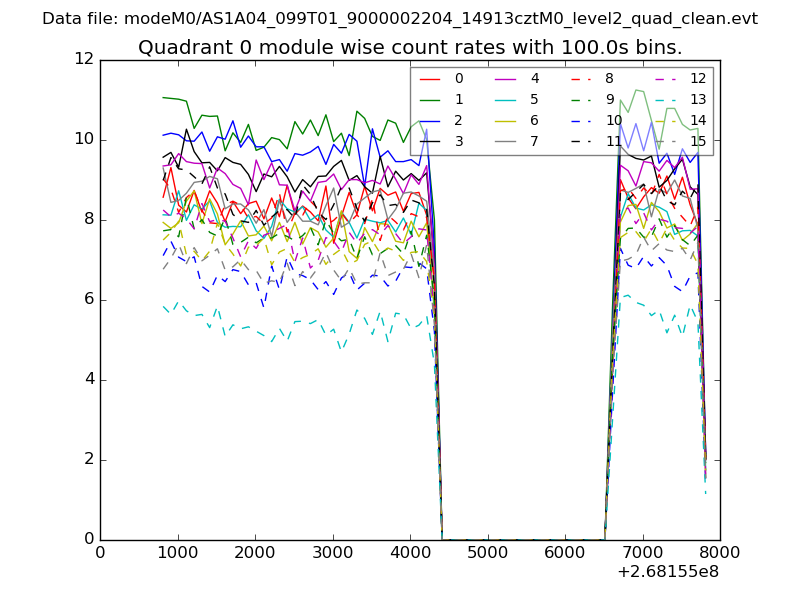 |
 |
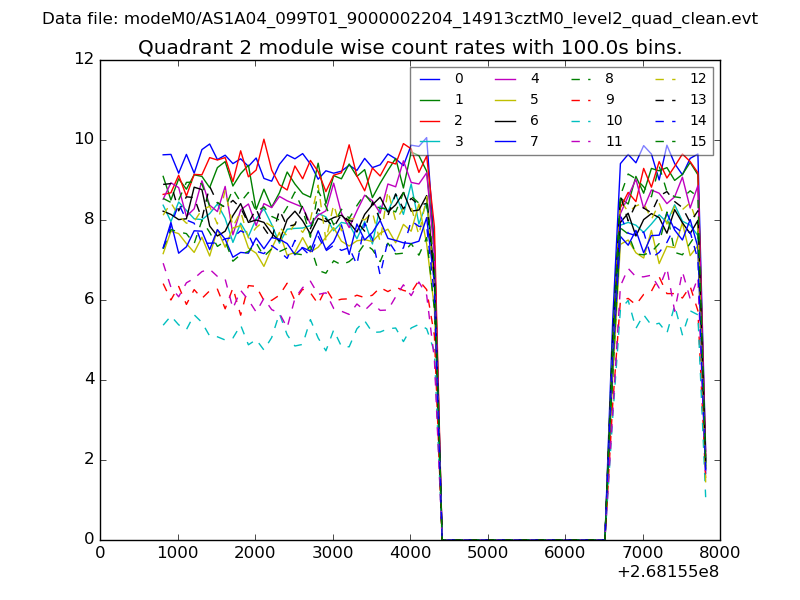
| Module-wise count rates for Quadrant B Data is divided into 100 sec bins |
 |
 |
| Module-wise count rates for Quadrant C Data is divided into 100 sec bins |
 |
 |
| Module-wise count rates for Quadrant D Data is divided into 100 sec bins |
 |
 |
| Parameter | Plot |
|---|---|
| CZT HV Monitor | 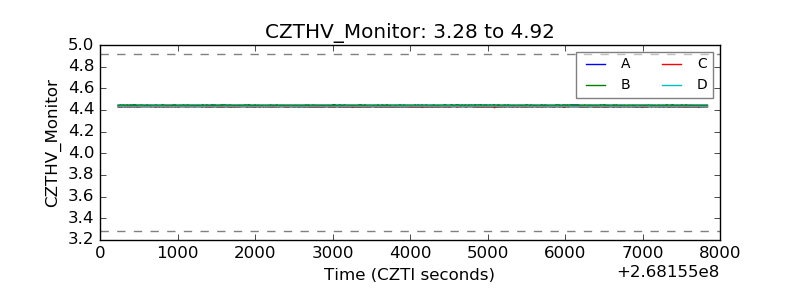 |
| D_VDD | 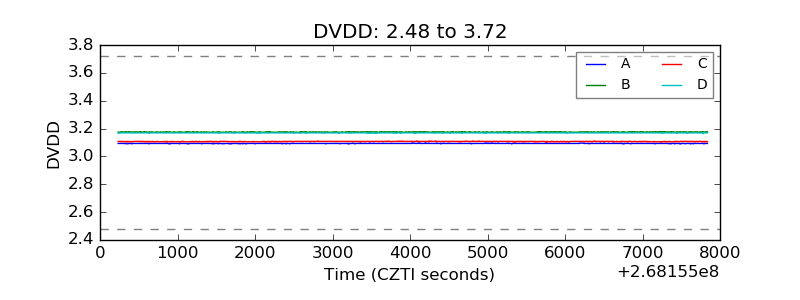 |
| Temperature 1 | 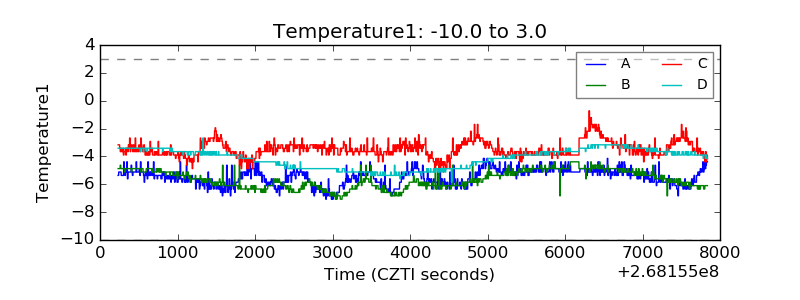 |
| Veto HV Monitor | 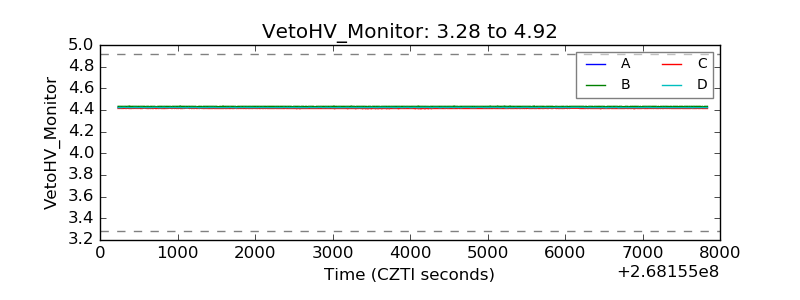 |
| Veto LLD | 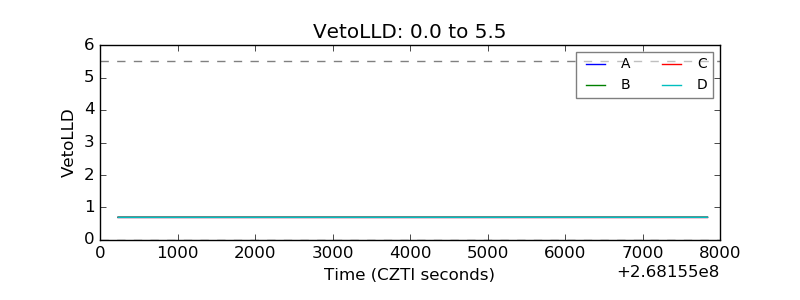 |
| Alpha Counter | 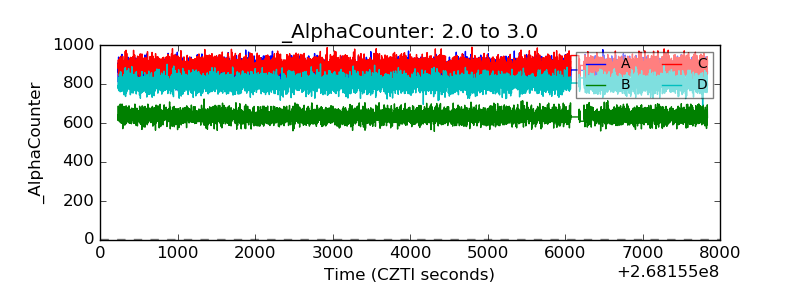 |
| _CPM_Rate | 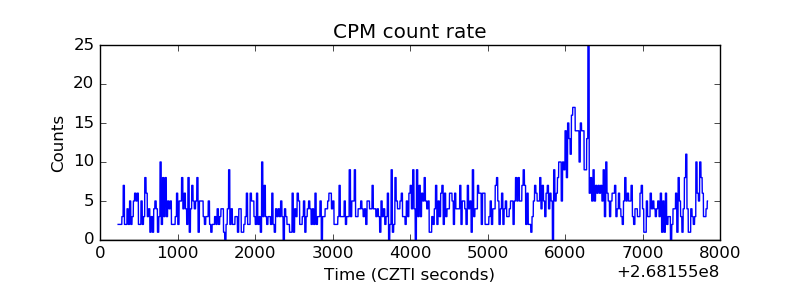 |
| CZT Counter | 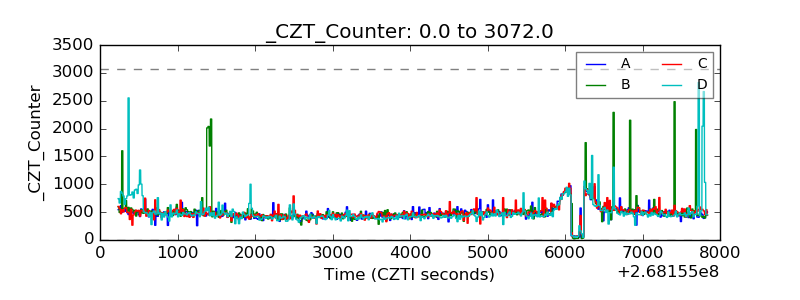 |
| +2.5 Volts monitor |  |
| +5 Volts monitor |  |
| _ROLL_ROT | 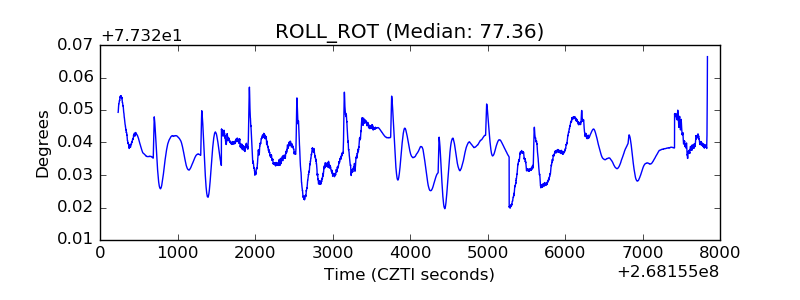 |
| _Roll_DEC | 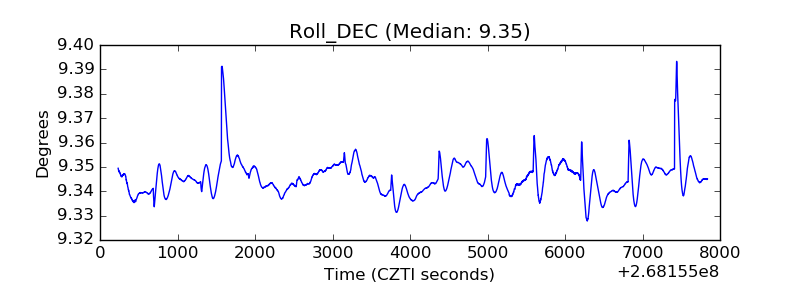 |
| _Roll_RA | 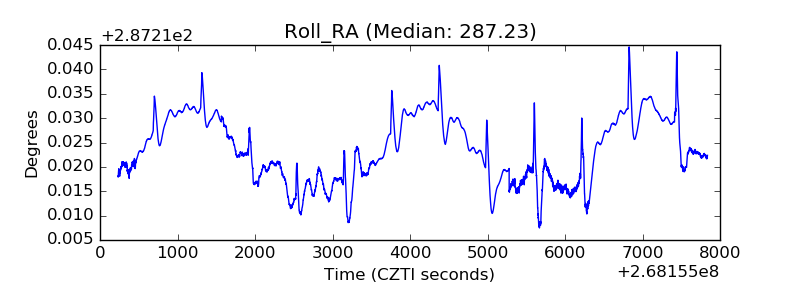 |
| Veto Counter | 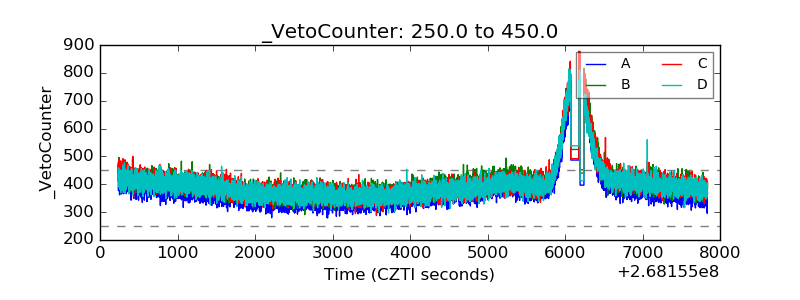 |