| Param | Original file | Final file |
|---|---|---|
| Filename | modeM0/AS1A04_099T01_9000002204_14916cztM0_level2.evt | modeM0/AS1A04_099T01_9000002204_14916cztM0_level2_quad_clean.evt |
| Size (bytes) | 1,041,978,240 | 169,729,920 |
| Size | 993.7 MB | 161.9 MB |
| Events in quadrant A | 6,446,454 | 1,080,395 |
| Events in quadrant B | 7,920,423 | 1,069,782 |
| Events in quadrant C | 7,655,085 | 1,044,648 |
| Events in quadrant D | 8,631,990 | 1,022,810 |
| Mode SS | |||
|---|---|---|---|
| Quadrant | BADHDUFLAG | Total packets | Discarded packets |
| A | 0 | 270 | 0 |
| B | 0 | 270 | 0 |
| C | 0 | 270 | 0 |
| D | 0 | 270 | 0 |
| Mode M0 | |||
|---|---|---|---|
| Quadrant | BADHDUFLAG | Total packets | Discarded packets |
| A | 0 | 27892 | 4 |
| B | 0 | 32410 | 3 |
| C | 0 | 31410 | 3 |
| D | 0 | 34974 | 3 |
| Mode M9 | |||
|---|---|---|---|
| Quadrant | BADHDUFLAG | Total packets | Discarded packets |
| A | 0 | 16 | 0 |
| B | 0 | 16 | 0 |
| C | 0 | 16 | 0 |
| D | 0 | 16 | 0 |
| Quadrant | Total seconds | Saturated seconds | Saturation percentage |
|---|---|---|---|
| A | 13368 | 203 | 1.518552% |
| B | 13368 | 437 | 3.269001% |
| C | 13368 | 341 | 2.550868% |
| D | 13368 | 511 | 3.822561% |
Noise dominated data is calculated using 1-second bins in cleaned event files. If a bin has >2000 counts, and if more than 50% of those come from <1% of pixels, then it is considered to be noise-dominated and hence unusable.
| Quadrant | # 1 sec bins | Bins with >0 counts | Bins with >2000 counts | High rate bins dominated by noise | Noise dominated (total time) | Noise dominated (detector-on time) | Marked lightcurve |
|---|---|---|---|---|---|---|---|
| A | 14809 | 13372 | 2 | 2 | 0.01% | 0.01% | 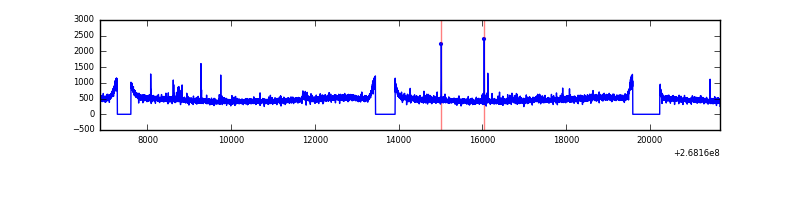 |
| B | 14809 | 13371 | 103 | 103 | 0.70% | 0.77% | 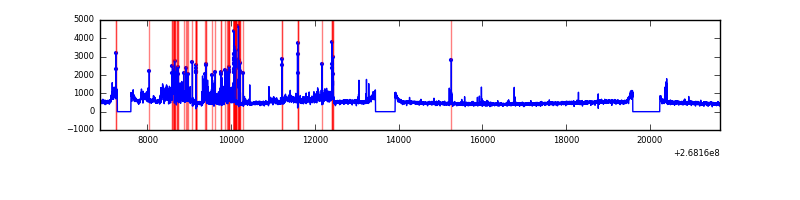 |
| C | 14809 | 13372 | 100 | 100 | 0.68% | 0.75% |  |
| D | 14809 | 13371 | 329 | 329 | 2.22% | 2.46% | 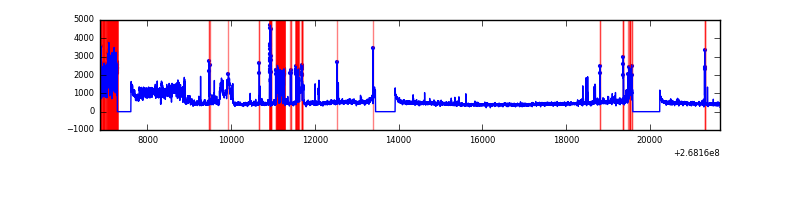 |
Top three noisy pixels from each quadrant. If the there are fewer than three noisy pixels in the level2.evt file, extra rows are filled as -1
| Pixel properties | Quadrant properties | ||||||
|---|---|---|---|---|---|---|---|
| Quadrant | DetID | PixID | Counts | Sigma | Mean | Median | Sigma |
| A | 12 | 189 | 95588 | 280.66 | 1640 | 1604 | 334.9 |
| A | 12 | 96 | 30797 | 87.18 | 1640 | 1604 | 334.9 |
| A | 3 | 1 | 21189 | 58.49 | 1640 | 1604 | 334.9 |
| B | 10 | 16 | 1530928 | 4830.68 | 1623 | 1580 | 316.6 |
| B | 12 | 111 | 39629 | 120.18 | 1623 | 1580 | 316.6 |
| B | 11 | 111 | 34124 | 102.8 | 1623 | 1580 | 316.6 |
| C | 9 | 236 | 1075463 | 2914.07 | 1588 | 1597 | 368.5 |
| C | 3 | 233 | 384309 | 1038.54 | 1588 | 1597 | 368.5 |
| C | 13 | 61 | 11183 | 26.01 | 1588 | 1597 | 368.5 |
| D | 7 | 254 | 2313654 | 6184.83 | 1561 | 1523 | 373.8 |
| D | 7 | 223 | 162595 | 430.86 | 1561 | 1523 | 373.8 |
| D | 13 | 168 | 142397 | 376.83 | 1561 | 1523 | 373.8 |
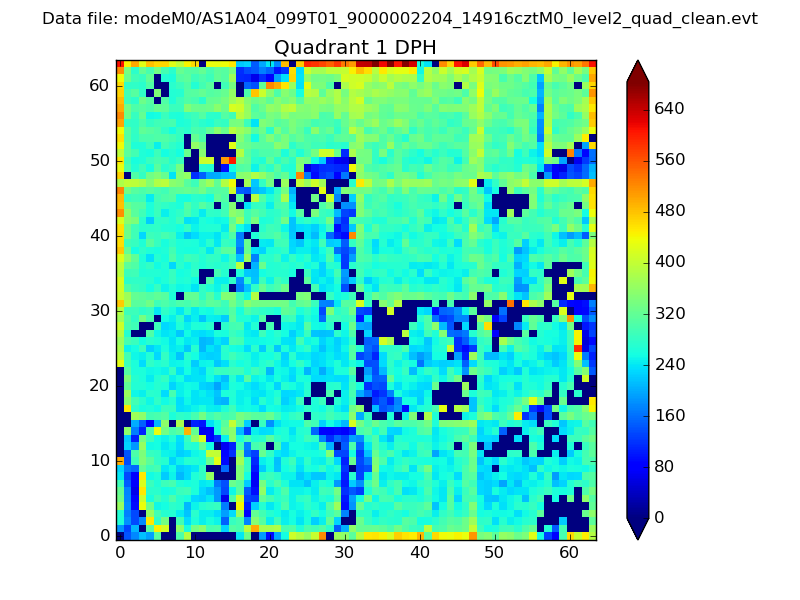
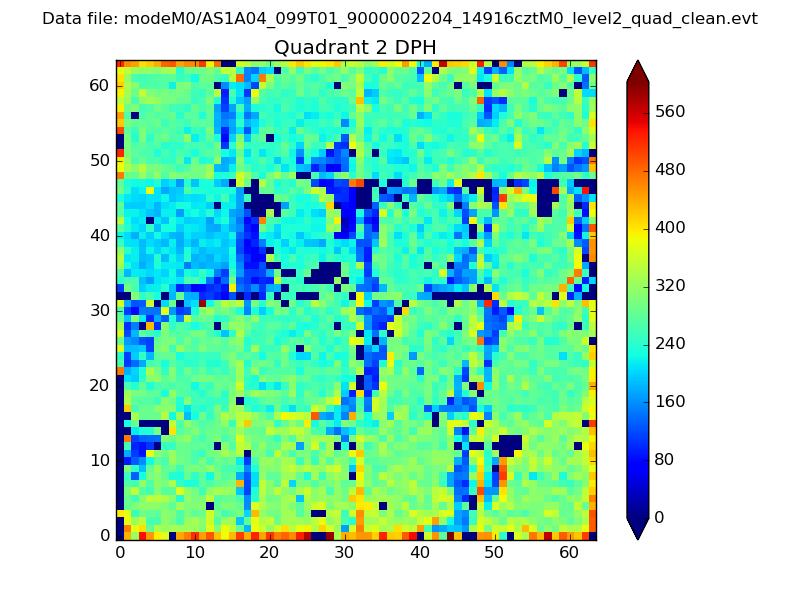
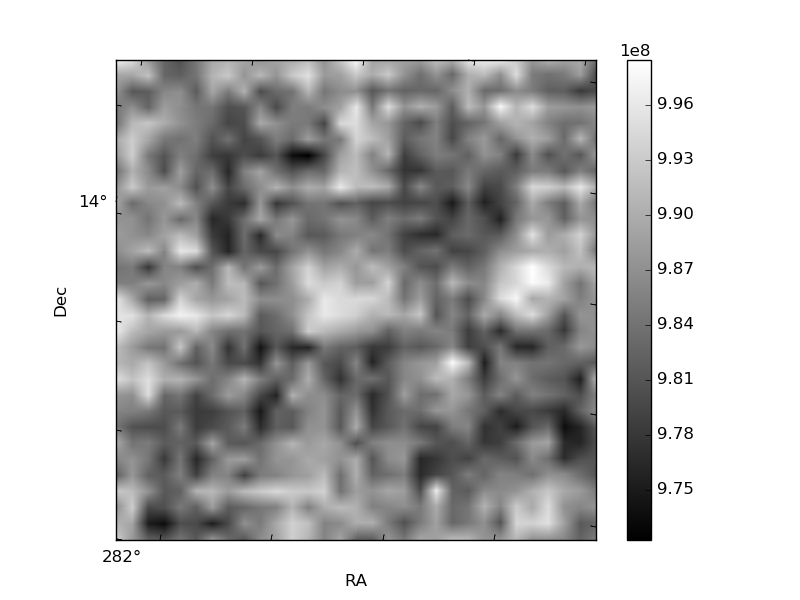
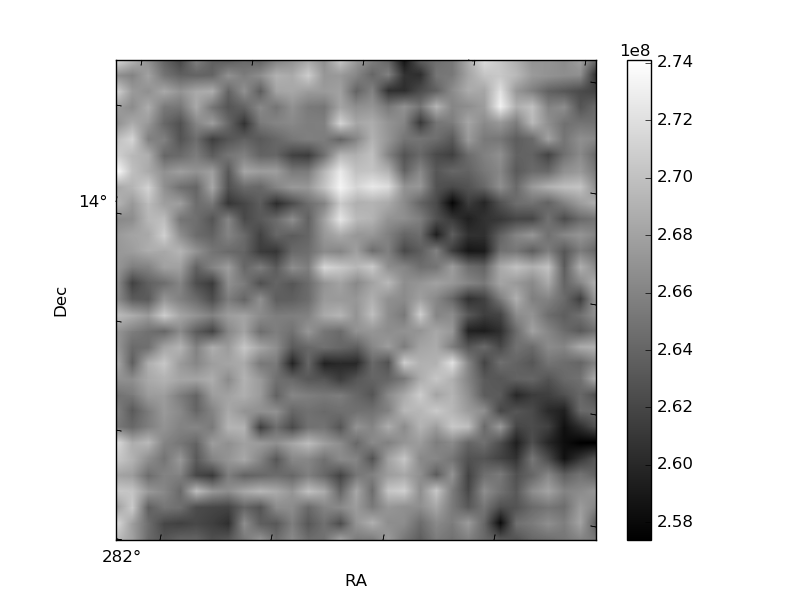
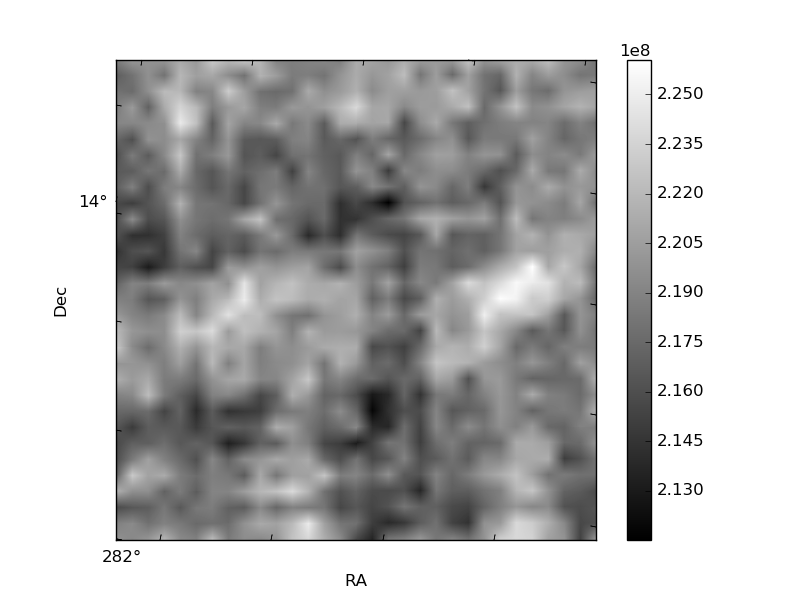
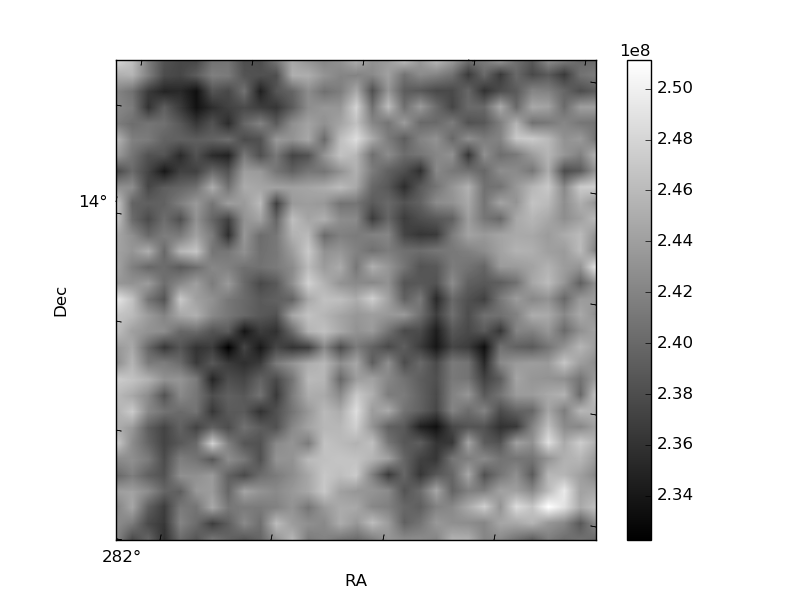
Histogram calculated using DETX and DETY for each event in the final _common_clean file
| Quadrant A | 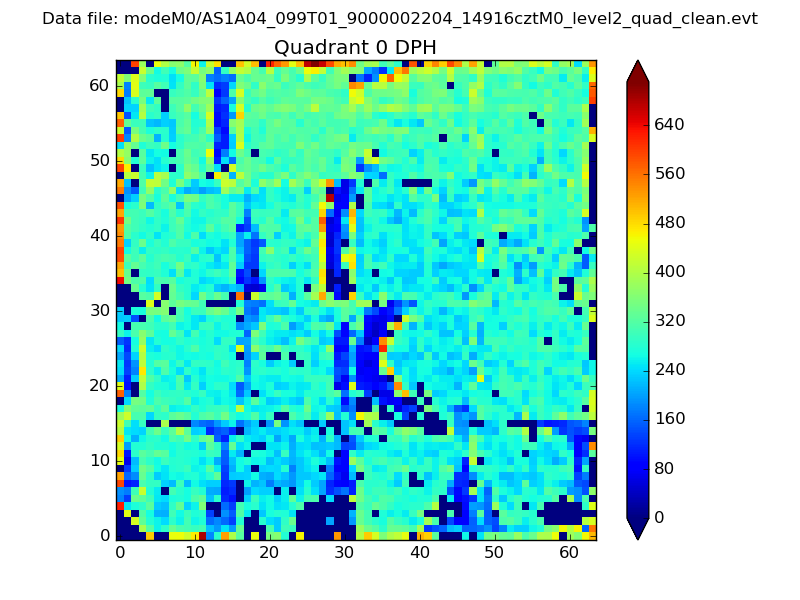 |
 |
Quadrant B |
|---|---|---|---|
| Quadrant D | 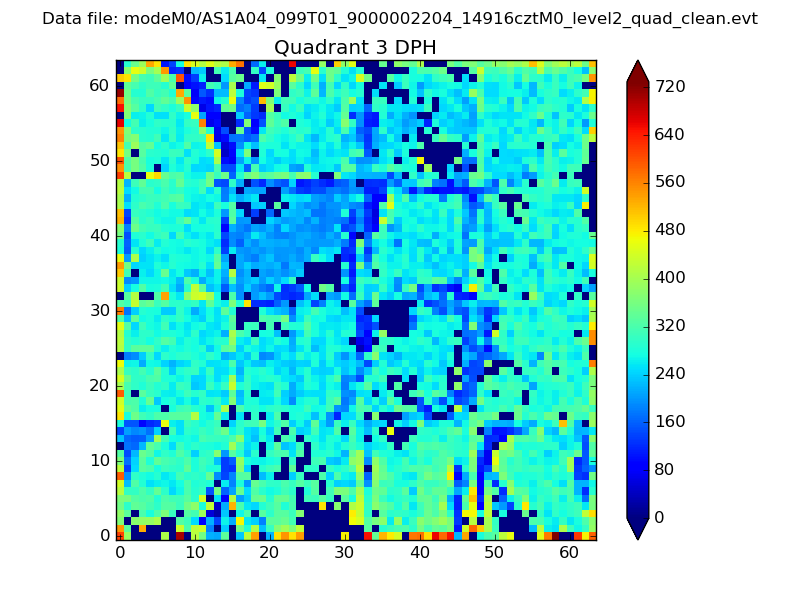 |
 |
Quadrant C |
| Plot type | Count rate plots | Images |
|---|---|---|
| Comparison with Poisson distribution Blue bars denote a histogram of data divided into 1 sec bins. Red curve is a Poisson curve with rate = median count rate of data. |
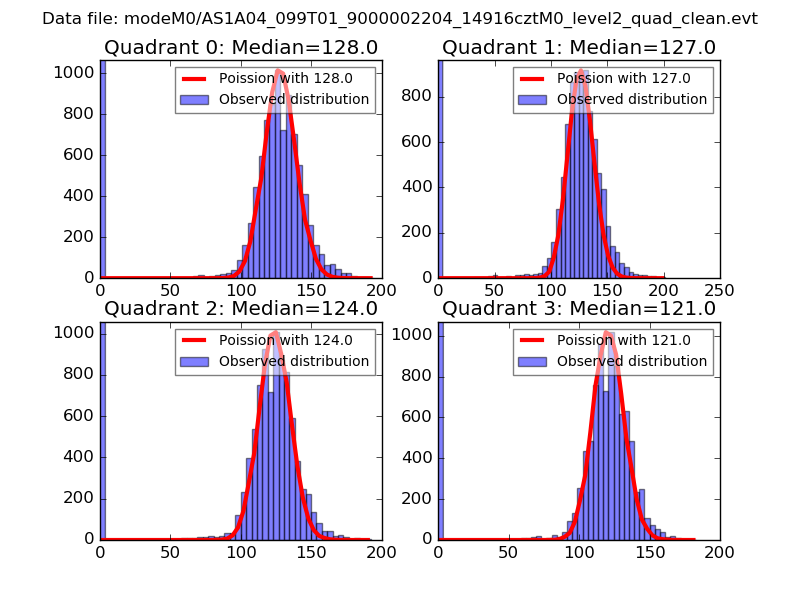 |
 |
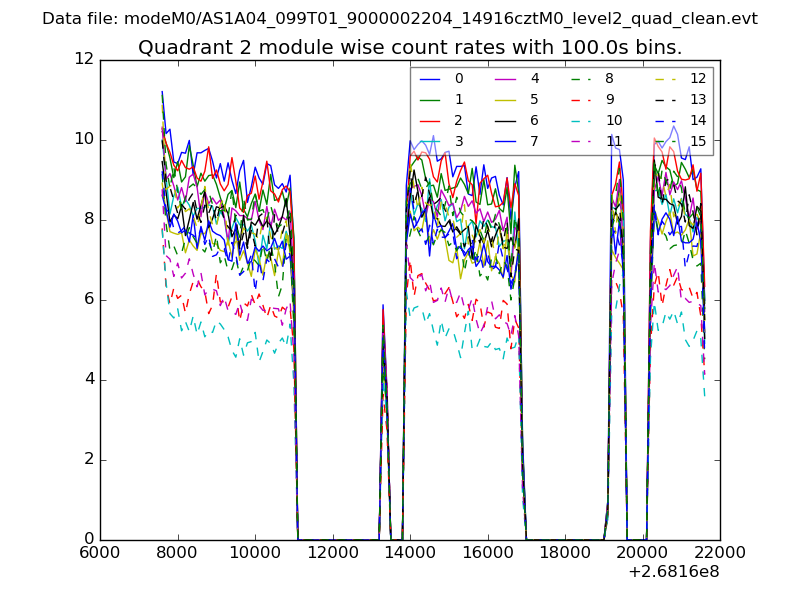
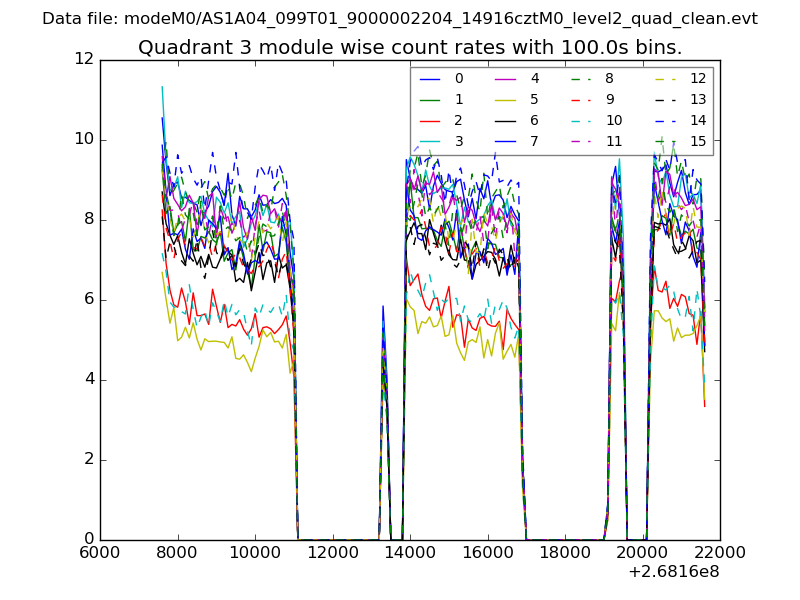
| Quadrant-wise count rates Data is divided into 100 sec bins |
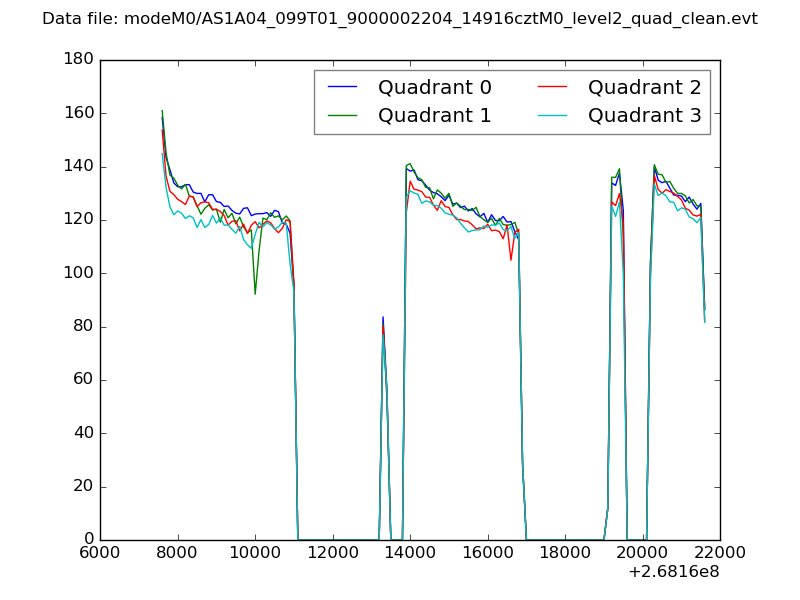 |
|
| Module-wise count rates for Quadrant A Data is divided into 100 sec bins |
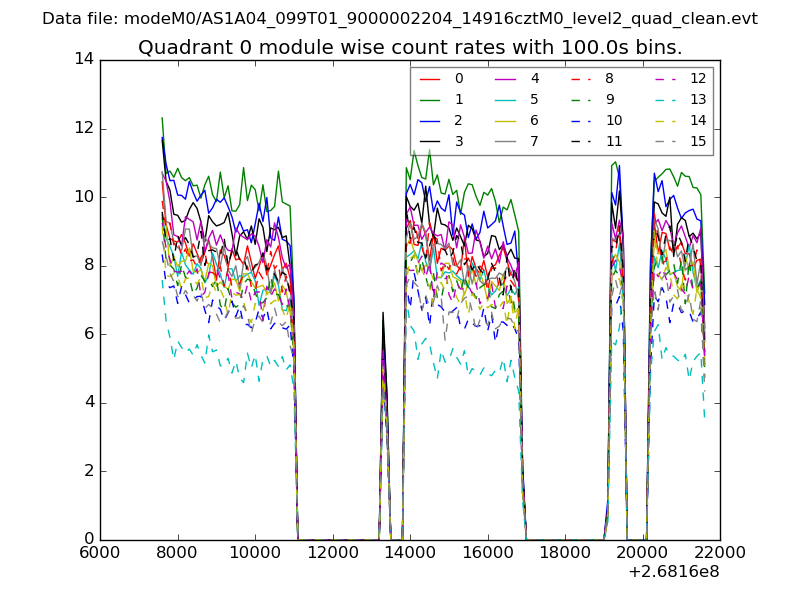 |
 |
| Module-wise count rates for Quadrant B Data is divided into 100 sec bins |
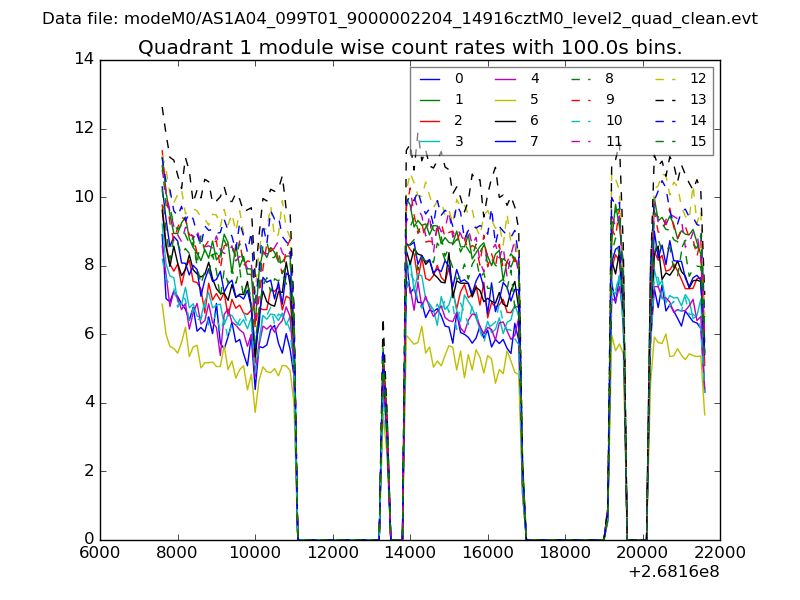 |
 |
| Module-wise count rates for Quadrant C Data is divided into 100 sec bins |
 |
 |
| Module-wise count rates for Quadrant D Data is divided into 100 sec bins |
 |
 |
| Parameter | Plot |
|---|---|
| CZT HV Monitor | 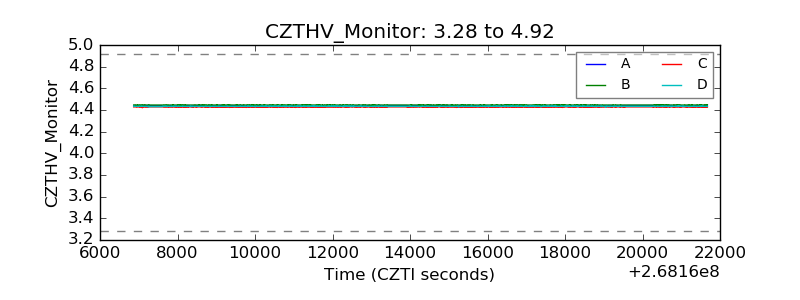 |
| D_VDD | 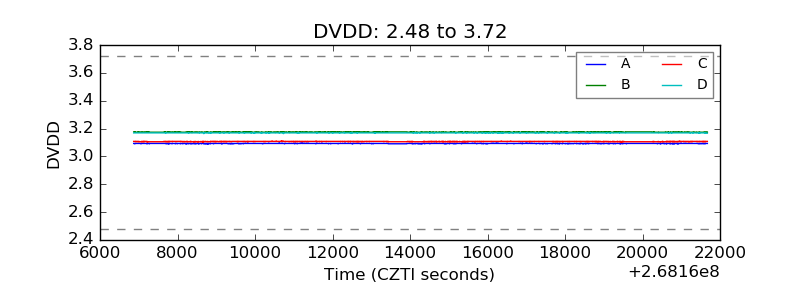 |
| Temperature 1 | 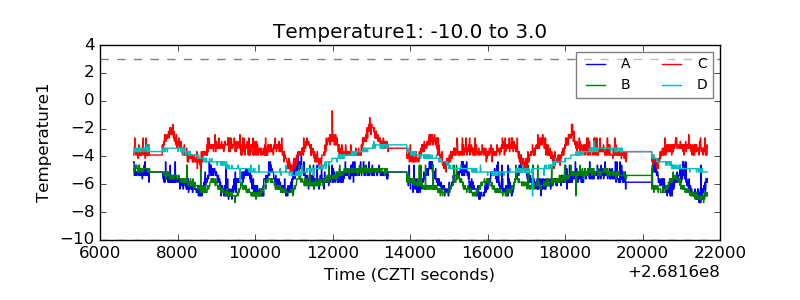 |
| Veto HV Monitor | 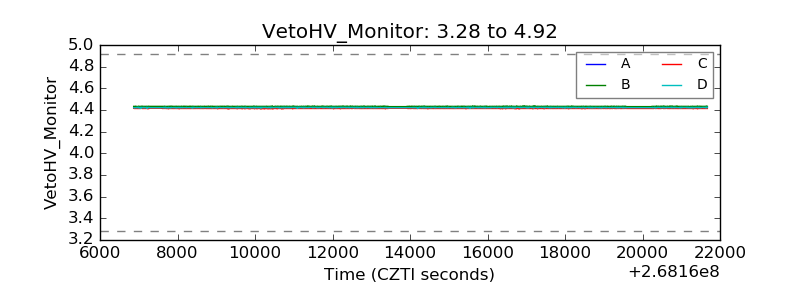 |
| Veto LLD | 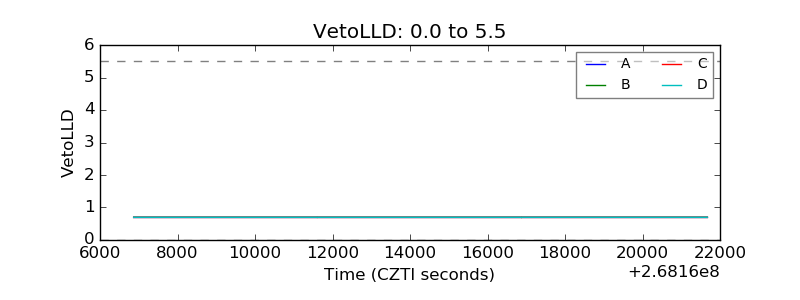 |
| Alpha Counter | 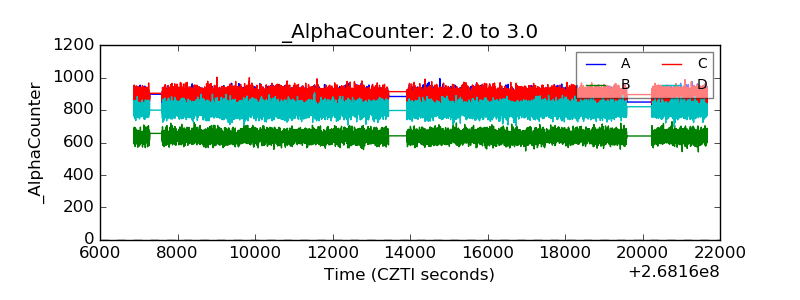 |
| _CPM_Rate | 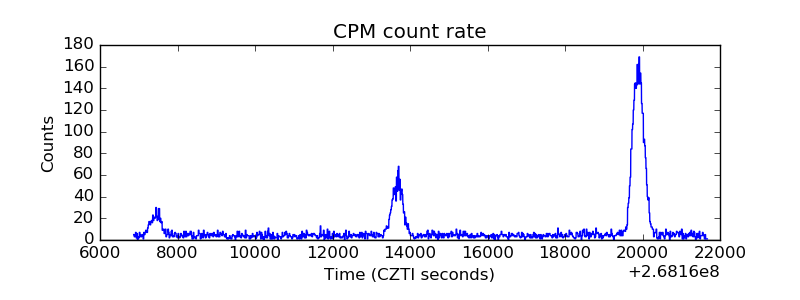 |
| CZT Counter | 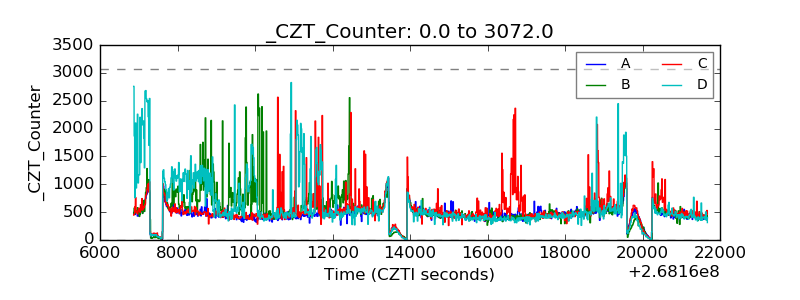 |
| +2.5 Volts monitor | 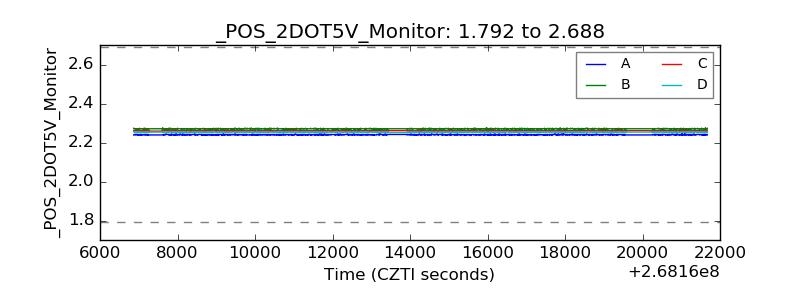 |
| +5 Volts monitor |  |
| _ROLL_ROT | 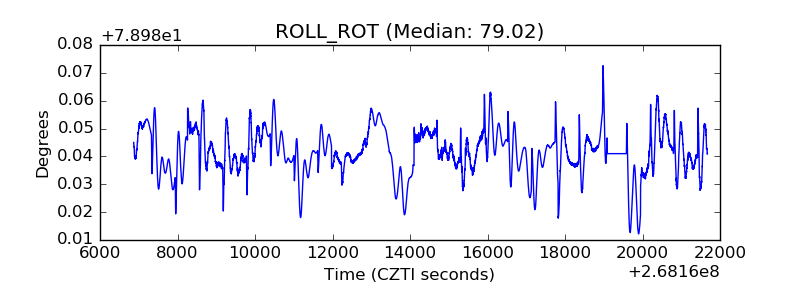 |
| _Roll_DEC | 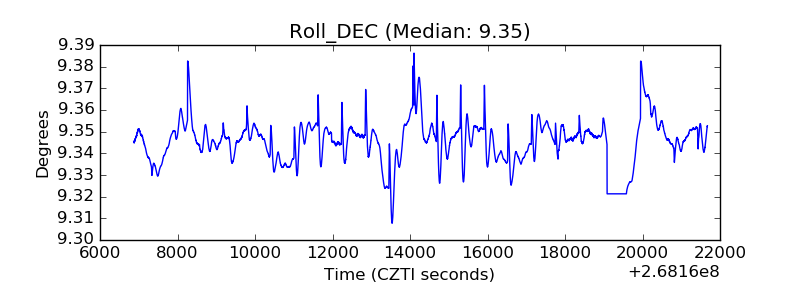 |
| _Roll_RA | 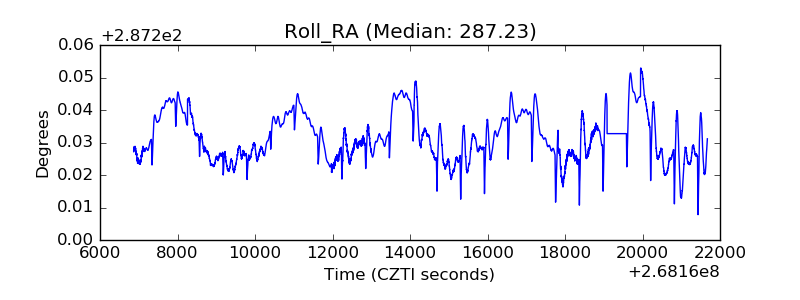 |
| Veto Counter | 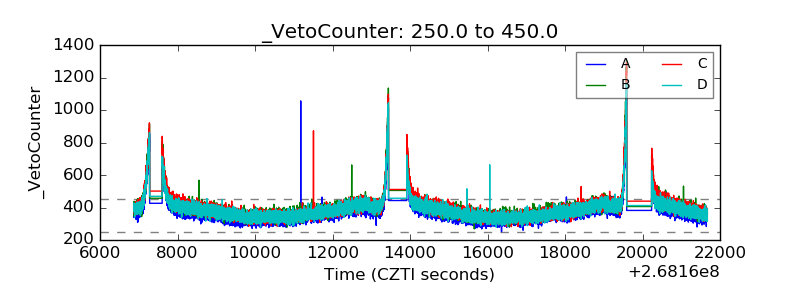 |