| Param | Original file | Final file |
|---|---|---|
| Filename | modeM0/AS1A04_099T01_9000002204_14919cztM0_level2.evt | modeM0/AS1A04_099T01_9000002204_14919cztM0_level2_quad_clean.evt |
| Size (bytes) | 687,395,520 | 88,139,520 |
| Size | 655.6 MB | 84.1 MB |
| Events in quadrant A | 3,079,234 | 590,321 |
| Events in quadrant B | 10,747,748 | 509,797 |
| Events in quadrant C | 3,356,274 | 566,233 |
| Events in quadrant D | 3,201,731 | 556,616 |
| Mode SS | |||
|---|---|---|---|
| Quadrant | BADHDUFLAG | Total packets | Discarded packets |
| A | 0 | 130 | 0 |
| B | 0 | 130 | 0 |
| C | 0 | 130 | 0 |
| D | 0 | 130 | 0 |
| Mode M0 | |||
|---|---|---|---|
| Quadrant | BADHDUFLAG | Total packets | Discarded packets |
| A | 0 | 13063 | 3 |
| B | 0 | 36086 | 2 |
| C | 0 | 13847 | 2 |
| D | 0 | 13688 | 2 |
| Mode M9 | |||
|---|---|---|---|
| Quadrant | BADHDUFLAG | Total packets | Discarded packets |
| A | 0 | 11 | 0 |
| B | 0 | 11 | 0 |
| C | 0 | 11 | 0 |
| D | 0 | 11 | 0 |
| Quadrant | Total seconds | Saturated seconds | Saturation percentage |
|---|---|---|---|
| A | 6385 | 34 | 0.532498% |
| B | 6385 | 3325 | 52.075176% |
| C | 6385 | 54 | 0.845732% |
| D | 6386 | 74 | 1.158785% |
Noise dominated data is calculated using 1-second bins in cleaned event files. If a bin has >2000 counts, and if more than 50% of those come from <1% of pixels, then it is considered to be noise-dominated and hence unusable.
| Quadrant | # 1 sec bins | Bins with >0 counts | Bins with >2000 counts | High rate bins dominated by noise | Noise dominated (total time) | Noise dominated (detector-on time) | Marked lightcurve |
|---|---|---|---|---|---|---|---|
| A | 7526 | 6387 | 0 | 0 | 0.00% | 0.00% | 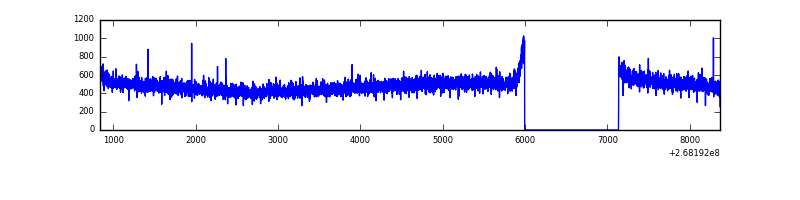 |
| B | 7526 | 6387 | 3027 | 3027 | 40.22% | 47.39% | 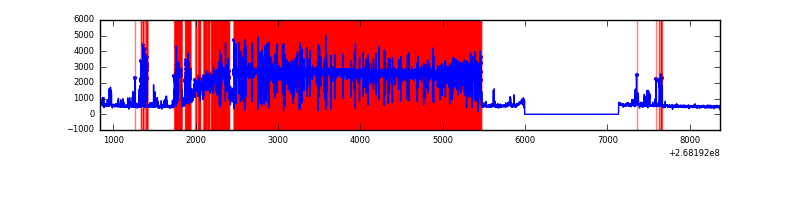 |
| C | 7526 | 6387 | 26 | 26 | 0.35% | 0.41% | 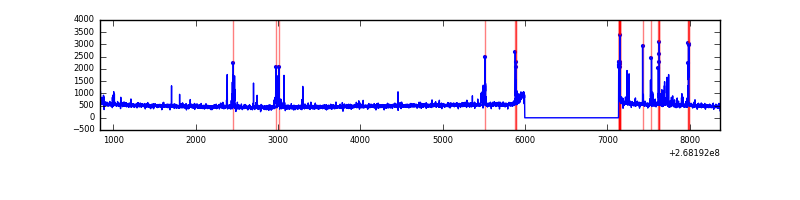 |
| D | 7527 | 6388 | 53 | 53 | 0.70% | 0.83% | 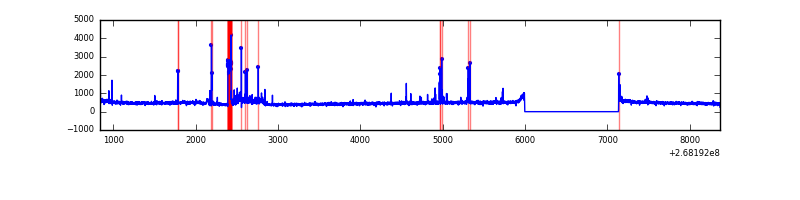 |
Top three noisy pixels from each quadrant. If the there are fewer than three noisy pixels in the level2.evt file, extra rows are filled as -1
| Pixel properties | Quadrant properties | ||||||
|---|---|---|---|---|---|---|---|
| Quadrant | DetID | PixID | Counts | Sigma | Mean | Median | Sigma |
| A | 12 | 189 | 7494 | 41.38 | 799 | 783 | 162.2 |
| A | 0 | 226 | 7218 | 39.68 | 799 | 783 | 162.2 |
| A | 12 | 194 | 5766 | 30.73 | 799 | 783 | 162.2 |
| B | 10 | 16 | 8546760 | 79022.75 | 563 | 550 | 108.1 |
| B | 12 | 111 | 12719 | 112.52 | 563 | 550 | 108.1 |
| B | 11 | 111 | 10815 | 94.92 | 563 | 550 | 108.1 |
| C | 9 | 236 | 217516 | 1234.89 | 762 | 769 | 175.5 |
| C | 3 | 233 | 165833 | 940.43 | 762 | 769 | 175.5 |
| C | 13 | 61 | 5334 | 26.01 | 762 | 769 | 175.5 |
| D | 7 | 223 | 258396 | 1419.33 | 760 | 744 | 181.5 |
| D | 13 | 249 | 35853 | 193.41 | 760 | 744 | 181.5 |
| D | 2 | 234 | 19792 | 104.93 | 760 | 744 | 181.5 |
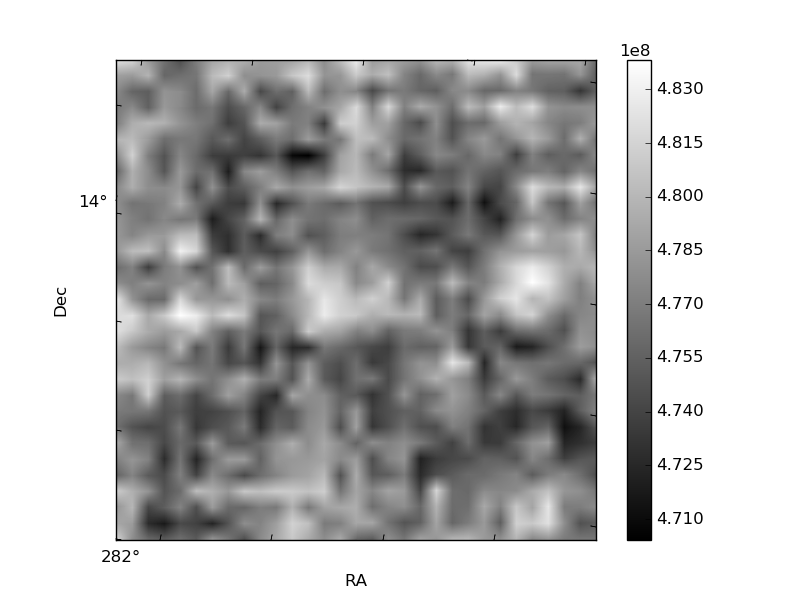
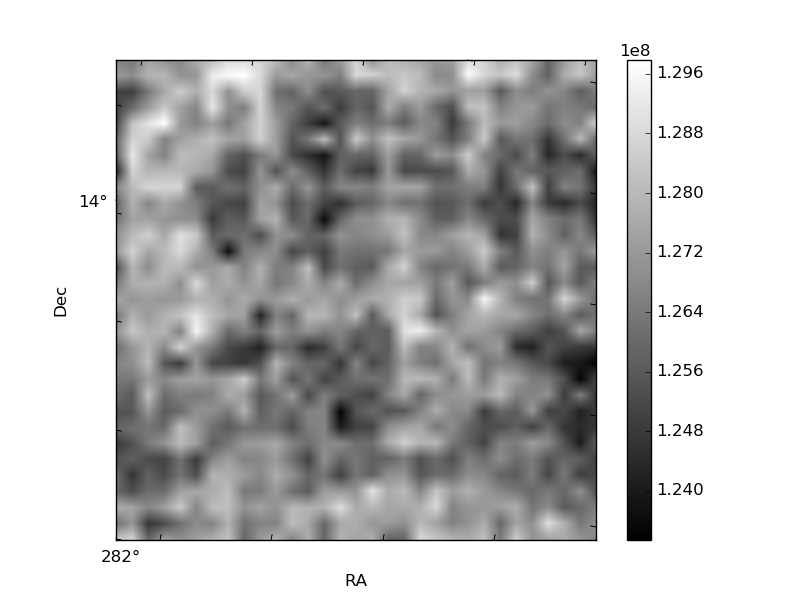
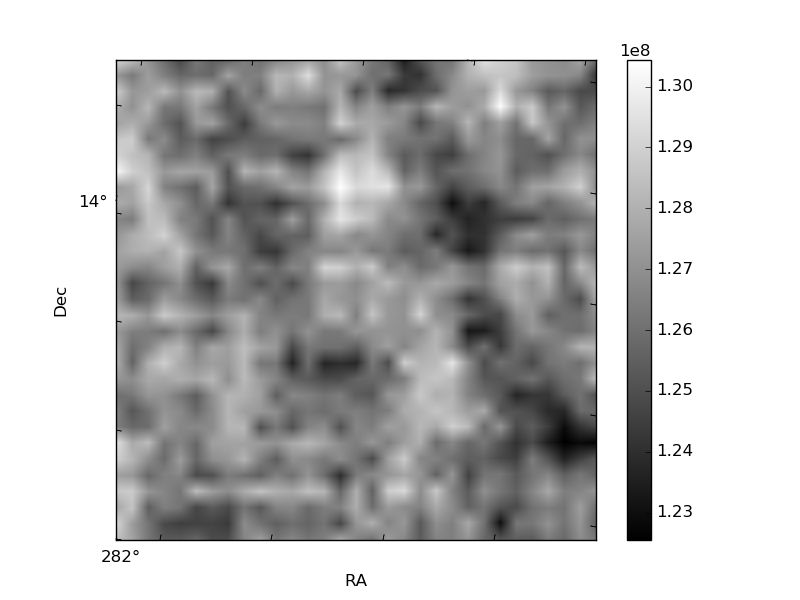
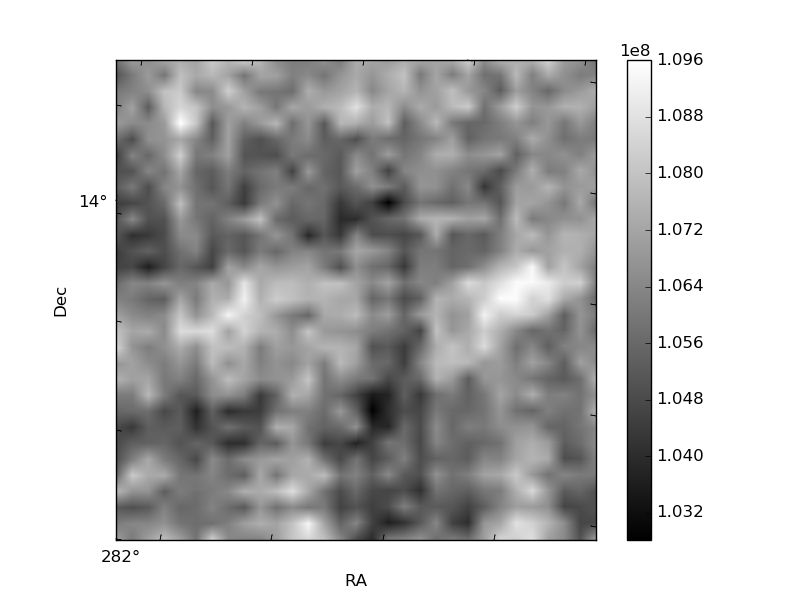
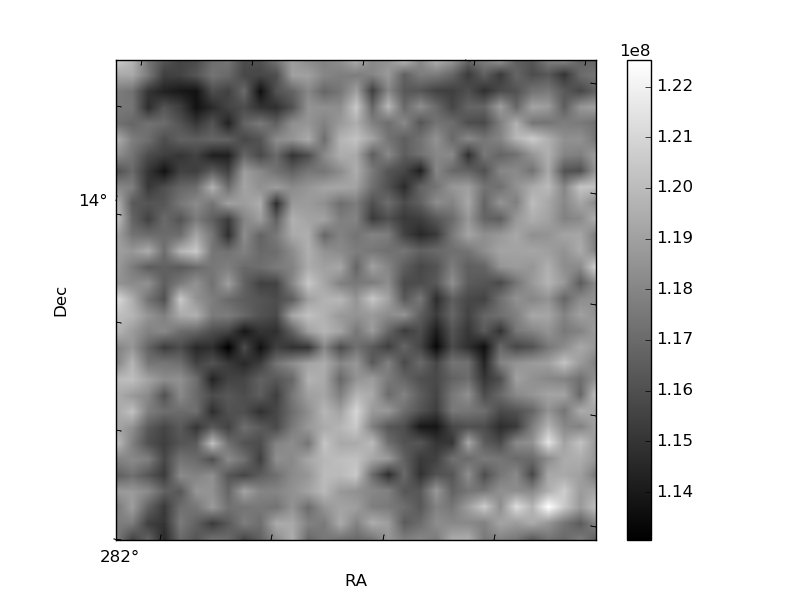
Histogram calculated using DETX and DETY for each event in the final _common_clean file
| Quadrant A | 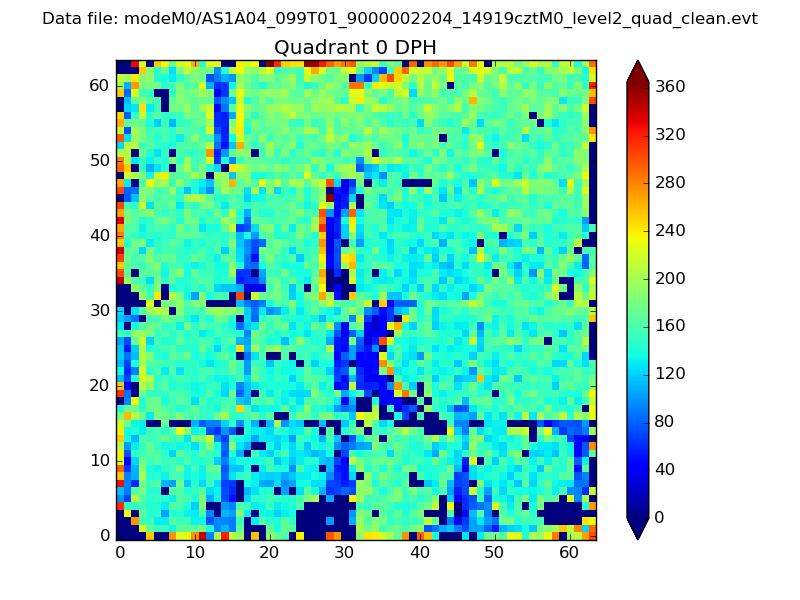 |
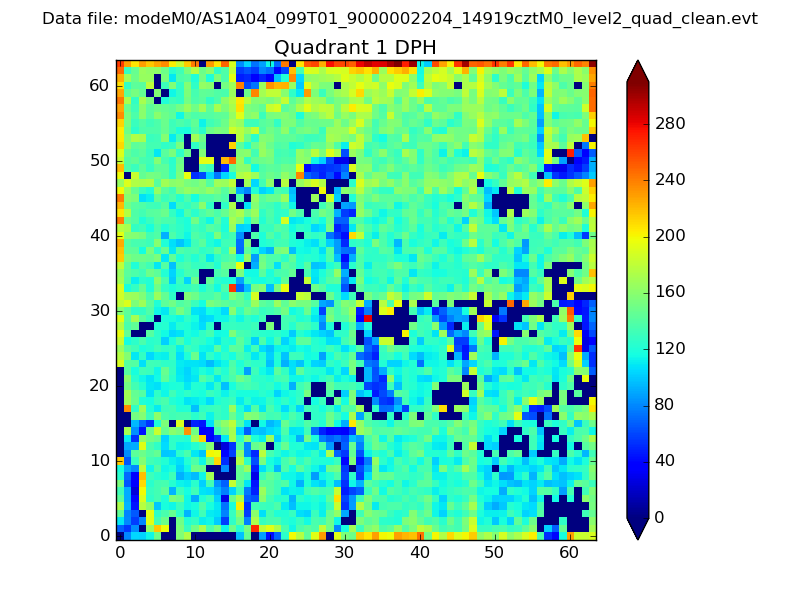 |
Quadrant B |
|---|---|---|---|
| Quadrant D | 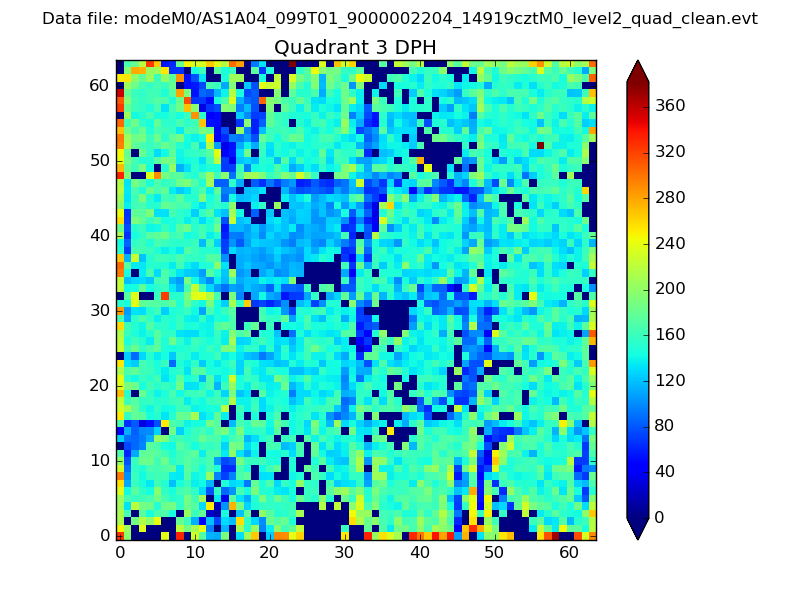 |
 |
Quadrant C |
| Plot type | Count rate plots | Images |
|---|---|---|
| Comparison with Poisson distribution Blue bars denote a histogram of data divided into 1 sec bins. Red curve is a Poisson curve with rate = median count rate of data. |
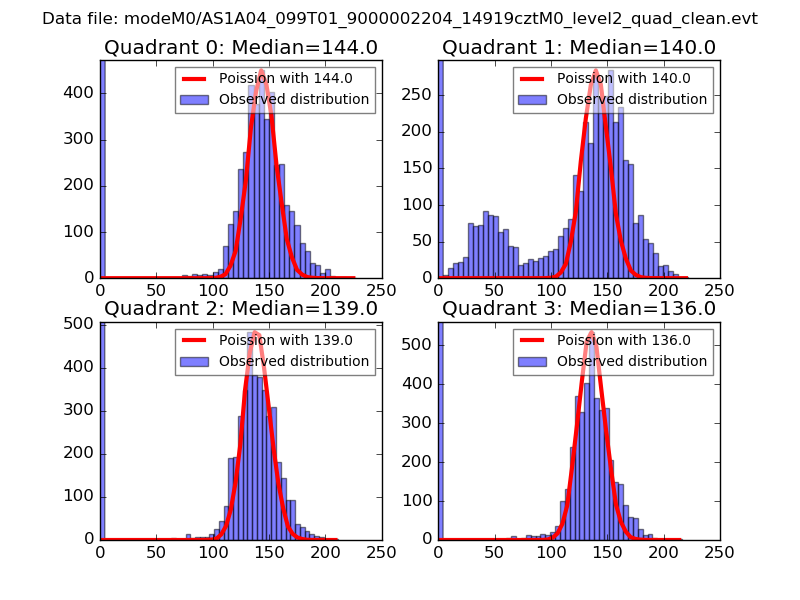 |
 |
| Quadrant-wise count rates Data is divided into 100 sec bins |
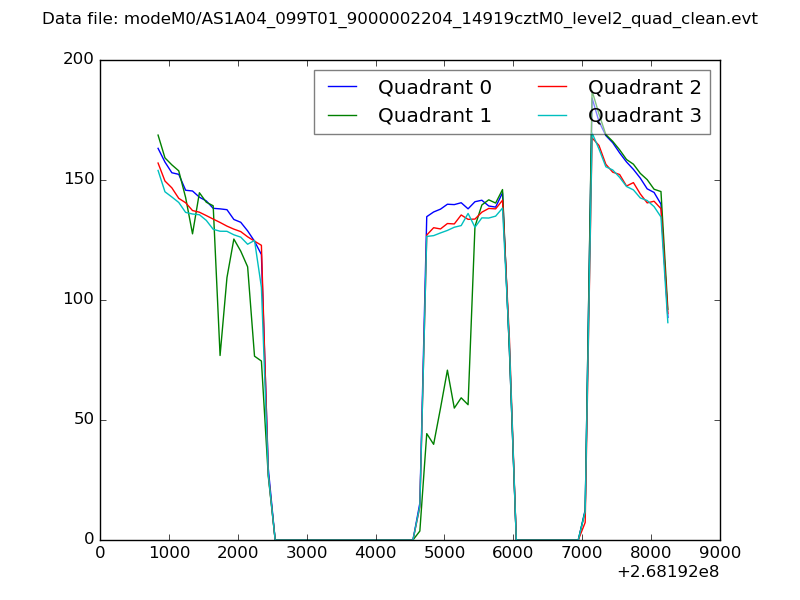 |
|
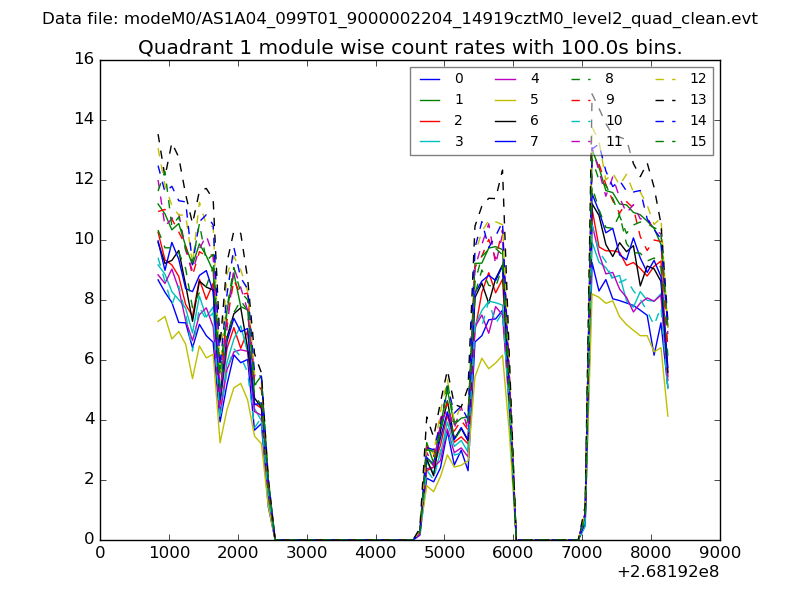
| Module-wise count rates for Quadrant A Data is divided into 100 sec bins |
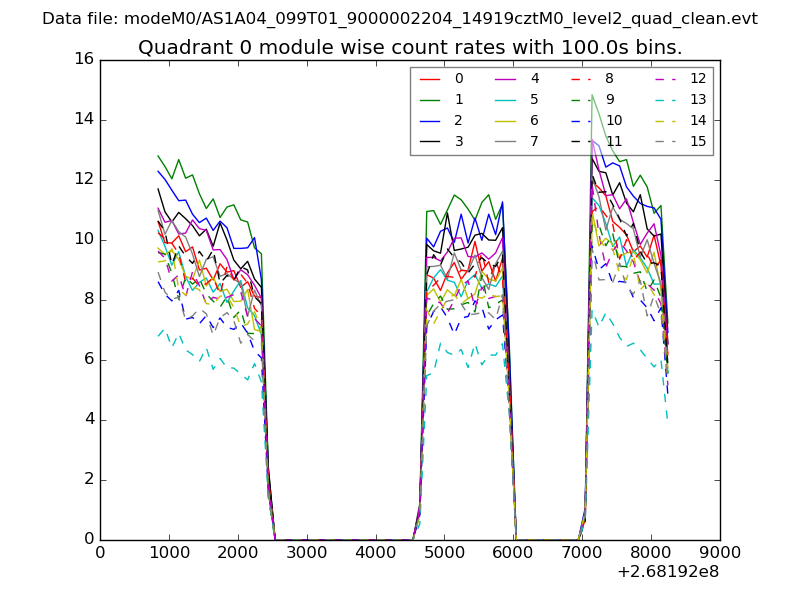 |
 |
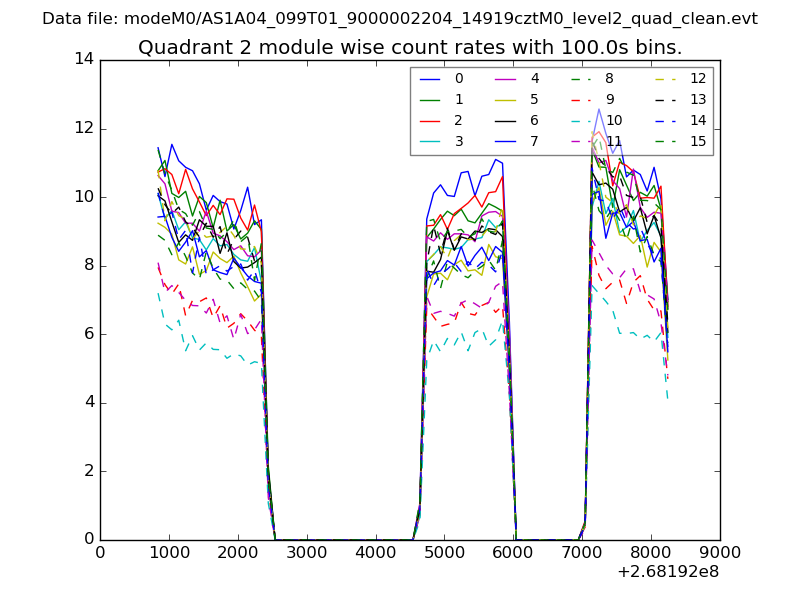
| Module-wise count rates for Quadrant B Data is divided into 100 sec bins |
 |
 |
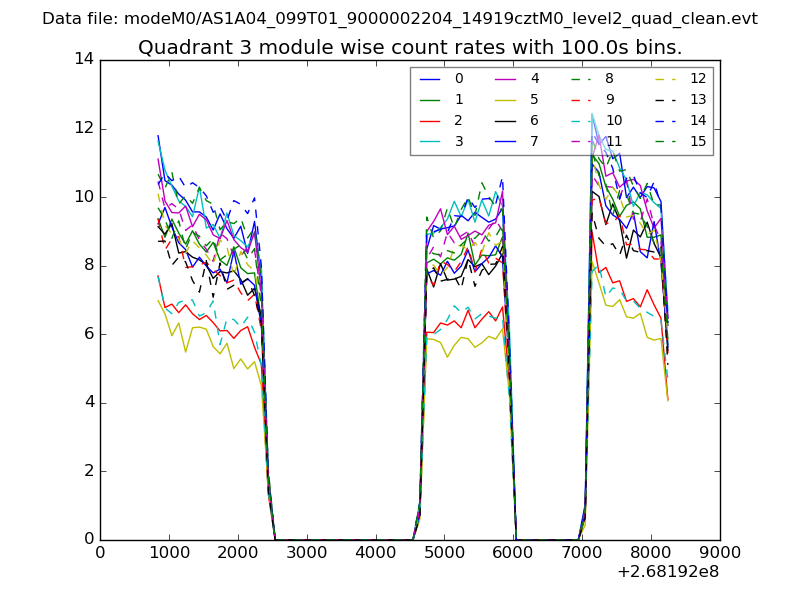
| Module-wise count rates for Quadrant C Data is divided into 100 sec bins |
 |
 |
| Module-wise count rates for Quadrant D Data is divided into 100 sec bins |
 |
 |
| Parameter | Plot |
|---|---|
| CZT HV Monitor | 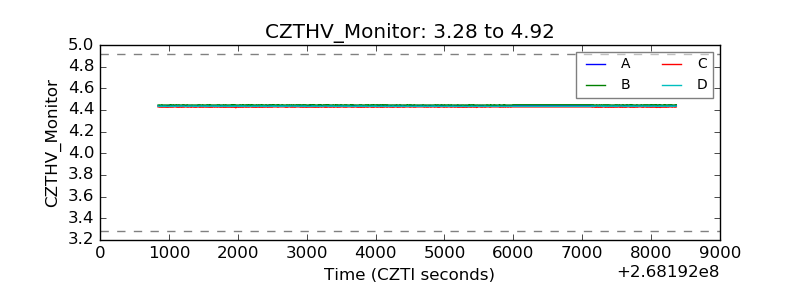 |
| D_VDD | 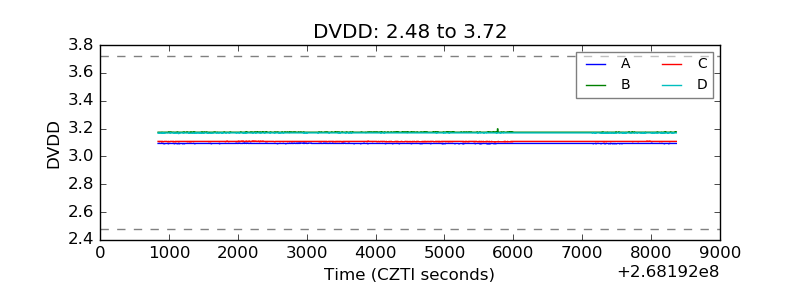 |
| Temperature 1 | 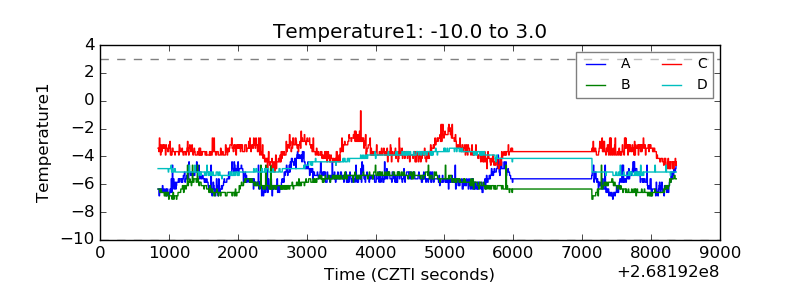 |
| Veto HV Monitor | 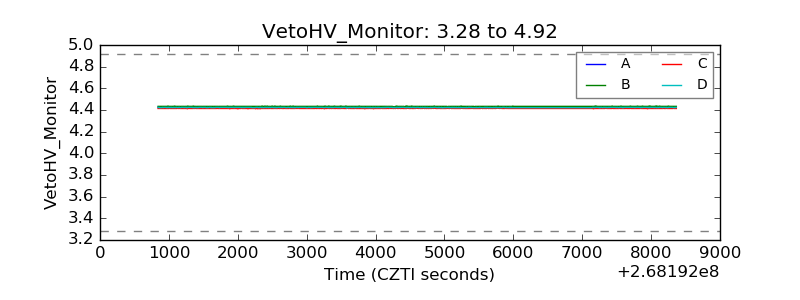 |
| Veto LLD | 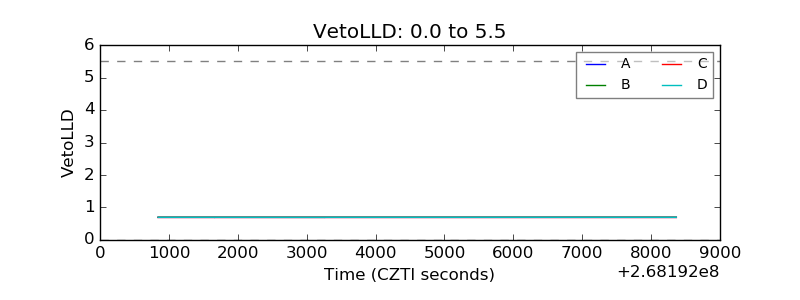 |
| Alpha Counter | 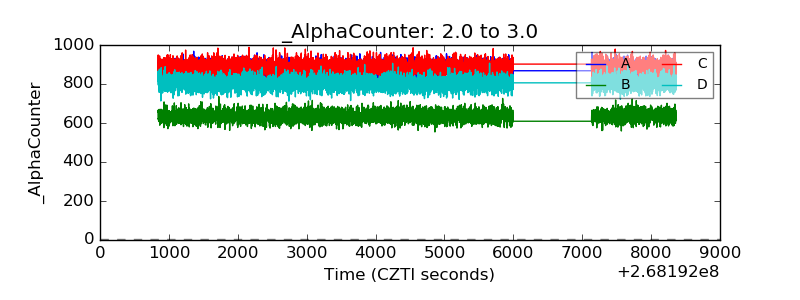 |
| _CPM_Rate | 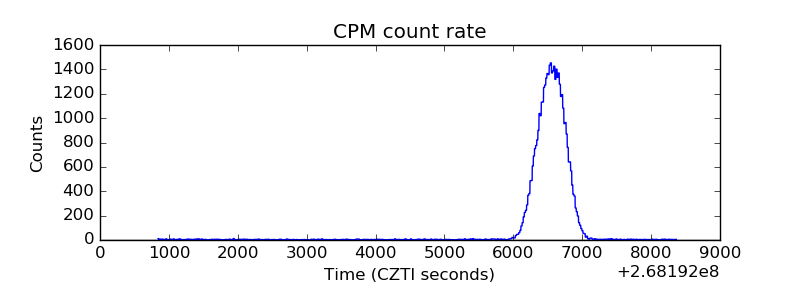 |
| CZT Counter | 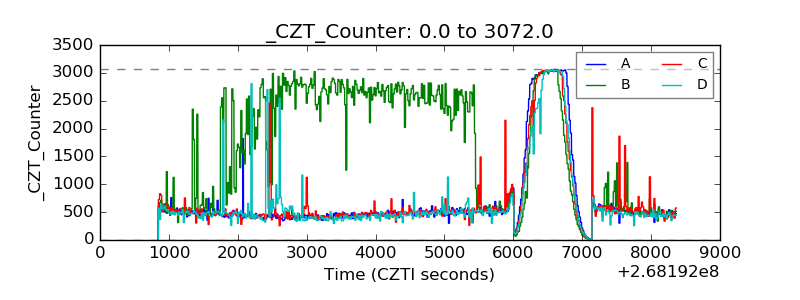 |
| +2.5 Volts monitor |  |
| +5 Volts monitor |  |
| _ROLL_ROT | 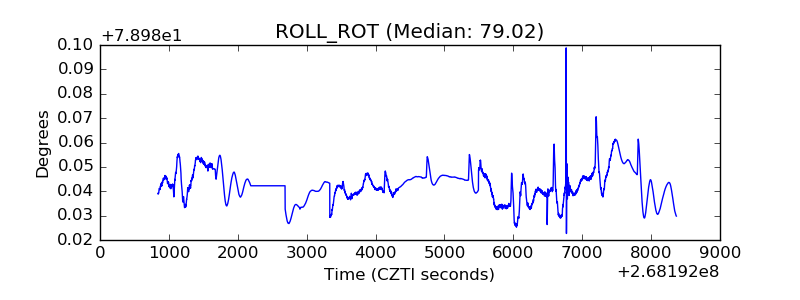 |
| _Roll_DEC | 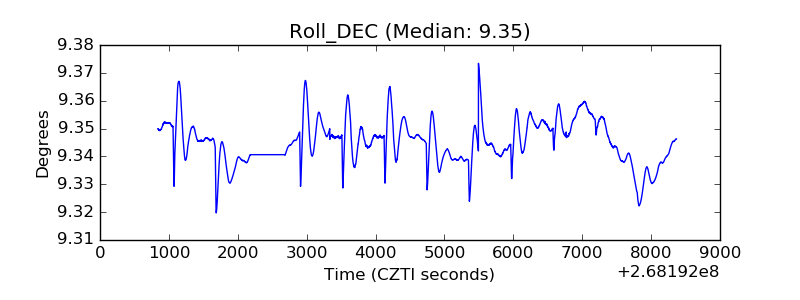 |
| _Roll_RA | 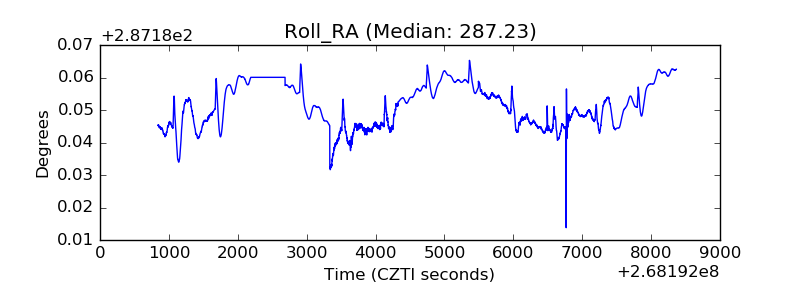 |
| Veto Counter | 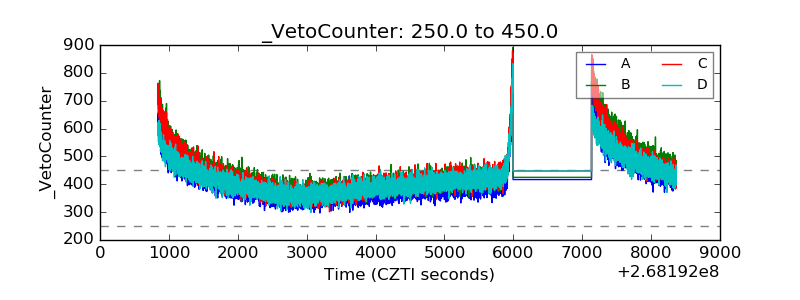 |